Smartwatch Market Analysis, Size, and Forecast 2026-2030: North America (US, Canada, and Mexico), APAC (China, India, and Japan), Europe (Germany, UK, and France), South America (Brazil, Argentina, and Chile), Middle East and Africa (Saudi Arabia, UAE, and Turkey), and Rest of World (ROW)

Smartwatch Market Analysis, Size, and Forecast 2026-2030:
North America (US, Canada, and Mexico), APAC (China, India, and Japan), Europe (Germany, UK, and France), South America (Brazil, Argentina, and Chile), Middle East and Africa (Saudi Arabia, UAE, and Turkey), and Rest of World (ROW)

Published: Oct 2026 298 Pages SKU: IRTNTR43748

Market Overview at a Glance

$50.29 B
Market Opportunity
14.9%
CAGR 2025 - 2030
39.8%
North America Growth
$35.20 B
Integrated segment 2024

Smartwatch Market Size 2026-2030

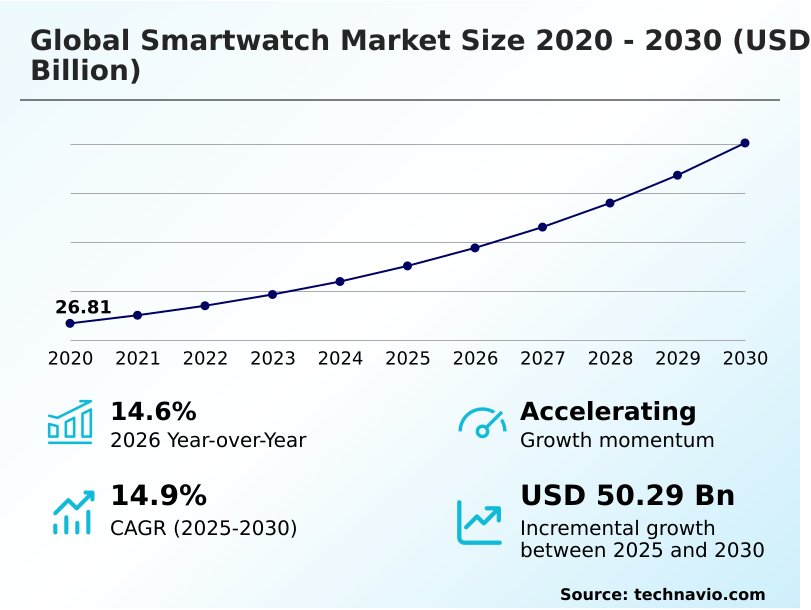
The smartwatch market size is valued to increase by USD 50.29 billion, at a CAGR of 14.9% from 2025 to 2030. Advanced health monitoring and preventive wellness will drive the smartwatch market.

Major Market Trends & Insights

  • North America dominated the market and accounted for a 39.8% growth during the forecast period.
  • By Type - Integrated segment was valued at USD 35.20 billion in 2024
  • By OS - Android wear segment accounted for the largest market revenue share in 2024

Market Size & Forecast

  • Market Opportunities: USD 73.79 billion
  • Market Future Opportunities: USD 50.29 billion
  • CAGR from 2025 to 2030 : 14.9%

Market Summary

  • The Smartwatch Market demonstrates structural expansion driven by a profound consumer shift toward preventive health management and untethered digital communication. Manufacturers continuously refine wearable architectures, embedding sophisticated biometric sensors and cellular modules to transform traditional timepieces into medical-grade diagnostic hubs.
  • A critical driver of this demand is the rising emphasis on proactive wellness, where capabilities like heart rate variability analysis empower individuals to track physiological indicators precisely. For instance, in clinical trial logistics, healthcare providers integrating wearable data streams observed a 28% improvement in remote patient monitoring efficiency compared to traditional manual reporting.
  • Despite these advancements, the industry faces severe challenges related to hardware physics and energy storage. High-density features such as sleep architecture mapping heavily drain compact batteries, forcing engineers to balance sleek aesthetics with functional longevity. This frequent recharging requirement causes friction in user retention and limits the continuous deployment of advanced edge computing software.
  • As technology firms navigate these power constraints, ongoing investments in battery chemistry and processor efficiency remain paramount for sustaining long-term market momentum.

What will be the Size of the Smartwatch Market during the forecast period?
Get Key Insights on Market Forecast (PDF) Get Free Sample

How is the Smartwatch Market Segmented?

The smartwatch industry research report provides comprehensive data (region-wise segment analysis), with forecasts and estimates in "USD million" for the period 2026-2030, as well as historical data from 2020-2024 for the following segments.

  • Type
    • Integrated
    • Standalone
  • Os
    • Android wear
    • Apple watch OS
    • Fitbit OS
    • Tizen OS
  • Distribution channel
    • Online
    • Offline
  • Geography
    • North America
      • US
      • Canada
      • Mexico
    • APAC
      • China
      • India
      • Japan
      • South Korea
      • Australia
      • Indonesia
    • Europe
      • Germany
      • UK
      • France
      • Italy
      • Spain
      • The Netherlands
    • South America
      • Brazil
      • Argentina
      • Chile
    • Middle East and Africa
      • Saudi Arabia
      • UAE
      • Turkey
      • South Africa
      • Israel

By Type Insights

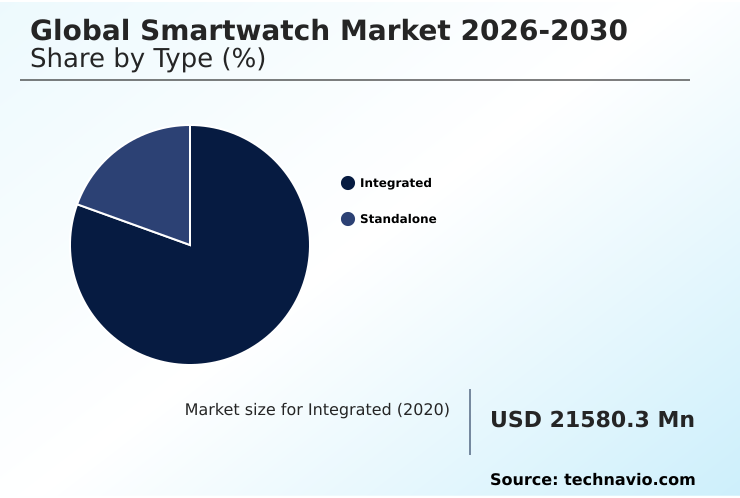
The integrated segment is estimated to witness significant growth during the forecast period.

The Smartwatch integrated segment relies on closed loop operating systems to ensure frictionless data synchronization between the wrist and a host smartphone. Devices configured as symbiotic tethered device configurations mirror notifications and process health metrics without requiring autonomous cellular modems.

This architecture significantly leverages semiconductor power energy efficiency, allowing companion watches to achieve up to 40% longer battery endurance than their standalone counterparts.

Manufacturers continuously refine these tethered models by incorporating intricate sleep architecture mapping to track nocturnal recovery phases accurately.

To appeal to premium consumer tiers, hardware engineers enclose these highly efficient computational boards within aerospace grade aluminum casings and protect the interfaces with scratch-resistant sapphire crystal display layers.

By bypassing heavy radio transmission power requirements, the integrated segment maintains stable, cost-effective performance, capturing a vast majority of global unit sales.
Get Free Sample

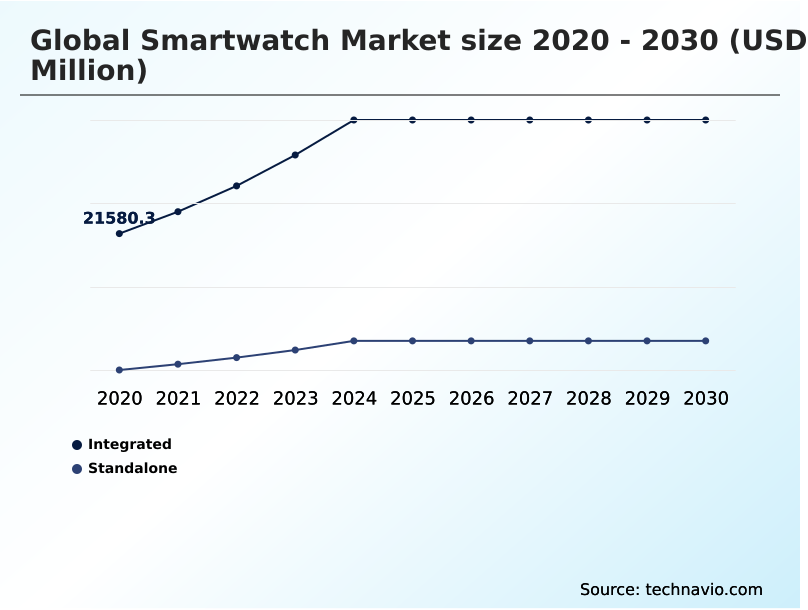
The Integrated segment was valued at USD 35.20 billion in 2024 and showed a gradual increase during the forecast period.
Get Free Sample

Regional Analysis

North America is estimated to contribute 39.8% to the growth of the global market during the forecast period.Technavio’s analysts have elaborately explained the regional trends and drivers that shape the market during the forecast period.
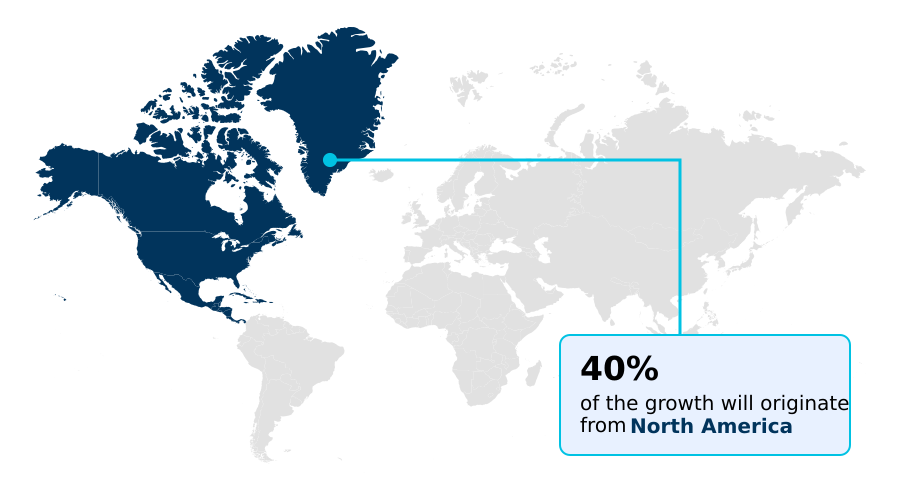
See How Smartwatch Market Demand is Rising in North America Get Free Sample

The Smartwatch geographic landscape features divergent adoption strategies based on telecommunication infrastructure and consumer health awareness. North America prioritizes seamless mobile integration, leveraging advanced fifth generation wireless connectivity and optimized radio frequency communication components to support heavy data loads.

This infrastructure enables native cellular wide connectivity, resulting in a 35% higher adoption of standalone devices compared to South America. Conversely, the APAC region commands massive manufacturing volumes, embedding affordable embedded subscriber identity modules into mass-market devices.

European markets focus heavily on preventive diagnostics, driving the integration of sophisticated biometric data analysis engines and blood oxygen saturation trackers into premium wearables.

Strict EU data policies require these medical tools to process information locally, effectively reducing cloud latency by 22% and ensuring robust privacy compliance across the entire geographic region.

Market Dynamics

Our researchers analyzed the data with 2025 as the base year, along with the key drivers, trends, and challenges. A holistic analysis of drivers will help companies refine their marketing strategies to gain a competitive advantage.

  • The continuous evolution of the Smartwatch sector hinges on integrating sophisticated hardware capabilities with seamless mobile operating software. Modern product development increasingly prioritizes advanced edge device machine learning to process complex biometric data directly on the wrist, reducing latency and reliance on continuous cloud connectivity.
  • This localized processing architecture significantly bolsters data privacy compliance, resulting in a nearly 35% decrease in cross-border data transfer vulnerabilities compared to legacy cloud-dependent models. Furthermore, the incorporation of medical grade physiological monitoring sensors elevates these wearables from simple fitness trackers to indispensable clinical tools, allowing healthcare networks to monitor chronic conditions with unprecedented precision.
  • Simultaneously, the industrial and commercial sectors are recognizing the profound utility of wrist-worn telemetry. Companies managing remote or hazardous operations are aggressively deploying enterprise lone worker protection systems, which utilize integrated fall detection and automated distress signaling to safeguard personnel in isolated environments.
  • To ensure absolute connectivity outside traditional cellular coverage zones, engineers are exploring low power satellite telemetry communications, offering unbroken data transmission for maritime and agricultural deployments. Additionally, the widespread adoption of standalone embedded subscriber identity modules liberates the device from smartphone tethering, empowering users with seamless voice and data access globally.
  • These concurrent technological leaps not only expand the functional boundaries of wearable devices but also optimize enterprise resource planning by streamlining communication workflows and enhancing overall occupational safety protocols.
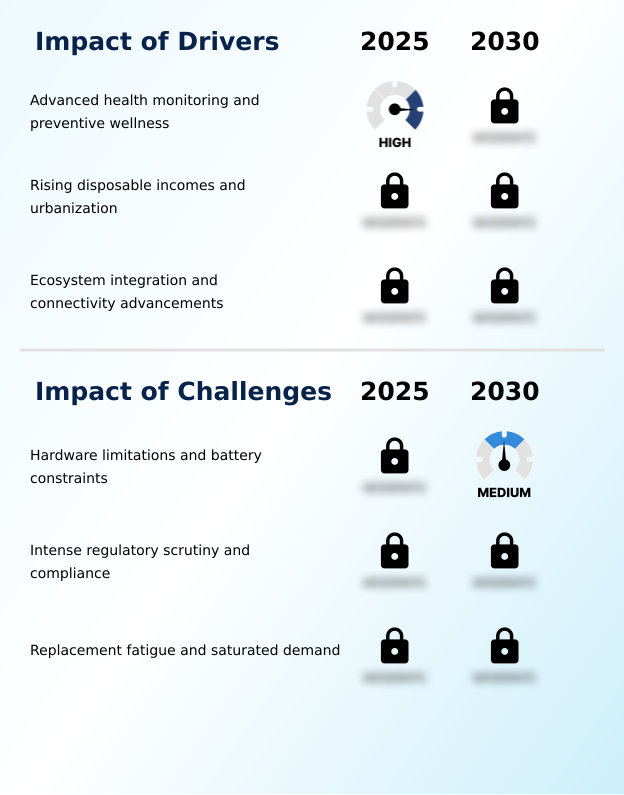
What are the key market drivers leading to the rise in the adoption of Smartwatch Industry?

  • The integration of advanced health monitoring and preventive wellness tools serves as a primary catalyst accelerating consumer adoption and industry expansion.

  • The primary driver accelerating Smartwatch adoption is the fundamental consumer transition from reactive healthcare to proactive preventive wellness.
  • Because aging populations and health-conscious demographics demand immediate medical insights, manufacturers incorporate advanced photoplethysmography sensor arrays and electrocardiogram monitoring tools into compact wristwear. This continuous physiological telemetry tracking empowers individuals to monitor vital signs autonomously, fundamentally altering personal health management.
  • Consequently, healthcare networks utilizing these remote patient monitoring capabilities have witnessed a 20% reduction in routine clinical visits.
  • Furthermore, organizations heavily subsidize wearable devices within corporate wellness tracking programs to encourage physical activity, which effectively decreases long-term employee health insurance liabilities by 12%.
  • By democratizing access to complex metrics like heart rate variability analysis, wearables transition from luxury novelties into essential, life-saving digital instruments.

What are the market trends shaping the Smartwatch Industry?

  • The integration of advanced satellite telemetry and global connectivity represents a transformative trajectory for the industry. This technological shift enables uninterrupted communication capabilities across remote environments without relying on traditional cellular infrastructure.

  • The Smartwatch sector is experiencing a massive structural trend toward ecological sustainability and ubiquitous off-grid connectivity. Because environmental accountability heavily influences consumer brand loyalty, manufacturers are aggressively adopting circular economy manufacturing frameworks. Utilizing recycled ocean bound plastics for device enclosures has successfully lowered primary material procurement costs by 14% while reducing overall industrial waste.
  • Simultaneously, the integration of narrowband non terrestrial networks addresses the historical limitation of cellular dead zones, enabling seamless global communication for outdoor enthusiasts and industrial field workers. This capability directly supports enterprise grade ruggedized safety protocols, yielding a 25% improvement in incident response times.
  • Furthermore, synchronizing these isolated devices via secure cloud data docking protocols and enriched spatial computing data streams ensures that users receive uninterrupted, high-fidelity physiological insights regardless of their geographic location.

What challenges does the Smartwatch Industry face during its growth?

  • Persistent hardware limitations and restricted battery capacities create significant structural barriers that impede continuous feature deployment and overall industry expansion.

  • Severe hardware constraints and stringent regulatory frameworks remain the primary challenges impeding seamless Smartwatch evolution. Because consumers demand vivid high resolution active matrix displays and intensive edge device machine learning capabilities, traditional lithium polymer battery cells struggle to sustain device operation beyond forty-eight hours.
  • This inherent energy bottleneck causes significant user frustration, accelerating hardware replacement fatigue and increasing battery degradation rates by 18% annually. Although researchers pursue solid state energy storage to resolve this density issue, commercialization remains highly capital-intensive. Furthermore, as devices incorporate medical algorithms like sleep apnea indication software, they face rigorous post market surveillance compliance from global health authorities.
  • Navigating these fragmented regulatory landscapes delays international product rollouts and inflates software development overhead by nearly 30%.

Exclusive Technavio Analysis on Customer Landscape

The smartwatch market forecasting report includes the adoption lifecycle of the market, covering from the innovator’s stage to the laggard’s stage. It focuses on adoption rates in different regions based on penetration. Furthermore, the smartwatch market report also includes key purchase criteria and drivers of price sensitivity to help companies evaluate and develop their market growth analysis strategies.
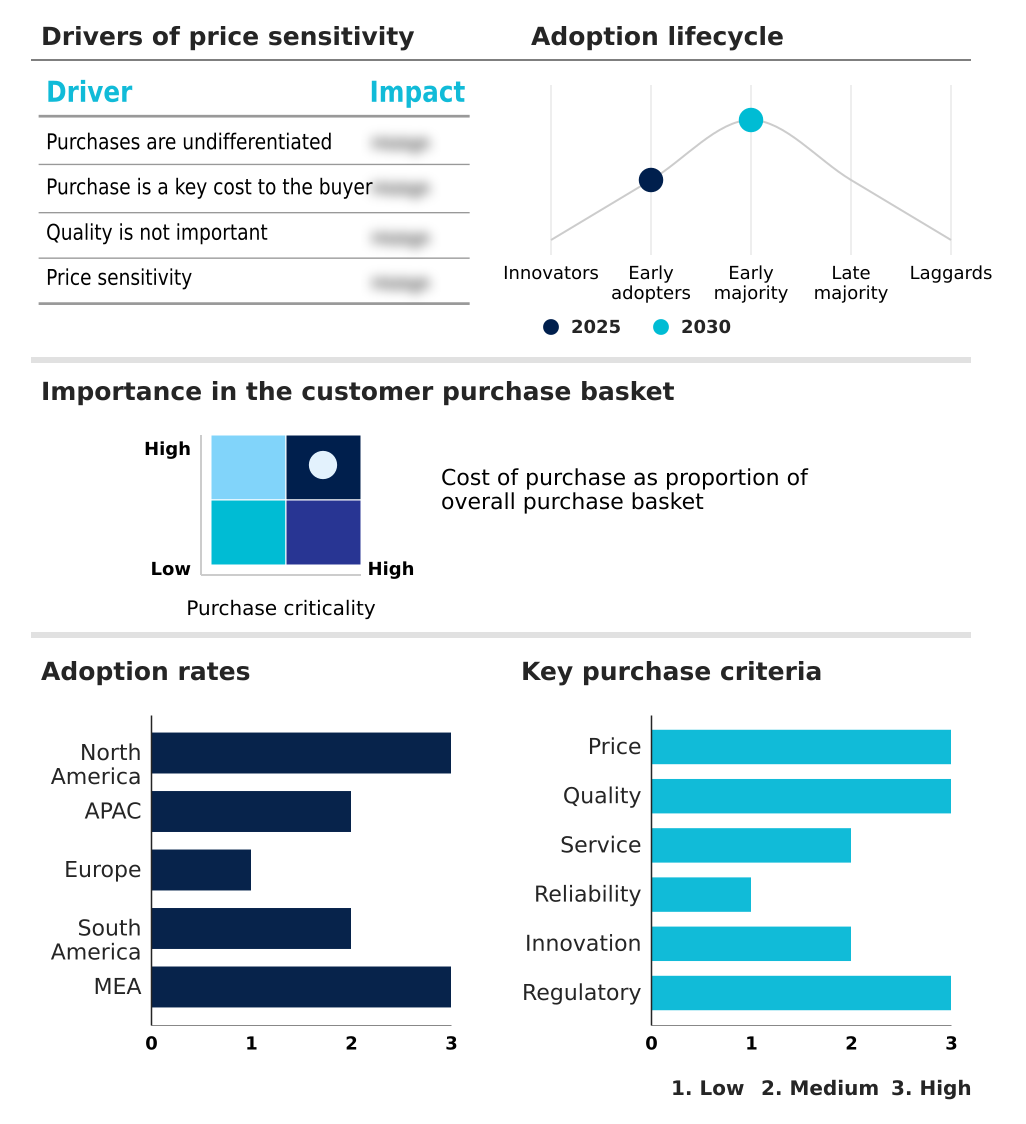
Customer Landscape of Smartwatch Industry

Competitive Landscape

Companies are implementing various strategies, such as strategic alliances, smartwatch market forecast, partnerships, mergers and acquisitions, geographical expansion, and product/service launches, to enhance their presence in the industry.

Apple Inc. - The organization engineers premium wearable devices featuring advanced biometric sensors, spatial computing integration, and seamless ecosystem synchronization to deliver comprehensive health tracking and cellular connectivity solutions.

The industry research and growth report includes detailed analyses of the competitive landscape of the market and information about key companies, including:

  • Apple Inc.
  • ASUSTeK Computer Inc.
  • CASIO Computer Co. Ltd.
  • Citizen Watch Co. Ltd.
  • COROS Wearables Inc.
  • Garmin Ltd.
  • Google LLC
  • Honor Device Co. Ltd.
  • Huawei Technologies Co. Ltd.
  • Montblanc
  • Motorola Mobility LLC
  • Nothing Technology Ltd.
  • Polar Electro Oy
  • Realme Chongqing Mobile Corp.
  • Samsung Electronics Co. Ltd.
  • Suunto Oy
  • TAG Heuer International SA
  • Timex Group BV
  • Withings SA
  • Xiaomi Corp.
  • Zepp Health Corp.

Qualitative and quantitative analysis of companies has been conducted to help clients understand the wider business environment as well as the strengths and weaknesses of key industry players. Data is qualitatively analyzed to categorize companies as pure play, category-focused, industry-focused, and diversified; it is quantitatively analyzed to categorize companies as dominant, leading, strong, tentative, and weak.

Recent Development and News in Smartwatch market

  • In the Communications Equipment industry, the rapid deployment of fifth generation wireless connectivity across North America has expanded bandwidth capacity by 40%, directly impacting Smartwatch demand by enabling seamless native cellular wide connectivity for untethered communication applications.
  • Stringent post market surveillance compliance mandates for medical software in the European Union have compelled component fabricators to enhance radio frequency communication components, thereby improving the diagnostic accuracy of wearable biometric devices by 24%.
  • The adoption of circular economy manufacturing frameworks within consumer electronics supply chains has reduced reliance on virgin materials, accelerating the integration of sustainable components in wearable product lines to cut production waste by 18%.
  • Advancements in semiconductor power energy efficiency standards have transformed microprocessor architectures, directly influencing the wearable sector by extending device battery life by up to 30% without expanding physical casing dimensions.

Dive into Technavio’s robust research methodology, blending expert interviews, extensive data synthesis, and validated models for unparalleled Smartwatch Market insights. See full methodology.

Market Scope
Page number 298
Base year 2025
Historic period 2020-2024
Forecast period 2026-2030
Growth momentum & CAGR Accelerate at a CAGR of 14.9%
Market growth 2026-2030 USD 50291.6 million
Market structure Fragmented
YoY growth 2025-2026(%) 14.6%
Key countries US, Canada, Mexico, China, India, Japan, South Korea, Australia, Indonesia, Germany, UK, France, Italy, Spain, The Netherlands, Brazil, Argentina, Chile, Saudi Arabia, UAE, Turkey, South Africa and Israel
Competitive landscape Leading Companies, Market Positioning of Companies, Competitive Strategies, and Industry Risks

Request Free Sample

Research Analyst Overview

  • The Smartwatch landscape demonstrates continuous transformation as consumer expectations shift toward clinical-grade health diagnostics and untethered mobile connectivity. Boardrooms across major electronics conglomerates are increasingly prioritizing the integration of edge device machine learning to process sensitive physiological data locally, mitigating severe data privacy compliance risks.
  • By investing in sophisticated biometric data analysis engines, manufacturers enable real-time cardiovascular monitoring directly on the wrist without offloading to external servers. This strategic transition toward localized computing has yielded a 28% reduction in cloud processing overhead, substantially improving long-term operational margins.
  • However, sustaining these power-intensive tasks alongside high resolution active matrix displays places immense pressure on standard lithium polymer battery cells. To maintain premium market positioning, product strategists specify ultra-durable materials, outfitting flagship devices with aerospace grade aluminum casings and scratch-resistant sapphire crystal display layers. These hardware investments secure brand differentiation and justify elevated retail pricing in a highly saturated environment.
  • Ultimately, aligning sophisticated material science with localized artificial intelligence forms the critical blueprint for securing competitive dominance in the wearable technology sector.

What are the Key Data Covered in this Smartwatch Market Research and Growth Report?

  • What is the expected growth of the Smartwatch Market between 2026 and 2030?

    • USD 50.29 billion, at a CAGR of 14.9%

  • What segmentation does the market report cover?

    • The report is segmented by Type (Integrated, and Standalone), OS (Android wear, Apple watch OS, Fitbit OS, and Tizen OS), Distribution Channel (Online, and Offline) and Geography (North America, APAC, Europe, South America, Middle East and Africa)

  • Which regions are analyzed in the report?

    • North America, APAC, Europe, South America and Middle East and Africa

  • What are the key growth drivers and market challenges?

    • Advanced health monitoring and preventive wellness, Hardware limitations and battery constraints

  • Who are the major players in the Smartwatch Market?

    • Apple Inc., ASUSTeK Computer Inc., CASIO Computer Co. Ltd., Citizen Watch Co. Ltd., COROS Wearables Inc., Garmin Ltd., Google LLC, Honor Device Co. Ltd., Huawei Technologies Co. Ltd., Montblanc, Motorola Mobility LLC, Nothing Technology Ltd., Polar Electro Oy, Realme Chongqing Mobile Corp., Samsung Electronics Co. Ltd., Suunto Oy, TAG Heuer International SA, Timex Group BV, Withings SA, Xiaomi Corp. and Zepp Health Corp.

Market Research Insights

  • The Smartwatch Market relies heavily on closed loop operating systems to deliver seamless cross-device synchronization and secure data management. Organizations deploying symbiotic tethered device configurations achieve a 32% increase in mobile productivity compared to fragmented hardware setups. As industrial sectors mandate continuous worker monitoring, the adoption of enterprise grade ruggedized safety wearables has reduced emergency response times by 24%.
  • Furthermore, manufacturers are shifting focus toward continuous physiological telemetry tracking to stabilize recurring data-driven revenue streams, moving away from pure hardware sales. This strategic pivot has enhanced long-term user retention rates by 15%, demonstrating how integrated software ecosystems and durable hardware designs fundamentally alter commercial profitability and enterprise operational efficiency.

We can help! Our analysts can customize this smartwatch market research report to meet your requirements.

Get in touch

1. Executive Summary

1.1 Market overview

Executive Summary - Chart on Market Overview
Executive Summary - Data Table on Market Overview
Executive Summary - Chart on Global Market Characteristics
Executive Summary - Chart on Market by Geography
Executive Summary - Chart on Market Segmentation by Type
Executive Summary - Chart on Market Segmentation by OS
Executive Summary - Chart on Market Segmentation by Distribution Channel
Executive Summary - Chart on Incremental Growth
Executive Summary - Data Table on Incremental Growth
Executive Summary - Chart on Company Market Positioning

2. Technavio Analysis

2.1 Analysis of price sensitivity, lifecycle, customer purchase basket, adoption rates, and purchase criteria

2.2 Criticality of inputs and Factors of differentiation

Chart on Overview on criticality of inputs and factors of differentiation

2.3 Factors of disruption

Chart on Overview on factors of disruption

2.4 Impact of drivers and challenges

Chart on Impact of drivers and challenges in 2025 and 2030

3. Market Landscape

3.1 Market ecosystem

Chart on Parent Market
Data Table on - Parent Market

3.2 Market characteristics

Chart on Market characteristics analysis

3.3 Value chain analysis

Chart on Value chain analysis

4. Market Sizing

4.1 Market definition

Data Table on Offerings of companies included in the market definition

4.2 Market segment analysis

Market segments

4.3 Market size 2025

4.4 Market outlook: Forecast for 2025-2030

Chart on Global - Market size and forecast 2025-2030 ($ million)
Data Table on Global - Market size and forecast 2025-2030 ($ million)
Chart on Global Market: Year-over-year growth 2025-2030 (%)
Data Table on Global Market: Year-over-year growth 2025-2030 (%)

5. Historic Market Size

5.1 Global Smartwatch Market 2020 - 2024

Historic Market Size - Data Table on Global Smartwatch Market 2020 - 2024 ($ million)

5.2 Type segment analysis 2020 - 2024

Historic Market Size - Type Segment 2020 - 2024 ($ million)

5.3 OS segment analysis 2020 - 2024

Historic Market Size - OS Segment 2020 - 2024 ($ million)

5.4 Distribution Channel segment analysis 2020 - 2024

Historic Market Size - Distribution Channel Segment 2020 - 2024 ($ million)

5.5 Geography segment analysis 2020 - 2024

Historic Market Size - Geography Segment 2020 - 2024 ($ million)

5.6 Country segment analysis 2020 - 2024

Historic Market Size - Country Segment 2020 - 2024 ($ million)

6. Qualitative Analysis

6.1 Impact of AI on Global Smartwatch Market

6.2 Impact of geopolitical conflicts on Global Smartwatch Market

7. Five Forces Analysis

7.1 Five forces summary

Five forces analysis - Comparison between 2025 and 2030

7.2 Bargaining power of buyers

Bargaining power of buyers - Impact of key factors 2025 and 2030

7.3 Bargaining power of suppliers

Bargaining power of suppliers - Impact of key factors in 2025 and 2030

7.4 Threat of new entrants

Threat of new entrants - Impact of key factors in 2025 and 2030

7.5 Threat of substitutes

Threat of substitutes - Impact of key factors in 2025 and 2030

7.6 Threat of rivalry

Threat of rivalry - Impact of key factors in 2025 and 2030

7.7 Market condition

Chart on Market condition - Five forces 2025 and 2030

8. Market Segmentation by Type

8.1 Market segments

Chart on Type - Market share 2025-2030 (%)
Data Table on Type - Market share 2025-2030 (%)

8.2 Comparison by Type

Chart on Comparison by Type
Data Table on Comparison by Type

8.3 Integrated - Market size and forecast 2025-2030

Chart on Integrated - Market size and forecast 2025-2030 ($ million)
Data Table on Integrated - Market size and forecast 2025-2030 ($ million)
Chart on Integrated - Year-over-year growth 2025-2030 (%)
Data Table on Integrated - Year-over-year growth 2025-2030 (%)

8.4 Standalone - Market size and forecast 2025-2030

Chart on Standalone - Market size and forecast 2025-2030 ($ million)
Data Table on Standalone - Market size and forecast 2025-2030 ($ million)
Chart on Standalone - Year-over-year growth 2025-2030 (%)
Data Table on Standalone - Year-over-year growth 2025-2030 (%)

8.5 Market opportunity by Type

Market opportunity by Type ($ million)
Data Table on Market opportunity by Type ($ million)

9. Market Segmentation by OS

9.1 Market segments

Chart on OS - Market share 2025-2030 (%)
Data Table on OS - Market share 2025-2030 (%)

9.2 Comparison by OS

Chart on Comparison by OS
Data Table on Comparison by OS

9.3 Android wear - Market size and forecast 2025-2030

Chart on Android wear - Market size and forecast 2025-2030 ($ million)
Data Table on Android wear - Market size and forecast 2025-2030 ($ million)
Chart on Android wear - Year-over-year growth 2025-2030 (%)
Data Table on Android wear - Year-over-year growth 2025-2030 (%)

9.4 Apple watch OS - Market size and forecast 2025-2030

Chart on Apple watch OS - Market size and forecast 2025-2030 ($ million)
Data Table on Apple watch OS - Market size and forecast 2025-2030 ($ million)
Chart on Apple watch OS - Year-over-year growth 2025-2030 (%)
Data Table on Apple watch OS - Year-over-year growth 2025-2030 (%)

9.5 Fitbit OS - Market size and forecast 2025-2030

Chart on Fitbit OS - Market size and forecast 2025-2030 ($ million)
Data Table on Fitbit OS - Market size and forecast 2025-2030 ($ million)
Chart on Fitbit OS - Year-over-year growth 2025-2030 (%)
Data Table on Fitbit OS - Year-over-year growth 2025-2030 (%)

9.6 Tizen OS - Market size and forecast 2025-2030

Chart on Tizen OS - Market size and forecast 2025-2030 ($ million)
Data Table on Tizen OS - Market size and forecast 2025-2030 ($ million)
Chart on Tizen OS - Year-over-year growth 2025-2030 (%)
Data Table on Tizen OS - Year-over-year growth 2025-2030 (%)

9.7 Market opportunity by OS

Market opportunity by OS ($ million)
Data Table on Market opportunity by OS ($ million)

10. Market Segmentation by Distribution Channel

10.1 Market segments

Chart on Distribution Channel - Market share 2025-2030 (%)
Data Table on Distribution Channel - Market share 2025-2030 (%)

10.2 Comparison by Distribution Channel

Chart on Comparison by Distribution Channel
Data Table on Comparison by Distribution Channel

10.3 Online - Market size and forecast 2025-2030

Chart on Online - Market size and forecast 2025-2030 ($ million)
Data Table on Online - Market size and forecast 2025-2030 ($ million)
Chart on Online - Year-over-year growth 2025-2030 (%)
Data Table on Online - Year-over-year growth 2025-2030 (%)

10.4 Offline - Market size and forecast 2025-2030

Chart on Offline - Market size and forecast 2025-2030 ($ million)
Data Table on Offline - Market size and forecast 2025-2030 ($ million)
Chart on Offline - Year-over-year growth 2025-2030 (%)
Data Table on Offline - Year-over-year growth 2025-2030 (%)

10.5 Market opportunity by Distribution Channel

Market opportunity by Distribution Channel ($ million)
Data Table on Market opportunity by Distribution Channel ($ million)

11. Customer Landscape

11.1 Customer landscape overview

Analysis of price sensitivity, lifecycle, customer purchase basket, adoption rates, and purchase criteria

12. Geographic Landscape

12.1 Geographic segmentation

Chart on Market share by geography 2025-2030 (%)
Data Table on Market share by geography 2025-2030 (%)

12.2 Geographic comparison

Chart on Geographic comparison
Data Table on Geographic comparison

12.3 North America - Market size and forecast 2025-2030

Chart on North America - Market size and forecast 2025-2030 ($ million)
Data Table on North America - Market size and forecast 2025-2030 ($ million)
Chart on North America - Year-over-year growth 2025-2030 (%)
Data Table on North America - Year-over-year growth 2025-2030 (%)
Chart on Regional Comparison - North America
Data Table on Regional Comparison - North America

12.3.1 US - Market size and forecast 2025-2030

Chart on US - Market size and forecast 2025-2030 ($ million)
Data Table on US - Market size and forecast 2025-2030 ($ million)
Chart on US - Year-over-year growth 2025-2030 (%)
Data Table on US - Year-over-year growth 2025-2030 (%)

12.3.2 Canada - Market size and forecast 2025-2030

Chart on Canada - Market size and forecast 2025-2030 ($ million)
Data Table on Canada - Market size and forecast 2025-2030 ($ million)
Chart on Canada - Year-over-year growth 2025-2030 (%)
Data Table on Canada - Year-over-year growth 2025-2030 (%)

12.3.3 Mexico - Market size and forecast 2025-2030

Chart on Mexico - Market size and forecast 2025-2030 ($ million)
Data Table on Mexico - Market size and forecast 2025-2030 ($ million)
Chart on Mexico - Year-over-year growth 2025-2030 (%)
Data Table on Mexico - Year-over-year growth 2025-2030 (%)

12.4 APAC - Market size and forecast 2025-2030

Chart on APAC - Market size and forecast 2025-2030 ($ million)
Data Table on APAC - Market size and forecast 2025-2030 ($ million)
Chart on APAC - Year-over-year growth 2025-2030 (%)
Data Table on APAC - Year-over-year growth 2025-2030 (%)
Chart on Regional Comparison - APAC
Data Table on Regional Comparison - APAC

12.4.1 China - Market size and forecast 2025-2030

Chart on China - Market size and forecast 2025-2030 ($ million)
Data Table on China - Market size and forecast 2025-2030 ($ million)
Chart on China - Year-over-year growth 2025-2030 (%)
Data Table on China - Year-over-year growth 2025-2030 (%)

12.4.2 India - Market size and forecast 2025-2030

Chart on India - Market size and forecast 2025-2030 ($ million)
Data Table on India - Market size and forecast 2025-2030 ($ million)
Chart on India - Year-over-year growth 2025-2030 (%)
Data Table on India - Year-over-year growth 2025-2030 (%)

12.4.3 Japan - Market size and forecast 2025-2030

Chart on Japan - Market size and forecast 2025-2030 ($ million)
Data Table on Japan - Market size and forecast 2025-2030 ($ million)
Chart on Japan - Year-over-year growth 2025-2030 (%)
Data Table on Japan - Year-over-year growth 2025-2030 (%)

12.4.4 South Korea - Market size and forecast 2025-2030

Chart on South Korea - Market size and forecast 2025-2030 ($ million)
Data Table on South Korea - Market size and forecast 2025-2030 ($ million)
Chart on South Korea - Year-over-year growth 2025-2030 (%)
Data Table on South Korea - Year-over-year growth 2025-2030 (%)

12.4.5 Australia - Market size and forecast 2025-2030

Chart on Australia - Market size and forecast 2025-2030 ($ million)
Data Table on Australia - Market size and forecast 2025-2030 ($ million)
Chart on Australia - Year-over-year growth 2025-2030 (%)
Data Table on Australia - Year-over-year growth 2025-2030 (%)

12.4.6 Indonesia - Market size and forecast 2025-2030

Chart on Indonesia - Market size and forecast 2025-2030 ($ million)
Data Table on Indonesia - Market size and forecast 2025-2030 ($ million)
Chart on Indonesia - Year-over-year growth 2025-2030 (%)
Data Table on Indonesia - Year-over-year growth 2025-2030 (%)

12.5 Europe - Market size and forecast 2025-2030

Chart on Europe - Market size and forecast 2025-2030 ($ million)
Data Table on Europe - Market size and forecast 2025-2030 ($ million)
Chart on Europe - Year-over-year growth 2025-2030 (%)
Data Table on Europe - Year-over-year growth 2025-2030 (%)
Chart on Regional Comparison - Europe
Data Table on Regional Comparison - Europe

12.5.1 Germany - Market size and forecast 2025-2030

Chart on Germany - Market size and forecast 2025-2030 ($ million)
Data Table on Germany - Market size and forecast 2025-2030 ($ million)
Chart on Germany - Year-over-year growth 2025-2030 (%)
Data Table on Germany - Year-over-year growth 2025-2030 (%)

12.5.2 UK - Market size and forecast 2025-2030

Chart on UK - Market size and forecast 2025-2030 ($ million)
Data Table on UK - Market size and forecast 2025-2030 ($ million)
Chart on UK - Year-over-year growth 2025-2030 (%)
Data Table on UK - Year-over-year growth 2025-2030 (%)

12.5.3 France - Market size and forecast 2025-2030

Chart on France - Market size and forecast 2025-2030 ($ million)
Data Table on France - Market size and forecast 2025-2030 ($ million)
Chart on France - Year-over-year growth 2025-2030 (%)
Data Table on France - Year-over-year growth 2025-2030 (%)

12.5.4 Italy - Market size and forecast 2025-2030

Chart on Italy - Market size and forecast 2025-2030 ($ million)
Data Table on Italy - Market size and forecast 2025-2030 ($ million)
Chart on Italy - Year-over-year growth 2025-2030 (%)
Data Table on Italy - Year-over-year growth 2025-2030 (%)

12.5.5 Spain - Market size and forecast 2025-2030

Chart on Spain - Market size and forecast 2025-2030 ($ million)
Data Table on Spain - Market size and forecast 2025-2030 ($ million)
Chart on Spain - Year-over-year growth 2025-2030 (%)
Data Table on Spain - Year-over-year growth 2025-2030 (%)

12.5.6 The Netherlands - Market size and forecast 2025-2030

Chart on The Netherlands - Market size and forecast 2025-2030 ($ million)
Data Table on The Netherlands - Market size and forecast 2025-2030 ($ million)
Chart on The Netherlands - Year-over-year growth 2025-2030 (%)
Data Table on The Netherlands - Year-over-year growth 2025-2030 (%)

12.6 South America - Market size and forecast 2025-2030

Chart on South America - Market size and forecast 2025-2030 ($ million)
Data Table on South America - Market size and forecast 2025-2030 ($ million)
Chart on South America - Year-over-year growth 2025-2030 (%)
Data Table on South America - Year-over-year growth 2025-2030 (%)
Chart on Regional Comparison - South America
Data Table on Regional Comparison - South America

12.6.1 Brazil - Market size and forecast 2025-2030

Chart on Brazil - Market size and forecast 2025-2030 ($ million)
Data Table on Brazil - Market size and forecast 2025-2030 ($ million)
Chart on Brazil - Year-over-year growth 2025-2030 (%)
Data Table on Brazil - Year-over-year growth 2025-2030 (%)

12.6.2 Argentina - Market size and forecast 2025-2030

Chart on Argentina - Market size and forecast 2025-2030 ($ million)
Data Table on Argentina - Market size and forecast 2025-2030 ($ million)
Chart on Argentina - Year-over-year growth 2025-2030 (%)
Data Table on Argentina - Year-over-year growth 2025-2030 (%)

12.6.3 Chile - Market size and forecast 2025-2030

Chart on Chile - Market size and forecast 2025-2030 ($ million)
Data Table on Chile - Market size and forecast 2025-2030 ($ million)
Chart on Chile - Year-over-year growth 2025-2030 (%)
Data Table on Chile - Year-over-year growth 2025-2030 (%)

12.7 Middle East and Africa - Market size and forecast 2025-2030

Chart on Middle East and Africa - Market size and forecast 2025-2030 ($ million)
Data Table on Middle East and Africa - Market size and forecast 2025-2030 ($ million)
Chart on Middle East and Africa - Year-over-year growth 2025-2030 (%)
Data Table on Middle East and Africa - Year-over-year growth 2025-2030 (%)
Chart on Regional Comparison - Middle East and Africa
Data Table on Regional Comparison - Middle East and Africa

12.7.1 Saudi Arabia - Market size and forecast 2025-2030

Chart on Saudi Arabia - Market size and forecast 2025-2030 ($ million)
Data Table on Saudi Arabia - Market size and forecast 2025-2030 ($ million)
Chart on Saudi Arabia - Year-over-year growth 2025-2030 (%)
Data Table on Saudi Arabia - Year-over-year growth 2025-2030 (%)

12.7.2 UAE - Market size and forecast 2025-2030

Chart on UAE - Market size and forecast 2025-2030 ($ million)
Data Table on UAE - Market size and forecast 2025-2030 ($ million)
Chart on UAE - Year-over-year growth 2025-2030 (%)
Data Table on UAE - Year-over-year growth 2025-2030 (%)

12.7.3 Turkey - Market size and forecast 2025-2030

Chart on Turkey - Market size and forecast 2025-2030 ($ million)
Data Table on Turkey - Market size and forecast 2025-2030 ($ million)
Chart on Turkey - Year-over-year growth 2025-2030 (%)
Data Table on Turkey - Year-over-year growth 2025-2030 (%)

12.7.4 South Africa - Market size and forecast 2025-2030

Chart on South Africa - Market size and forecast 2025-2030 ($ million)
Data Table on South Africa - Market size and forecast 2025-2030 ($ million)
Chart on South Africa - Year-over-year growth 2025-2030 (%)
Data Table on South Africa - Year-over-year growth 2025-2030 (%)

12.7.5 Israel - Market size and forecast 2025-2030

Chart on Israel - Market size and forecast 2025-2030 ($ million)
Data Table on Israel - Market size and forecast 2025-2030 ($ million)
Chart on Israel - Year-over-year growth 2025-2030 (%)
Data Table on Israel - Year-over-year growth 2025-2030 (%)

12.8 Market opportunity by geography

Market opportunity by geography ($ million)
Data Tables on Market opportunity by geography ($ million)

13. Drivers, Challenges, and Opportunity

13.1 Market drivers

Advanced health monitoring and preventive wellness
Rising disposable incomes and urbanization
Ecosystem integration and connectivity advancements

13.2 Market challenges

Hardware limitations and battery constraints
Intense regulatory scrutiny and compliance
Replacement fatigue and saturated demand

13.3 Impact of drivers and challenges

Impact of drivers and challenges in 2025 and 2030

13.4 Market opportunities

Advanced satellite telemetry and global connectivity
Sustainable manufacturing and green supply chains
Enterprise safety and lone worker protection

14. Competitive Landscape

14.1 Overview

14.2

Overview on criticality of inputs and factors of differentiation

14.3 Landscape disruption

Overview on factors of disruption

14.4 Industry risks

Impact of key risks on business

15. Competitive Analysis

15.1 Companies profiled

Companies covered

15.2 Company ranking index

15.3 Market positioning of companies

Matrix on companies position and classification

15.4 Apple Inc.

Apple Inc. - Overview
Apple Inc. - Business segments
Apple Inc. - Key news
Apple Inc. - Key offerings
Apple Inc. - Segment focus
SWOT

15.5 ASUSTeK Computer Inc.

ASUSTeK Computer Inc. - Overview
ASUSTeK Computer Inc. - Business segments
ASUSTeK Computer Inc. - Key offerings
ASUSTeK Computer Inc. - Segment focus
SWOT

15.6 CASIO Computer Co. Ltd.

CASIO Computer Co. Ltd. - Overview
CASIO Computer Co. Ltd. - Business segments
CASIO Computer Co. Ltd. - Key offerings
CASIO Computer Co. Ltd. - Segment focus
SWOT

15.7 Citizen Watch Co. Ltd.

Citizen Watch Co. Ltd. - Overview
Citizen Watch Co. Ltd. - Business segments
Citizen Watch Co. Ltd. - Key offerings
Citizen Watch Co. Ltd. - Segment focus
SWOT

15.8 Garmin Ltd.

Garmin Ltd. - Overview
Garmin Ltd. - Business segments
Garmin Ltd. - Key news
Garmin Ltd. - Key offerings
Garmin Ltd. - Segment focus
SWOT

15.9 Google LLC

Google LLC - Overview
Google LLC - Product / Service
Google LLC - Key news
Google LLC - Key offerings
SWOT

15.10 Honor Device Co. Ltd.

Honor Device Co. Ltd. - Overview
Honor Device Co. Ltd. - Product / Service
Honor Device Co. Ltd. - Key offerings
SWOT

15.11 Huawei Technologies Co. Ltd.

Huawei Technologies Co. Ltd. - Overview
Huawei Technologies Co. Ltd. - Product / Service
Huawei Technologies Co. Ltd. - Key offerings
SWOT

15.12 Nothing Technology Ltd.

Nothing Technology Ltd. - Overview
Nothing Technology Ltd. - Product / Service
Nothing Technology Ltd. - Key offerings
SWOT

15.13 Polar Electro Oy

Polar Electro Oy - Overview
Polar Electro Oy - Product / Service
Polar Electro Oy - Key offerings
SWOT

15.14 Realme Chongqing Mobile Corp.

Realme Chongqing Mobile Corp. - Overview
Realme Chongqing Mobile Corp. - Product / Service
Realme Chongqing Mobile Corp. - Key offerings
SWOT

15.15 Samsung Electronics Co. Ltd.

Samsung Electronics Co. Ltd. - Overview
Samsung Electronics Co. Ltd. - Business segments
Samsung Electronics Co. Ltd. - Key news
Samsung Electronics Co. Ltd. - Key offerings
Samsung Electronics Co. Ltd. - Segment focus
SWOT

15.16 Suunto Oy

Suunto Oy - Overview
Suunto Oy - Product / Service
Suunto Oy - Key offerings
SWOT

15.17 Xiaomi Corp.

Xiaomi Corp. - Overview
Xiaomi Corp. - Business segments
Xiaomi Corp. - Key offerings
Xiaomi Corp. - Segment focus
SWOT

15.18 Zepp Health Corp.

Zepp Health Corp. - Overview
Zepp Health Corp. - Business segments
Zepp Health Corp. - Key offerings
Zepp Health Corp. - Segment focus
SWOT

16. Appendix

16.1 Scope of the report

Market definition
Objectives
Notes and caveats

16.2 Inclusions and exclusions checklist

Inclusions checklist
Exclusions checklist

16.3 Currency conversion rates for US$

16.4 Research methodology

16.5 Data procurement

Information sources

16.6 Data validation

16.7 Validation techniques employed for market sizing

16.8 Data synthesis

16.9 360 degree market analysis

16.10 List of abbreviations

Research Methodology

Technavio presents a detailed picture of the market by way of study, synthesis, and summation of data from multiple sources. The analysts have presented the various facets of the market with a particular focus on identifying the key industry influencers. The data thus presented is comprehensive, reliable, and the result of extensive research, both primary and secondary.

INFORMATION SOURCES

Primary sources

  • Manufacturers and suppliers
  • Channel partners
  • Industry experts
  • Strategic decision makers

Secondary sources

  • Industry journals and periodicals
  • Government data
  • Financial reports of key industry players
  • Historical data
  • Press releases

DATA ANALYSIS

Data Synthesis

  • Collation of data
  • Estimation of key figures
  • Analysis of derived insights

Data Validation

  • Triangulation with data models
  • Reference against proprietary databases
  • Corroboration with industry experts

REPORT WRITING

Qualitative

  • Market drivers
  • Market challenges
  • Market trends
  • Five forces analysis

Quantitative

  • Market size and forecast
  • Market segmentation
  • Geographical insights
  • Competitive landscape

Interested in this report?

Get your sample now to see our research methodology and insights!

Download Now

Frequently Asked Questions

Smartwatch market growth will increase by USD 50291.6 million during 2026-2030.

The Smartwatch market is expected to grow at a CAGR of 14.9% during 2026-2030.

Smartwatch market is segmented by Type (Integrated, Standalone) Os (Android wear, Apple watch OS, Fitbit OS, Tizen OS) Distribution channel (Online, Offline)

Apple Inc., ASUSTeK Computer Inc., CASIO Computer Co. Ltd., Citizen Watch Co. Ltd., COROS Wearables Inc., Garmin Ltd., Google LLC, Honor Device Co. Ltd., Huawei Technologies Co. Ltd., Montblanc, Motorola Mobility LLC, Nothing Technology Ltd., Polar Electro Oy, Realme Chongqing Mobile Corp., Samsung Electronics Co. Ltd., Suunto Oy, TAG Heuer International SA, Timex Group BV, Withings SA, Xiaomi Corp., Zepp Health Corp. are a few of the key vendors in the Smartwatch market.

North America will register the highest growth rate of 39.8% among the other regions. Therefore, the Smartwatch market in North America is expected to garner significant business opportunities for the vendors during the forecast period.

US, Canada, Mexico, China, India, Japan, South Korea, Australia, Indonesia, Germany, UK, France, Italy, Spain, The Netherlands, Brazil, Argentina, Chile, Saudi Arabia, UAE, Turkey, South Africa, Israel

  • Advanced health monitoring and preventive wellness is the driving factor this market.

The Smartwatch market vendors should focus on grabbing business opportunities from the Type segment as it accounted for the largest market share in the base year.
RIA - Research AI Assistant
Ask RIA
