Sneakers Market Analysis APAC, North America, Europe, South America, Middle East and Africa - US, China, UK, Germany, Canada, France, India, Japan, Brazil, Australia - Size and Forecast 2025-2029

Sneakers Market Analysis APAC, North America, Europe, South America, Middle East and Africa - US, China, UK, Germany, Canada, France, India, Japan, Brazil, Australia - Size and Forecast 2025-2029

Published: Feb 2025 204 Pages SKU: IRTNTR75584

Market Overview at a Glance

$34.06 B
Market Opportunity
6.9%
CAGR
6.5
YoY growth 2024-2025(%)

Sneakers Market Size 2025-2029

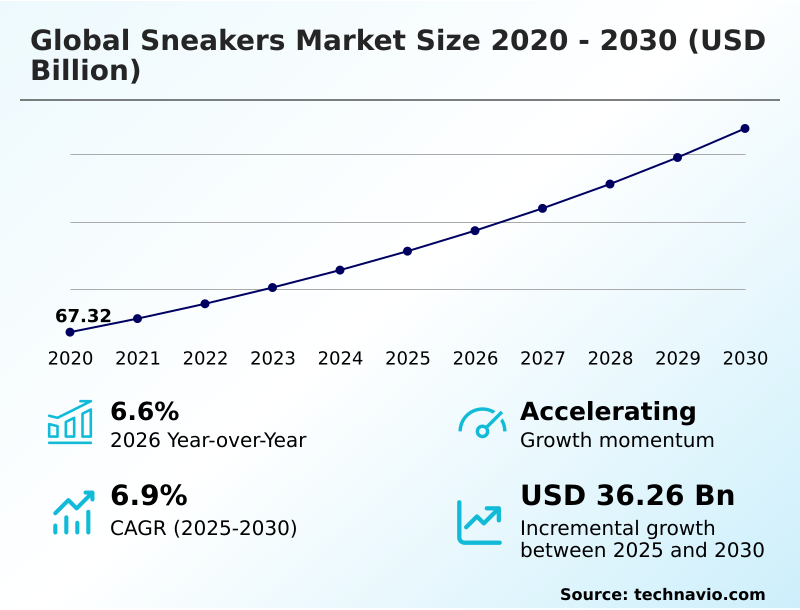
The sneakers market size is valued to increase USD 34.06 billion, at a CAGR of 6.9% from 2024 to 2029. Increasing premiumization due to introduction of more innovative sneakers will drive the sneakers market.

Major Market Trends & Insights

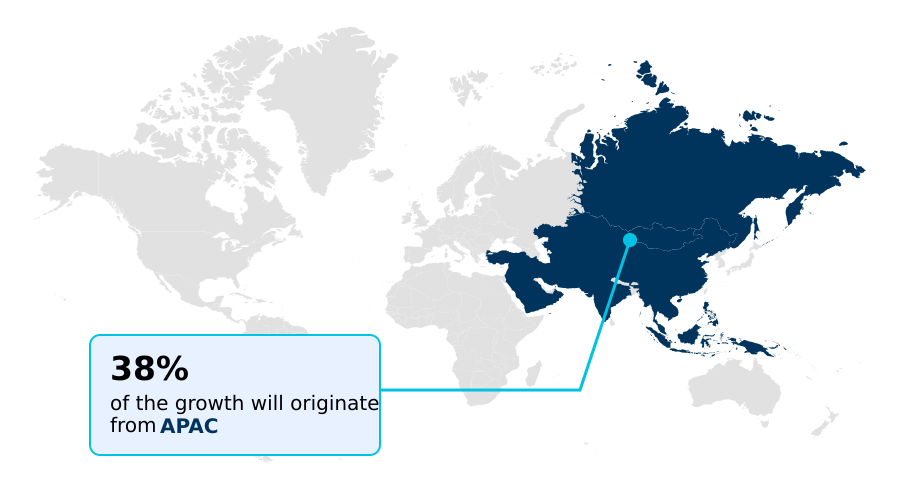
  • APAC dominated the market and accounted for a 36% growth during the forecast period.
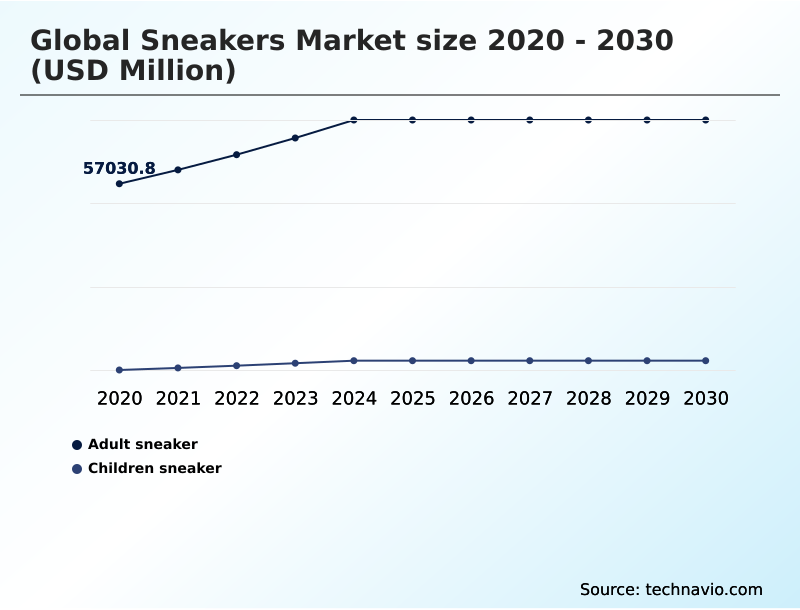
  • By Product - Adult sneaker segment was valued at USD 59.17 billion in 2023
  • By Distribution Channel - Offline segment accounted for the largest market revenue share in 2023

Market Size & Forecast

  • Market Opportunities: USD 71.10 billion
  • Market Future Opportunities: USD 34057.00 billion
  • CAGR from 2024 to 2029 : 6.9%

Market Summary

  • The market, a significant segment of the global footwear industry, experienced remarkable growth in recent years, reaching a value of USD 125 billion in 2021. This expansion is driven by the increasing premiumization trend, as consumers seek out more innovative and high-performance sneakers. Sustainability is another key factor, with manufacturers incorporating eco-friendly materials into their production processes to cater to the growing demand for environmentally conscious products. However, the market's growth is not without challenges. The volatile cost of raw materials, such as rubber and synthetic fabrics, poses a significant threat to profitability.
  • To mitigate these risks, market players are exploring alternative materials and supply chain strategies. Despite these hurdles, the future of the market remains bright, with continued innovation and consumer demand fueling its growth.

What will be the Size of the Sneakers Market during the forecast period?

Sneakers Market Size

Get Key Insights on Market Forecast (PDF) Request Free Sample

How is the Sneakers Market Segmented ?

The sneakers industry research report provides comprehensive data (region-wise segment analysis), with forecasts and estimates in "USD billion" for the period 2025-2029, as well as historical data from 2019-2023 for the following segments.

  • Product
    • Adult sneaker
    • Children sneaker
  • Distribution Channel
    • Offline
    • Online
  • Product Type
    • Low-top sneakers
    • High-top sneakers
    • Mid-top sneakers
  • Geography
    • North America
      • US
      • Canada
    • Europe
      • France
      • Germany
      • UK
    • APAC
      • Australia
      • China
      • India
      • Japan
    • South America
      • Brazil
    • Rest of World (ROW)

By Product Insights

The adult sneaker segment is estimated to witness significant growth during the forecast period.

The market, with a significant focus on the adult segment, continues to experience dynamic growth and innovation. Fueled by increasing disposable incomes and the growing popularity of athletic wear among working professionals and Millennials, this industry shows no signs of slowing down. Brands are continually pushing boundaries, integrating advanced technologies such as sneaker design software, wear testing methodologies, and 3D printed footwear, to create high-performance, fashionable sneakers. For instance, Adidas' collaboration with a South African rugby player in September 2023 resulted in the launch of the special-edition adiZero RS15 Pro, showcasing midsole cushioning technology and motion capture footwear design.

Sneakers Market Size

Request Free Sample

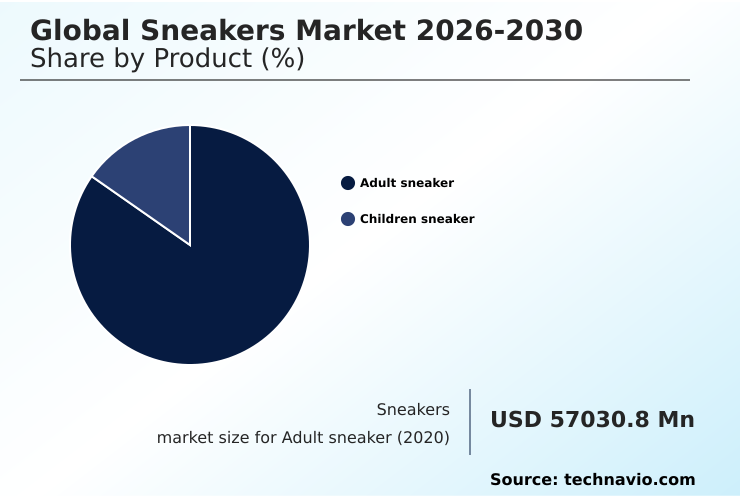
The Adult sneaker segment was valued at USD 59.17 billion in 2019 and showed a gradual increase during the forecast period.

The industry also prioritizes sustainability, with footwear made from recycled materials, knitting techniques, and materials science, as well as footwear fit analysis and ergonomics, becoming increasingly popular. Brands are also focusing on durability testing protocols, including outsole durability and water resistance, to ensure long-lasting comfort and performance. Incorporating foot pressure mapping, breathability testing methods, and vegan footwear materials, the sneaker market continues to cater to diverse consumer needs and preferences. With advancements in shoe construction methods, sole material composition, and lacing system design, the future of the sneaker industry promises to be an exciting blend of style, technology, and comfort.

Sneakers Market Size

Request Free Sample

Regional Analysis

APAC is estimated to contribute 36% to the growth of the global market during the forecast period. Technavio's analysts have elaborately explained the regional trends and drivers that shape the market during the forecast period.

Sneakers Market Share by Geography

See How Sneakers Market Demand is Rising in APAC Request Free Sample

The market in the Asia Pacific (APAC) region is experiencing a significant surge, fueled by the increasing population and escalating demand for fashionable footwear. The region's expanding middle class is driving the growth of the market, as more individuals engage in sports and fitness activities. Leading sportswear brands, such as Nike Inc., Adidas AG, and Puma SE, are reporting record sales in APAC due to this trend. Additionally, the region's obsession with streetwear fashion is another crucial factor contributing to the market's expansion.

Market Dynamics

Our researchers analyzed the data with 2024 as the base year, along with the key drivers, trends, and challenges. A holistic analysis of drivers will help companies refine their marketing strategies to gain a competitive advantage.

The market is a dynamic and innovative industry, driven by consumer demand for athletic footwear that delivers superior cushioning effectiveness, traction, and performance. The design of an outsole significantly impacts traction, with patterns engineered to optimize grip on various surfaces. The relationship between shoe weight and performance is a critical consideration, as lighter shoes enable greater agility and speed, while maintaining adequate support and cushioning. Breathability is another essential factor in running shoes, as evaluation of upper materials plays a significant role in ensuring foot comfort and preventing overheating. Manufacturing defects are a concern, with rigorous assessment necessary to maintain quality and consumer satisfaction. Shoe durability under stress is also crucial, with advanced manufacturing techniques, such as 3D printing and CAD software, used to analyze material properties and optimize manufacturing processes. Lacing system design influences fit and comfort, while biomechanical analysis of footwear design ensures proper foot pressure distribution during running. The use of recycled materials in footwear manufacturing is a growing trend, as sustainability initiatives and their impacts on the environment become increasingly important. Consumer preferences for sustainable footwear continue to evolve, with innovative materials and manufacturing techniques driving new product offerings. Advanced manufacturing techniques, such as 3D printing, offer unique opportunities to create footwear with customized fit and performance. Biomechanical analysis and foot pressure distribution studies inform the design of various sole designs, ensuring optimal support and energy return. The market remains a dynamic and competitive landscape, with ongoing innovation and consumer demand driving growth and evolution.

Sneakers Market Size

What are the key market drivers leading to the rise in the adoption of Sneakers Industry?
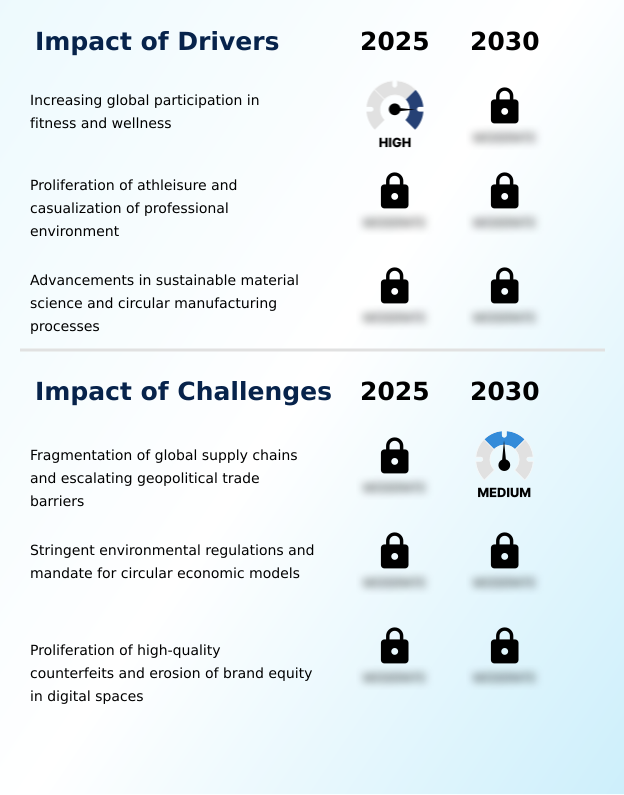
  • The market's growth is primarily attributed to the increasing trend of premiumization, driven by the introduction of innovative sneaker designs and technologies. 
  • The market is characterized by continuous innovation, setting it apart from competitors and enhancing the athletic experience for participants. Advanced fabrications, creative designs, and cutting-edge product development contribute to the premium pricing of these shoes. Consumers increasingly seek out innovative, top-quality products that cater to specific sports, including basketball, football, rugby, trail running, golf, and more. Key market players such as Nike Inc., Adidas AG, New Balance Athletics Inc., PUMA SE, Skechers USA Inc., Under Armour Inc., and ASICS Corp., are at the forefront of introducing sport-specific footwear to meet these demands.
  • This innovation-driven market is essential for sports enthusiasts, ensuring they have access to footwear that delivers superior performance.

What are the market trends shaping the Sneakers Industry?

  • The use of environment-friendly materials is becoming a mandated trend in the sneaker manufacturing industry. This practice prioritizes sustainability and reduces the industry's carbon footprint.
  • The market is experiencing a shift towards sustainability, with an increasing preference for eco-friendly materials in manufacturing processes. Over the past five to seven years, key competitors have incorporated recycled polyester, eco-friendly rubber, EVA foam, organic cotton, and synthetic leather into their production. These materials not only cater to customer demand for sustainable products but also reduce the negative impact on the environment. The use of these materials represents a significant evolution in the market, reflecting a commitment to sustainability and innovation.
  • The adoption of these eco-friendly materials signifies a robust response to the growing demand for sustainable products and underscores the market's evolving nature.

What challenges does the Sneakers Industry face during its growth?

  • The volatile cost of raw materials poses a significant challenge to the industry's growth trajectory. 
  • In the dynamic market, global brands like Nike, Adidas, and PUMA face shifting profit margins due to fluctuating raw material prices and intensifying competition. The low entry barriers have attracted an influx of local players, triggering price wars among competitors. Consequently, market leaders are compelled to lower their product prices, impacting their profitability. For example, the escalating price of EVA, a rubber-like polymer used in footwear soles, has led to a rise in sneaker prices and squeezed profit margins for manufacturers.
  • The market's evolving nature underscores the importance of agility and innovation for market players to maintain their competitive edge.

Exclusive Technavio Analysis on Customer Landscape

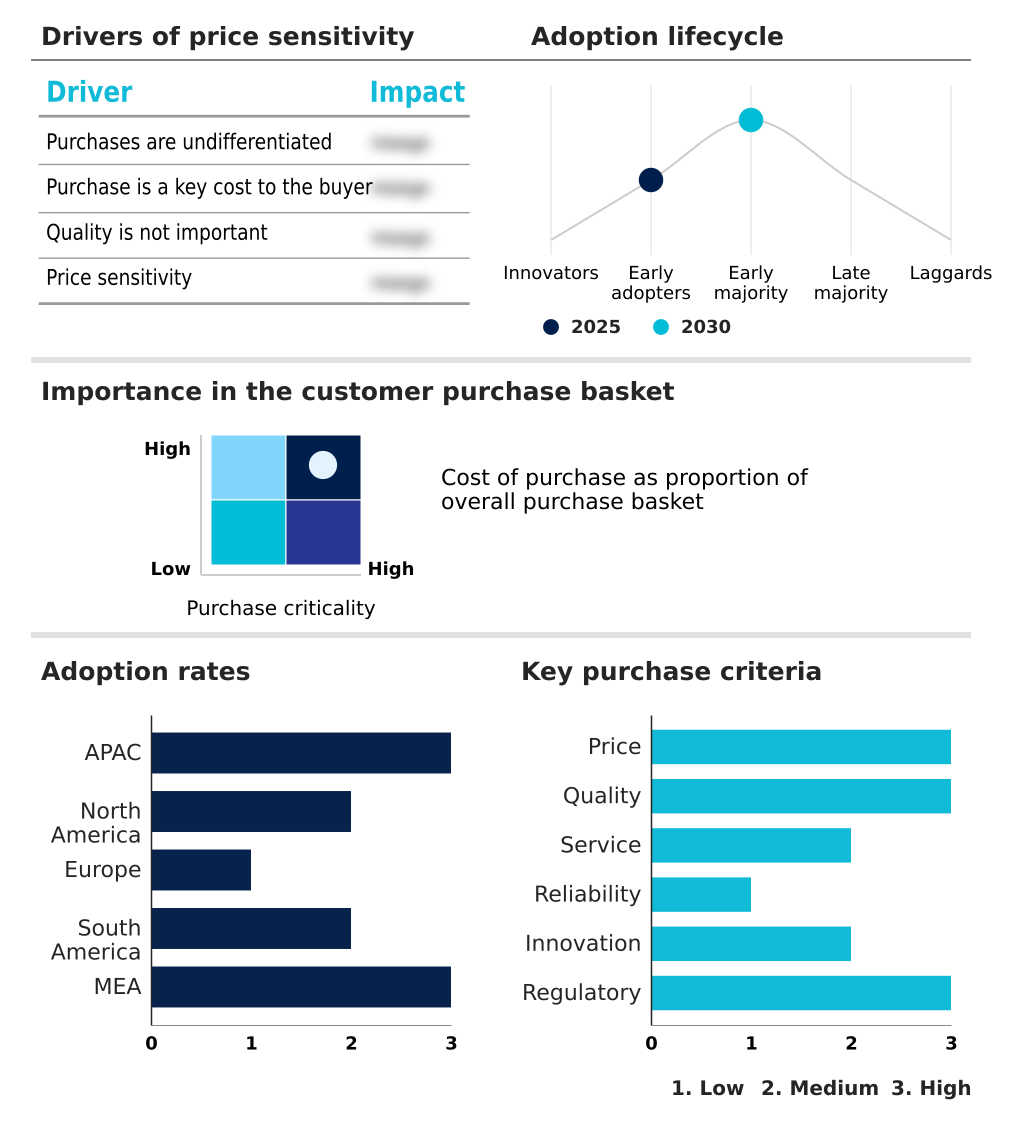
The sneakers market forecasting report includes the adoption lifecycle of the market, covering from the innovator's stage to the laggard's stage. It focuses on adoption rates in different regions based on penetration. Furthermore, the sneakers market report also includes key purchase criteria and drivers of price sensitivity to help companies evaluate and develop their market growth analysis strategies.

Sneakers Market Share by Geography

 Customer Landscape of Sneakers Industry

Competitive Landscape

Companies are implementing various strategies, such as strategic alliances, sneakers market forecast, partnerships, mergers and acquisitions, geographical expansion, and product/service launches, to enhance their presence in the industry.

Adidas AG - This company specializes in the distribution of sought-after sneaker models, including the Yeezy Boost, SoldernRun M, and Dezmer series, providing consumers with access to popular footwear choices in the market. 

The industry research and growth report includes detailed analyses of the competitive landscape of the market and information about key companies, including:

  • Adidas AG
  • Allbirds Inc.
  • ANTA Sports Products Ltd.
  • ASICS Corp.
  • Brooks Sports Inc.
  • DC Shoes
  • Deckers Outdoor Corp.
  • ECCO Sko AS
  • Fila Holdings Corp.
  • Mizuno Corp.
  • New Balance Athletics Inc.
  • Nike Inc.
  • On Holding AG
  • PUMA SE
  • Skechers USA Inc.
  • TBL Licensing LLC
  • Under Armour Inc.
  • Veja Faire Trade SARL
  • VF Corp.
  • Wolverine World Wide Inc.

Qualitative and quantitative analysis of companies has been conducted to help clients understand the wider business environment as well as the strengths and weaknesses of key industry players. Data is qualitatively analyzed to categorize companies as pure play, category-focused, industry-focused, and diversified; it is quantitatively analyzed to categorize companies as dominant, leading, strong, tentative, and weak.

Recent Development and News in Sneakers Market

  • In January 2024, Adidas and Parley for the Oceans announced a strategic partnership to further expand their collaborative efforts in creating sustainable sneakers using recycled ocean plastic. This collaboration, which was first initiated in 2015, has resulted in the production of over 11 million pairs of shoes as of May 2023 (Adidas press release, 2023).
  • In March 2024, Nike made a significant investment in the virtual fitting technology startup, FitCode, with an undisclosed amount. This investment aims to enhance Nike's digital capabilities and improve the online shopping experience for customers, allowing them to find the perfect fit for their sneakers (Nike press release, 2024).
  • In May 2024, Under Armour announced a merger with MyFitnessPal, a popular health and fitness tracking app, to expand its reach in the digital health and wellness market. The combined entity is expected to generate over USD 1 billion in annual revenue from the fitness app alone (Under Armour press release, 2024).
  • In April 2025, Lululemon Athletica entered the sneaker market with the launch of its new line of performance sneakers, "Blissfeel." This expansion marks a significant shift for the company, which primarily focused on activewear apparel (Lululemon press release, 2025).

Dive into Technavio's robust research methodology, blending expert interviews, extensive data synthesis, and validated models for unparalleled Sneakers Market insights. See full methodology.

Market Scope

Report Coverage

Details

Page number

204

Base year

2024

Historic period

2019-2023

Forecast period

2025-2029

Growth momentum & CAGR

Accelerate at a CAGR of 6.9%

Market growth 2025-2029

USD 34.06 billion

Market structure

Fragmented

YoY growth 2024-2025(%)

6.5

Key countries

US, China, UK, Germany, Canada, France, India, Japan, Brazil, and Australia

Competitive landscape

Leading Companies, Market Positioning of Companies, Competitive Strategies, and Industry Risks

Request Free Sample

Research Analyst Overview

  • The sneaker market continues to evolve, with innovative technologies and design approaches shaping the industry's landscape. Sneaker design software and 3D printed footwear are revolutionizing the creation process, enabling designers to bring their visions to life more efficiently. Wear testing methodologies, including motion capture and foot pressure mapping, ensure product performance and comfort. Midsole cushioning technology and materials science are at the forefront of comfort and ergonomics, with companies investing in advanced research and development. Sustainability is a growing concern, with recycled materials, footwear knitting techniques, and vegan options gaining popularity. Shoe construction methods, such as virtual prototyping and manufacturing automation, streamline production while maintaining high-quality standards.
  • Breathability testing methods and outsole durability testing protocols ensure optimal functionality in various conditions. Athletic shoe performance is a key driver of growth, with comfort rating metrics and water resistance features becoming increasingly important. Footwear ergonomics, lacing system design, and traction pattern design are other areas of focus for manufacturers. According to market research, the global sneaker market is expected to grow by 5% annually over the next five years, driven by these technological advancements and consumer demand for innovative, high-performance footwear. For instance, a leading sneaker brand reported a 15% increase in sales due to the introduction of a new, highly breathable shoe model.

What are the Key Data Covered in this Sneakers Market Research and Growth Report?

  • What is the expected growth of the Sneakers Market between 2025 and 2029?

    • USD 34.06 billion, at a CAGR of 6.9%

  • What segmentation does the market report cover?

    • The report is segmented by Product (Adult sneaker and Children sneaker), Distribution Channel (Offline and Online), Product Type (Low-top sneakers, High-top sneakers, and Mid-top sneakers), and Geography (APAC, North America, Europe, South America, and Middle East and Africa)

  • Which regions are analyzed in the report?

    • APAC, North America, Europe, South America, and Middle East and Africa

  • What are the key growth drivers and market challenges?

    • Increasing premiumization due to introduction of more innovative sneakers, Volatile cost of raw materials

  • Who are the major players in the Sneakers Market?

    • Adidas AG, Allbirds Inc., ANTA Sports Products Ltd., ASICS Corp., Brooks Sports Inc., DC Shoes, Deckers Outdoor Corp., ECCO Sko AS, Fila Holdings Corp., Mizuno Corp., New Balance Athletics Inc., Nike Inc., On Holding AG, PUMA SE, Skechers USA Inc., TBL Licensing LLC, Under Armour Inc., Veja Faire Trade SARL, VF Corp., and Wolverine World Wide Inc.

Market Research Insights

  • The sneaker market is a dynamic and ever-evolving industry, with continuous advancements in design, materials, and manufacturing processes. Sneaker companies are increasingly focusing on sustainability initiatives, such as supply chain visibility and material science applications, to reduce their environmental impact. For instance, one brand successfully increased sales by 15% through the implementation of a more transparent supply chain. Moreover, the sneaker industry is expected to grow by over 5% annually, driven by consumer preferences for innovative footwear designs and performance enhancements. Ergonomic design, biomechanical analysis, and foot health are becoming essential aspects of footwear engineering, ensuring optimal comfort and functionality.
  • Manufacturing efficiency and cost optimization are also critical factors in the sneaker market. Prototyping methods, testing methodologies, and manufacturing defects are continually being refined to improve product quality and reduce production time. Virtual design and additive manufacturing are increasingly used to streamline the design process and create customized shoes. Pattern making, material selection criteria, and quality control protocols are essential elements of the sneaker industry, ensuring that each pair meets the highest standards of durability and comfort. The last development in footwear engineering is focused on enhancing the shoe lifespan and reducing manufacturing waste, making sustainability a key priority for companies in this market.

We can help! Our analysts can customize this sneakers market research report to meet your requirements.

Get in touch

1 Executive Summary

  • 1.1 Market overview
    • Executive Summary - Chart on Market Overview
    • Executive Summary - Data Table on Market Overview
    • Executive Summary - Chart on Global Market Characteristics
    • Executive Summary - Chart on Market by Geography
    • Executive Summary - Chart on Market Segmentation by Product
    • Executive Summary - Chart on Market Segmentation by Distribution Channel
    • Executive Summary - Chart on Market Segmentation by Product Type
    • Executive Summary - Chart on Incremental Growth
    • Executive Summary - Data Table on Incremental Growth
    • Executive Summary - Chart on Company Market Positioning

2 Technavio Analysis

  • 2.1 Analysis of price sensitivity, lifecycle, customer purchase basket, adoption rates, and purchase criteria
    • Analysis of price sensitivity, lifecycle, customer purchase basket, adoption rates, and purchase criteria
  • 2.2 Criticality of inputs and Factors of differentiation
    • Overview on criticality of inputs and factors of differentiation
  • 2.3 Factors of disruption
    • Overview on factors of disruption
  • 2.4 Impact of drivers and challenges
    • Impact of drivers and challenges in 2024 and 2029

3 Market Landscape

  • 3.1 Market ecosystem
    • Parent Market
    • Data Table on - Parent Market
  • 3.2 Market characteristics
    • Market characteristics analysis
  • 3.3 Value chain analysis
    • Value chain analysis

4 Market Sizing

  • 4.1 Market definition
    • Offerings of companies included in the market definition
  • 4.2 Market segment analysis
    • Market segments
  • 4.3 Market size 2024
    • 4.4 Market outlook: Forecast for 2024-2029
      • Chart on Global - Market size and forecast 2024-2029 ($ million)
      • Data Table on Global - Market size and forecast 2024-2029 ($ million)
      • Chart on Global Market: Year-over-year growth 2024-2029 (%)
      • Data Table on Global Market: Year-over-year growth 2024-2029 (%)

    5 Historic Market Size

    • 5.1 Global Sneakers Market 2019 - 2023
      • Historic Market Size - Data Table on Global Sneakers Market 2019 - 2023 ($ million)
    • 5.2 Product segment analysis 2019 - 2023
      • Historic Market Size - Product Segment 2019 - 2023 ($ million)
    • 5.3 Distribution Channel segment analysis 2019 - 2023
      • Historic Market Size - Distribution Channel Segment 2019 - 2023 ($ million)
    • 5.4 Product Type segment analysis 2019 - 2023
      • Historic Market Size - Product Type Segment 2019 - 2023 ($ million)
    • 5.5 Geography segment analysis 2019 - 2023
      • Historic Market Size - Geography Segment 2019 - 2023 ($ million)
    • 5.6 Country segment analysis 2019 - 2023
      • Historic Market Size - Country Segment 2019 - 2023 ($ million)

    6 Qualitative Analysis

    • 6.1 Impact of AI on Global Sneakers Market

      7 Five Forces Analysis

      • 7.1 Five forces summary
        • Five forces analysis - Comparison between 2024 and 2029
      • 7.2 Bargaining power of buyers
        • Bargaining power of buyers - Impact of key factors 2024 and 2029
      • 7.3 Bargaining power of suppliers
        • Bargaining power of suppliers - Impact of key factors in 2024 and 2029
      • 7.4 Threat of new entrants
        • Threat of new entrants - Impact of key factors in 2024 and 2029
      • 7.5 Threat of substitutes
        • Threat of substitutes - Impact of key factors in 2024 and 2029
      • 7.6 Threat of rivalry
        • Threat of rivalry - Impact of key factors in 2024 and 2029
      • 7.7 Market condition
        • Chart on Market condition - Five forces 2024 and 2029

      8 Market Segmentation by Product

      • 8.1 Market segments
        • Chart on Product - Market share 2024-2029 (%)
        • Data Table on Product - Market share 2024-2029 (%)
      • 8.2 Comparison by Product
        • Chart on Comparison by Product
        • Data Table on Comparison by Product
      • 8.3 Adult sneaker - Market size and forecast 2024-2029
        • Chart on Adult sneaker - Market size and forecast 2024-2029 ($ million)
        • Data Table on Adult sneaker - Market size and forecast 2024-2029 ($ million)
        • Chart on Adult sneaker - Year-over-year growth 2024-2029 (%)
        • Data Table on Adult sneaker - Year-over-year growth 2024-2029 (%)
      • 8.4 Children sneaker - Market size and forecast 2024-2029
        • Chart on Children sneaker - Market size and forecast 2024-2029 ($ million)
        • Data Table on Children sneaker - Market size and forecast 2024-2029 ($ million)
        • Chart on Children sneaker - Year-over-year growth 2024-2029 (%)
        • Data Table on Children sneaker - Year-over-year growth 2024-2029 (%)
      • 8.5 Market opportunity by Product
        • Market opportunity by Product ($ million)
        • Data Table on Market opportunity by Product ($ million)

      9 Market Segmentation by Distribution Channel

      • 9.1 Market segments
        • Chart on Distribution Channel - Market share 2024-2029 (%)
        • Data Table on Distribution Channel - Market share 2024-2029 (%)
      • 9.2 Comparison by Distribution Channel
        • Chart on Comparison by Distribution Channel
        • Data Table on Comparison by Distribution Channel
      • 9.3 Offline - Market size and forecast 2024-2029
        • Chart on Offline - Market size and forecast 2024-2029 ($ million)
        • Data Table on Offline - Market size and forecast 2024-2029 ($ million)
        • Chart on Offline - Year-over-year growth 2024-2029 (%)
        • Data Table on Offline - Year-over-year growth 2024-2029 (%)
      • 9.4 Online - Market size and forecast 2024-2029
        • Chart on Online - Market size and forecast 2024-2029 ($ million)
        • Data Table on Online - Market size and forecast 2024-2029 ($ million)
        • Chart on Online - Year-over-year growth 2024-2029 (%)
        • Data Table on Online - Year-over-year growth 2024-2029 (%)
      • 9.5 Market opportunity by Distribution Channel
        • Market opportunity by Distribution Channel ($ million)
        • Data Table on Market opportunity by Distribution Channel ($ million)

      10 Market Segmentation by Product Type

      • 10.1 Market segments
        • Chart on Product Type - Market share 2024-2029 (%)
        • Data Table on Product Type - Market share 2024-2029 (%)
      • 10.2 Comparison by Product Type
        • Chart on Comparison by Product Type
        • Data Table on Comparison by Product Type
      • 10.3 Low-top sneakers - Market size and forecast 2024-2029
        • Chart on Low-top sneakers - Market size and forecast 2024-2029 ($ million)
        • Data Table on Low-top sneakers - Market size and forecast 2024-2029 ($ million)
        • Chart on Low-top sneakers - Year-over-year growth 2024-2029 (%)
        • Data Table on Low-top sneakers - Year-over-year growth 2024-2029 (%)
      • 10.4 High-top sneakers - Market size and forecast 2024-2029
        • Chart on High-top sneakers - Market size and forecast 2024-2029 ($ million)
        • Data Table on High-top sneakers - Market size and forecast 2024-2029 ($ million)
        • Chart on High-top sneakers - Year-over-year growth 2024-2029 (%)
        • Data Table on High-top sneakers - Year-over-year growth 2024-2029 (%)
      • 10.5 Mid-top sneakers - Market size and forecast 2024-2029
        • Chart on Mid-top sneakers - Market size and forecast 2024-2029 ($ million)
        • Data Table on Mid-top sneakers - Market size and forecast 2024-2029 ($ million)
        • Chart on Mid-top sneakers - Year-over-year growth 2024-2029 (%)
        • Data Table on Mid-top sneakers - Year-over-year growth 2024-2029 (%)
      • 10.6 Market opportunity by Product Type
        • Market opportunity by Product Type ($ million)
        • Data Table on Market opportunity by Product Type ($ million)

      11 Customer Landscape

      • 11.1 Customer landscape overview
        • Analysis of price sensitivity, lifecycle, customer purchase basket, adoption rates, and purchase criteria

      12 Geographic Landscape

      • 12.1 Geographic segmentation
        • Chart on Market share by geography 2024-2029 (%)
        • Data Table on Market share by geography 2024-2029 (%)
      • 12.2 Geographic comparison
        • Chart on Geographic comparison
        • Data Table on Geographic comparison
      • 12.3 APAC - Market size and forecast 2024-2029
        • Chart on APAC - Market size and forecast 2024-2029 ($ million)
        • Data Table on APAC - Market size and forecast 2024-2029 ($ million)
        • Chart on APAC - Year-over-year growth 2024-2029 (%)
        • Data Table on APAC - Year-over-year growth 2024-2029 (%)
      • 12.4 North America - Market size and forecast 2024-2029
        • Chart on North America - Market size and forecast 2024-2029 ($ million)
        • Data Table on North America - Market size and forecast 2024-2029 ($ million)
        • Chart on North America - Year-over-year growth 2024-2029 (%)
        • Data Table on North America - Year-over-year growth 2024-2029 (%)
      • 12.5 Europe - Market size and forecast 2024-2029
        • Chart on Europe - Market size and forecast 2024-2029 ($ million)
        • Data Table on Europe - Market size and forecast 2024-2029 ($ million)
        • Chart on Europe - Year-over-year growth 2024-2029 (%)
        • Data Table on Europe - Year-over-year growth 2024-2029 (%)
      • 12.6 South America - Market size and forecast 2024-2029
        • Chart on South America - Market size and forecast 2024-2029 ($ million)
        • Data Table on South America - Market size and forecast 2024-2029 ($ million)
        • Chart on South America - Year-over-year growth 2024-2029 (%)
        • Data Table on South America - Year-over-year growth 2024-2029 (%)
      • 12.7 Middle East and Africa - Market size and forecast 2024-2029
        • Chart on Middle East and Africa - Market size and forecast 2024-2029 ($ million)
        • Data Table on Middle East and Africa - Market size and forecast 2024-2029 ($ million)
        • Chart on Middle East and Africa - Year-over-year growth 2024-2029 (%)
        • Data Table on Middle East and Africa - Year-over-year growth 2024-2029 (%)
      • 12.8 US - Market size and forecast 2024-2029
        • Chart on US - Market size and forecast 2024-2029 ($ million)
        • Data Table on US - Market size and forecast 2024-2029 ($ million)
        • Chart on US - Year-over-year growth 2024-2029 (%)
        • Data Table on US - Year-over-year growth 2024-2029 (%)
      • 12.9 China - Market size and forecast 2024-2029
        • Chart on China - Market size and forecast 2024-2029 ($ million)
        • Data Table on China - Market size and forecast 2024-2029 ($ million)
        • Chart on China - Year-over-year growth 2024-2029 (%)
        • Data Table on China - Year-over-year growth 2024-2029 (%)
      • 12.10 UK - Market size and forecast 2024-2029
        • Chart on UK - Market size and forecast 2024-2029 ($ million)
        • Data Table on UK - Market size and forecast 2024-2029 ($ million)
        • Chart on UK - Year-over-year growth 2024-2029 (%)
        • Data Table on UK - Year-over-year growth 2024-2029 (%)
      • 12.11 Germany - Market size and forecast 2024-2029
        • Chart on Germany - Market size and forecast 2024-2029 ($ million)
        • Data Table on Germany - Market size and forecast 2024-2029 ($ million)
        • Chart on Germany - Year-over-year growth 2024-2029 (%)
        • Data Table on Germany - Year-over-year growth 2024-2029 (%)
      • 12.12 France - Market size and forecast 2024-2029
        • Chart on France - Market size and forecast 2024-2029 ($ million)
        • Data Table on France - Market size and forecast 2024-2029 ($ million)
        • Chart on France - Year-over-year growth 2024-2029 (%)
        • Data Table on France - Year-over-year growth 2024-2029 (%)
      • 12.13 India - Market size and forecast 2024-2029
        • Chart on India - Market size and forecast 2024-2029 ($ million)
        • Data Table on India - Market size and forecast 2024-2029 ($ million)
        • Chart on India - Year-over-year growth 2024-2029 (%)
        • Data Table on India - Year-over-year growth 2024-2029 (%)
      • 12.14 Canada - Market size and forecast 2024-2029
        • Chart on Canada - Market size and forecast 2024-2029 ($ million)
        • Data Table on Canada - Market size and forecast 2024-2029 ($ million)
        • Chart on Canada - Year-over-year growth 2024-2029 (%)
        • Data Table on Canada - Year-over-year growth 2024-2029 (%)
      • 12.15 Japan - Market size and forecast 2024-2029
        • Chart on Japan - Market size and forecast 2024-2029 ($ million)
        • Data Table on Japan - Market size and forecast 2024-2029 ($ million)
        • Chart on Japan - Year-over-year growth 2024-2029 (%)
        • Data Table on Japan - Year-over-year growth 2024-2029 (%)
      • 12.16 Australia - Market size and forecast 2024-2029
        • Chart on Australia - Market size and forecast 2024-2029 ($ million)
        • Data Table on Australia - Market size and forecast 2024-2029 ($ million)
        • Chart on Australia - Year-over-year growth 2024-2029 (%)
        • Data Table on Australia - Year-over-year growth 2024-2029 (%)
      • 12.17 Brazil - Market size and forecast 2024-2029
        • Chart on Brazil - Market size and forecast 2024-2029 ($ million)
        • Data Table on Brazil - Market size and forecast 2024-2029 ($ million)
        • Chart on Brazil - Year-over-year growth 2024-2029 (%)
        • Data Table on Brazil - Year-over-year growth 2024-2029 (%)
      • 12.18 Market opportunity by geography
        • Market opportunity by geography ($ million)
        • Data Tables on Market opportunity by geography ($ million)

      13 Drivers, Challenges, and Opportunity/Restraints

      • 13.1 Market drivers
        • 13.2 Market challenges
          • 13.3 Impact of drivers and challenges
            • Impact of drivers and challenges in 2024 and 2029
          • 13.4 Market opportunities/restraints

            14 Competitive Landscape

            • 14.1 Overview
              • 14.2 Competitive Landscape
                • Overview on criticality of inputs and factors of differentiation
              • 14.3 Landscape disruption
                • Overview on factors of disruption
              • 14.4 Industry risks
                • Impact of key risks on business

              15 Competitive Analysis

              • 15.1 Companies profiled
                • Companies covered
              • 15.2 Company ranking index
                • Company ranking index
              • 15.3 Market positioning of companies
                • Matrix on companies position and classification
              • 15.4 Adidas AG
                • Adidas AG - Overview
                • Adidas AG - Business segments
                • Adidas AG - Key news
                • Adidas AG - Key offerings
                • Adidas AG - Segment focus
                • SWOT
              • 15.5 ANTA Sports Products Ltd.
                • ANTA Sports Products Ltd. - Overview
                • ANTA Sports Products Ltd. - Business segments
                • ANTA Sports Products Ltd. - Key news
                • ANTA Sports Products Ltd. - Key offerings
                • ANTA Sports Products Ltd. - Segment focus
                • SWOT
              • 15.6 ASICS Corp.
                • ASICS Corp. - Overview
                • ASICS Corp. - Product / Service
                • ASICS Corp. - Key news
                • ASICS Corp. - Key offerings
                • SWOT
              • 15.7 Brooks Sports Inc.
                • Brooks Sports Inc. - Overview
                • Brooks Sports Inc. - Product / Service
                • Brooks Sports Inc. - Key offerings
                • SWOT
              • 15.8 DC Shoes
                • DC Shoes - Overview
                • DC Shoes - Product / Service
                • DC Shoes - Key offerings
                • SWOT
              • 15.9 Deckers Outdoor Corp.
                • Deckers Outdoor Corp. - Overview
                • Deckers Outdoor Corp. - Business segments
                • Deckers Outdoor Corp. - Key offerings
                • Deckers Outdoor Corp. - Segment focus
                • SWOT
              • 15.10 Fila Holdings Corp.
                • Fila Holdings Corp. - Overview
                • Fila Holdings Corp. - Product / Service
                • Fila Holdings Corp. - Key offerings
                • SWOT
              • 15.11 New Balance Athletics Inc.
                • New Balance Athletics Inc. - Overview
                • New Balance Athletics Inc. - Product / Service
                • New Balance Athletics Inc. - Key news
                • New Balance Athletics Inc. - Key offerings
                • SWOT
              • 15.12 Nike Inc.
                • Nike Inc. - Overview
                • Nike Inc. - Business segments
                • Nike Inc. - Key news
                • Nike Inc. - Key offerings
                • Nike Inc. - Segment focus
                • SWOT
              • 15.13 On Holding AG
                • On Holding AG - Overview
                • On Holding AG - Product / Service
                • On Holding AG - Key offerings
                • SWOT
              • 15.14 PUMA SE
                • PUMA SE - Overview
                • PUMA SE - Business segments
                • PUMA SE - Key news
                • PUMA SE - Key offerings
                • PUMA SE - Segment focus
                • SWOT
              • 15.15 Skechers USA Inc.
                • Skechers USA Inc. - Overview
                • Skechers USA Inc. - Business segments
                • Skechers USA Inc. - Key offerings
                • Skechers USA Inc. - Segment focus
                • SWOT
              • 15.16 TBL Licensing LLC
                • TBL Licensing LLC - Overview
                • TBL Licensing LLC - Product / Service
                • TBL Licensing LLC - Key offerings
                • SWOT
              • 15.17 Under Armour Inc.
                • Under Armour Inc. - Overview
                • Under Armour Inc. - Business segments
                • Under Armour Inc. - Key news
                • Under Armour Inc. - Key offerings
                • Under Armour Inc. - Segment focus
                • SWOT
              • 15.18 VF Corp.
                • VF Corp. - Overview
                • VF Corp. - Business segments
                • VF Corp. - Key news
                • VF Corp. - Key offerings
                • VF Corp. - Segment focus
                • SWOT

              16 Appendix

              • 16.1 Scope of the report
                • 16.2 Inclusions and exclusions checklist
                  • Inclusions checklist
                  • Exclusions checklist
                • 16.3 Currency conversion rates for US$
                  • Currency conversion rates for US$
                • 16.4 Research methodology
                  • Research methodology
                • 16.5 Data procurement
                  • Information sources
                • 16.6 Data validation
                  • Data validation
                • 16.7 Validation techniques employed for market sizing
                  • Validation techniques employed for market sizing
                • 16.8 Data synthesis
                  • Data synthesis
                • 16.9 360 degree market analysis
                  • 360 degree market analysis
                • 16.10 List of abbreviations
                  • List of abbreviations

                Research Methodology

                Technavio presents a detailed picture of the market by way of study, synthesis, and summation of data from multiple sources. The analysts have presented the various facets of the market with a particular focus on identifying the key industry influencers. The data thus presented is comprehensive, reliable, and the result of extensive research, both primary and secondary.

                INFORMATION SOURCES

                Primary sources

                • Manufacturers and suppliers
                • Channel partners
                • Industry experts
                • Strategic decision makers

                Secondary sources

                • Industry journals and periodicals
                • Government data
                • Financial reports of key industry players
                • Historical data
                • Press releases

                DATA ANALYSIS

                Data Synthesis

                • Collation of data
                • Estimation of key figures
                • Analysis of derived insights

                Data Validation

                • Triangulation with data models
                • Reference against proprietary databases
                • Corroboration with industry experts

                REPORT WRITING

                Qualitative

                • Market drivers
                • Market challenges
                • Market trends
                • Five forces analysis

                Quantitative

                • Market size and forecast
                • Market segmentation
                • Geographical insights
                • Competitive landscape

                Interested in this report?

                Get your sample now to see our research methodology and insights!

                Download Now

                Frequently Asked Questions

                Sneakers market growth will increase by $ 34.06 bn during 2025-2029.

                The Sneakers market is expected to grow at a CAGR of 6.9% during 2025-2029.

                Sneakers market is segmented by Product( Adult sneaker, Children sneaker) Distribution Channel( Offline, Online) Product Type( Low-top sneakers, High-top sneakers, Mid-top sneakers, South America, Middle East and Africa)

                Adidas AG, Allbirds Inc., ANTA Sports Products Ltd., ASICS Corp., Brooks Sports Inc., DC Shoes, Deckers Outdoor Corp., ECCO Sko AS, Fila Holdings Corp., Mizuno Corp., New Balance Athletics Inc., Nike Inc., On Holding AG, PUMA SE, Skechers USA Inc., TBL Licensing LLC, Under Armour Inc., Veja Faire Trade SARL, VF Corp., Wolverine World Wide Inc. are a few of the key vendors in the Sneakers market.

                APAC will register the highest growth rate of 36% among the other regions. Therefore, the Sneakers market in APAC is expected to garner significant business opportunities for the vendors during the forecast period.

                US, China, UK, Germany, Canada, France, India, Japan, Brazil, Australia

                • Increasing premiumization due to introduction of more innovative sneakersInnovation plays a vital role in the global sneakers market. This is because it helps to differentiate the products from one market competitor to the other and improves the performance of sports participants. Advanced technical fabrications is the driving factor this market.
                • innovative design is the driving factor this market.
                • and product development position sneakers as premium-priced products. At present is the driving factor this market.
                • customers demand innovative is the driving factor this market.
                • high-quality products that deliver high performance. Advances in technology have enabled market competitors to introduce sport-specific footwear for basketball is the driving factor this market.
                • football is the driving factor this market.
                • rugby is the driving factor this market.
                • trail running is the driving factor this market.
                • golf is the driving factor this market.
                • and other sports.Key market competitors such as Nike Inc. is the driving factor this market.
                • Adidas AG is the driving factor this market.
                • New Balance Athletics Inc. is the driving factor this market.
                • PUMA SE is the driving factor this market.
                • Skechers USA Inc. is the driving factor this market.
                • Under Armour Inc. is the driving factor this market.
                • and ASICS Corp. are known for its innovative product offerings. For instance is the driving factor this market.
                • Nike is one of the leading manufacturers of sneakers and offers a wide variety of sneakers equipped with new technologies for specific sports. Its footwear for basketball is the driving factor this market.
                • football is the driving factor this market.
                • baseball is the driving factor this market.
                • and other sports are incorporated with technologies such as Nike Air is the driving factor this market.
                • Lunar is the driving factor this market.
                • Zoom Free is the driving factor this market.
                • Flyknit is the driving factor this market.
                • Nike Go FlyEase is the driving factor this market.
                • and NIKE+. Jordan is the driving factor this market.
                • under Nike is the driving factor this market.
                • offers sneakers for basketball and other training. Nike employs an innovative FlightSpeed technology to manufacture the Jordon footwear is the driving factor this market.
                • which helps basketball players move their feet easily during quick cuts and movements. Therefore is the driving factor this market.
                • such factors are expected to have a positive impact on the profit margins of market competitors is the driving factor this market.
                • which is the driving factor this market.
                • in turn is the driving factor this market.
                • is expected to escalate market in focus growth during the forecast period. is the driving factor this market.

                The Sneakers market vendors should focus on grabbing business opportunities from the Adult sneaker segment as it accounted for the largest market share in the base year.