
Social Business Intelligence Market Size 2026-2030
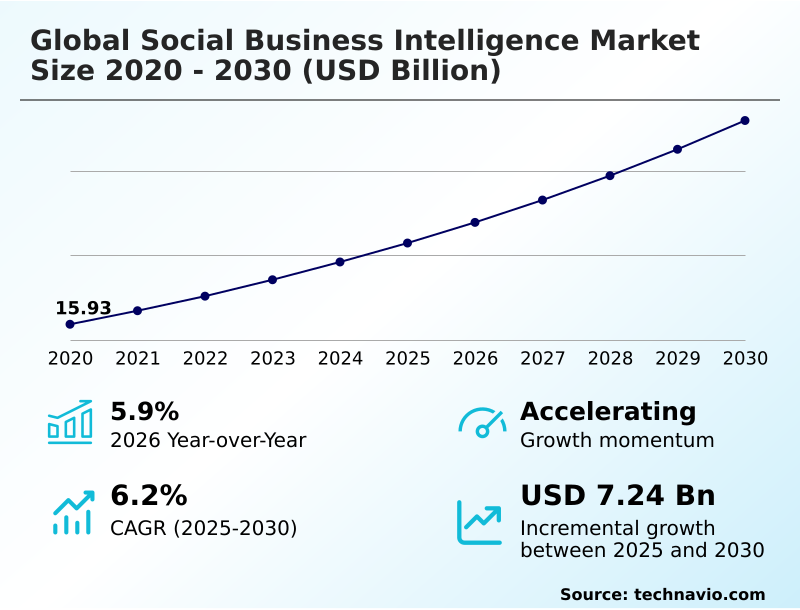
The social business intelligence market size is valued to increase by USD 7.24 billion, at a CAGR of 6.2% from 2025 to 2030. Proliferation of social media platforms and escalating user generated content will drive the social business intelligence market.
Major Market Trends & Insights
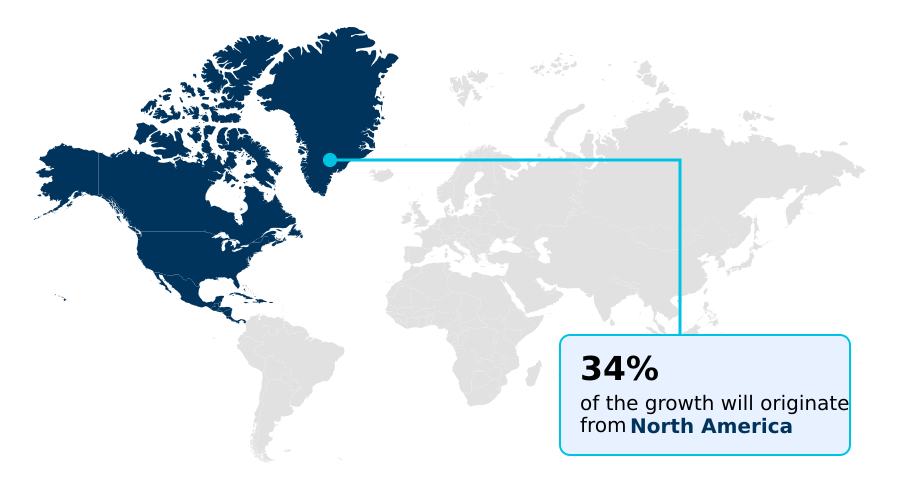
- North America dominated the market and accounted for a 34.1% growth during the forecast period.
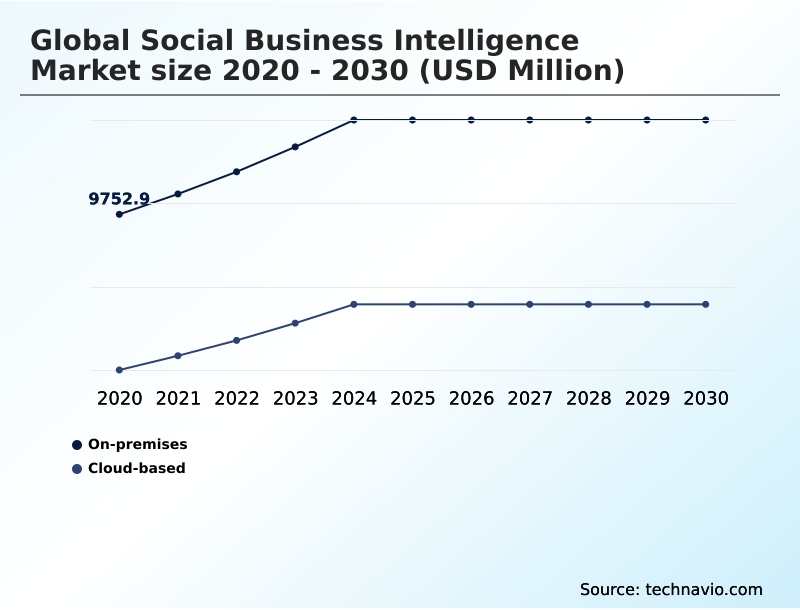
- By Deployment - On-premises segment was valued at USD 11.92 billion in 2024
- By End-user - Enterprises segment accounted for the largest market revenue share in 2024
Market Size & Forecast
- Market Opportunities: USD 12.04 billion
- Market Future Opportunities: USD 7.24 billion
- CAGR from 2025 to 2030 : 6.2%
Market Summary
- The social business intelligence market is defined by its capacity to convert vast streams of unstructured online data into strategic assets. Organizations are moving beyond simple social media monitoring to adopt platforms that provide deep voice of the customer analysis and competitive benchmarking.
- A key driver is the need for real time market intelligence to inform data driven decision making in volatile environments. This involves leveraging technologies like natural language processing and machine learning for sophisticated sentiment analysis, emotion recognition, and intent analysis.
- A significant trend is the integration of these insights into core business systems, such as linking social crm integration data to enrich customer profiles for marketing campaign optimization. For instance, a consumer goods company can use public opinion tracking and topic modeling to identify negative sentiment surrounding product packaging, enabling a proactive redesign before sales are impacted.
- This shift toward predictive and actionable insights, derived from social data aggregation, underscores the market's growing importance. However, challenges related to data privacy compliance and ensuring data veracity require robust governance frameworks, pushing vendors to innovate in areas of ethical data sourcing and secure unstructured data analysis.
What will be the Size of the Social Business Intelligence Market during the forecast period?
Get Key Insights on Market Forecast (PDF) Get Free Sample
How is the Social Business Intelligence Market Segmented?
The social business intelligence industry research report provides comprehensive data (region-wise segment analysis), with forecasts and estimates in "USD million" for the period 2026-2030, as well as historical data from 2020-2024 for the following segments.
- Deployment
- On-premises
- Cloud-based
- End-user
- Enterprises
- Government
- Application
- Sales and marketing management
- Customer engagement and analysis
- Competitive intelligence
- Risk and compliance management
- Asset and inventory management
- Geography
- North America
- US
- Canada
- Mexico
- APAC
- China
- Japan
- India
- Europe
- Germany
- UK
- France
- South America
- Brazil
- Argentina
- Middle East and Africa
- Saudi Arabia
- UAE
- South Africa
- Rest of World (ROW)
- North America
By Deployment Insights
The on-premises segment is estimated to witness significant growth during the forecast period.
The on-premises deployment model provides maximum control over data, a critical requirement for sectors with strict compliance mandates needing advanced reputational risk management.
This approach involves hosting natural language processing tools on internal servers, ensuring that insights from voice of the customer analysis remain secure. It allows for deep customization, facilitating detailed customer journey mapping and audience segmentation through social crm integration.
While this model enhances customer experience management and ensures ethical data sourcing, it involves higher operational costs. Maintaining on-site data integrity can be 20% more resource-intensive than cloud alternatives.
This trade-off defines the segment's position, appealing to entities where control over campaign performance tracking and entity extraction is non-negotiable for functions like customer service improvement or even supply chain monitoring.
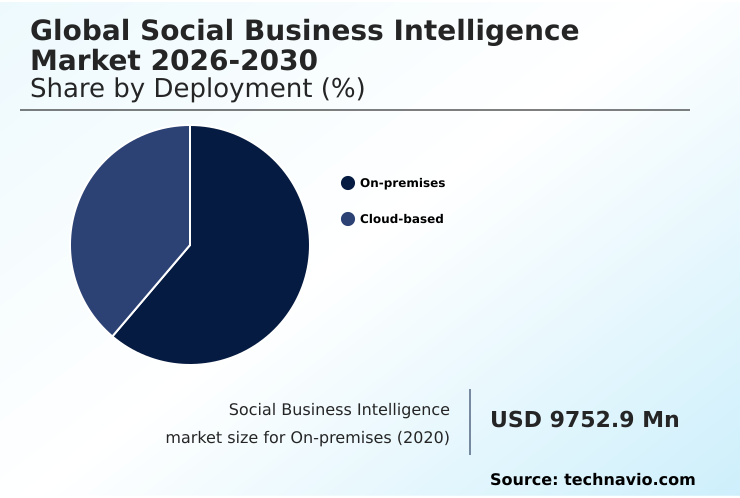
The On-premises segment was valued at USD 11.92 billion in 2024 and showed a gradual increase during the forecast period.
Regional Analysis
North America is estimated to contribute 34.1% to the growth of the global market during the forecast period.Technavio’s analysts have elaborately explained the regional trends and drivers that shape the market during the forecast period.
See How Social Business Intelligence Market Demand is Rising in North America Get Free Sample
The geographic landscape is characterized by varied maturity levels. North America, contributing over 34% of incremental growth, leads in adopting predictive analytics for competitive benchmarking and sales lead generation.
APAC is the fastest-growing region, where social commerce insights and influencer identification are key applications for tracking user engagement metrics. Europe's market is shaped by data privacy, spurring innovation in compliant customer feedback analysis.
Firms using compliant tools have reduced data processing risks by 40%. Emerging markets focus on foundational social media monitoring and brand health tracking.
Advanced network analysis, geospatial analysis, and demographic analysis are used globally to support emerging narrative tracking and understand regional nuances.
Market Dynamics
Our researchers analyzed the data with 2025 as the base year, along with the key drivers, trends, and challenges. A holistic analysis of drivers will help companies refine their marketing strategies to gain a competitive advantage.
- Strategic implementation of social business intelligence is increasingly focused on specialized, high-value use cases that directly impact operational outcomes. Businesses are now using social data for product innovation, moving beyond simple feedback to structured customer intent analysis from social media. The practice of real time sentiment tracking for brands has become standard for proactive reputation management.
- For more complex needs, advanced analytics for unstructured social data are essential, often employing ai in social media listening to uncover subtle trends. The selection of social media competitive intelligence tools is a critical decision, as is measuring marketing campaign social impact to justify marketing expenditures.
- Many organizations are exploring social business intelligence for healthcare to understand patient sentiment and public health trends. A key goal is integrating social data with crm to create a unified customer view, a strategy that has been shown to improve customer retention by double-digit percentages compared to siloed approaches.
- Furthermore, the application of social data for supply chain visibility is an emerging area, helping to predict disruptions. Other critical functions include social intelligence for risk management and automating customer feedback analysis social. This is complemented by improving customer service with social listening and identifying market trends with social data.
- Ultimately, the objective is to enable comprehensive tracking brand reputation across social platforms while establishing a clear framework for social business intelligence roi calculation, addressing ethical considerations in social data analysis, and leveraging visual analytics for social media data to communicate insights effectively to stakeholders.
- The rise of social media analytics for e commerce and predictive analytics in social media marketing further highlights this shift towards specialized, data-driven strategies.
What are the key market drivers leading to the rise in the adoption of Social Business Intelligence Industry?
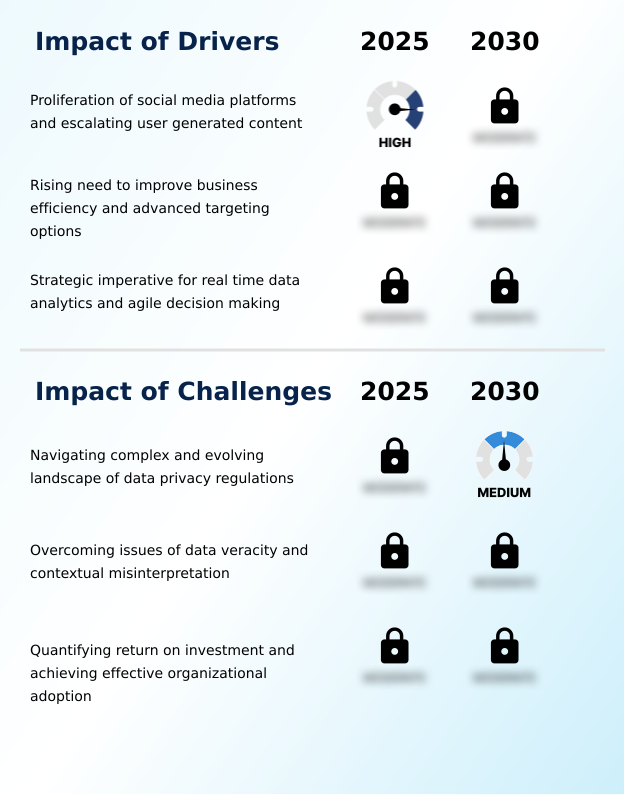
- The proliferation of social media platforms, coupled with the escalating volume of user-generated content, serves as a primary driver for the market.
- The primary driver is the strategic imperative for real time data analytics to inform corporate strategy formulation.
- The sheer volume of user generated content offers an unparalleled source of unsolicited feedback, compelling businesses to invest in social data aggregation and unstructured data analysis for continuous brand perception monitoring.
- This enables an omnichannel customer view and supports data driven decision making, leading to a 20% increase in marketing campaign optimization. The need for strategic business insights is also a significant factor.
- Using social data for product development feedback has been shown to reduce time-to-market by up to 15%, highlighting the value of cross channel analytics in gaining a competitive edge by monitoring public opinion tracking.
What are the market trends shaping the Social Business Intelligence Industry?
- The market is experiencing a significant evolution beyond basic sentiment analysis. There is a growing emphasis on deploying advanced emotion and intent recognition technologies to gain a more nuanced understanding of consumer behavior.
- A primary trend is the evolution from basic sentiment analysis to sophisticated emotion recognition and intent analysis, providing a deeper understanding of consumer behavior patterns. The integration of ai in social media listening is central to this shift, with platforms now capable of performing real-time topic modeling and crisis detection, enabling customer support automation.
- This has allowed businesses to improve proactive service, reducing issue resolution times by over 30%. Another key trend is the application of visual analytics, allowing for intuitive interpretation of datasets from online conversation tracking and text mining, making insights accessible for stakeholder perception analysis.
- Companies successfully unifying this data report an 18% higher accuracy in their trend forecasting models for gaining real time market intelligence via automated reporting dashboards.
What challenges does the Social Business Intelligence Industry face during its growth?
- Navigating the complex and evolving landscape of global data privacy regulations presents a key challenge to the industry's growth.
- A significant challenge is navigating data privacy regulations, which complicates ethical data sourcing and requires stringent data privacy compliance. Adherence can increase operational overhead by up to 25% for global firms. Another key issue is overcoming problems with data veracity, which affects the reliability of sentiment analysis, intent analysis, and overall customer sentiment scoring.
- Quantifying social media roi and achieving effective organizational adoption also remain persistent hurdles for any social media intelligence platform. Organizations often struggle to connect insights from social listening directly to revenue, with only 40% of companies reporting a clear model for roi measurement. This difficulty limits budget allocation for critical functions like risk and compliance monitoring and public relations management.
Exclusive Technavio Analysis on Customer Landscape
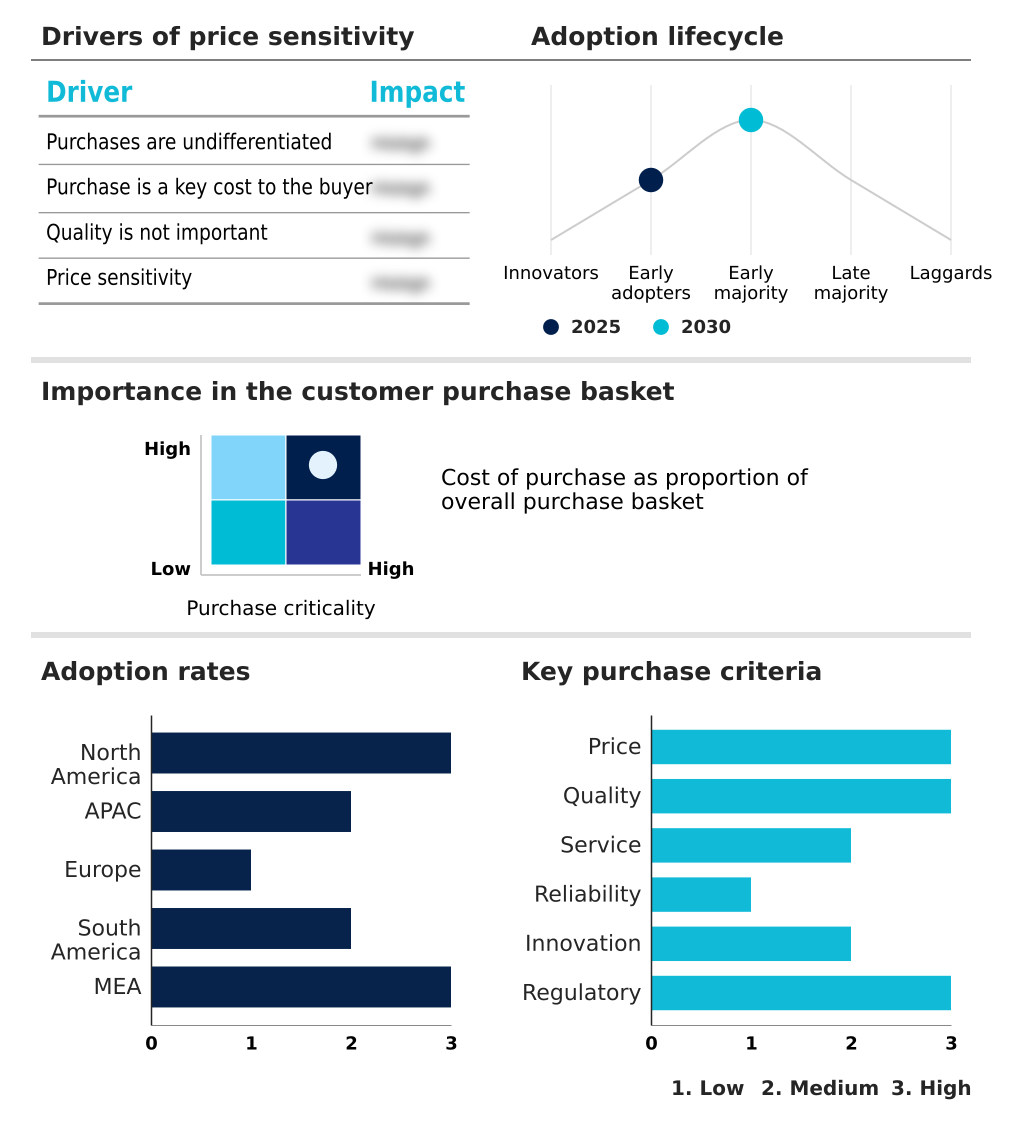
The social business intelligence market forecasting report includes the adoption lifecycle of the market, covering from the innovator’s stage to the laggard’s stage. It focuses on adoption rates in different regions based on penetration. Furthermore, the social business intelligence market report also includes key purchase criteria and drivers of price sensitivity to help companies evaluate and develop their market growth analysis strategies.
Customer Landscape of Social Business Intelligence Industry
Competitive Landscape
Companies are implementing various strategies, such as strategic alliances, social business intelligence market forecast, partnerships, mergers and acquisitions, geographical expansion, and product/service launches, to enhance their presence in the industry.
Acquia Inc. - Provides a customer data platform that integrates digital experience analytics and social engagement insights to deliver a comprehensive view of consumer interactions and sentiment.
The industry research and growth report includes detailed analyses of the competitive landscape of the market and information about key companies, including:
- Acquia Inc.
- Actabl Inc
- Adobe Inc.
- Cision US Inc.
- Emplifi Inc.
- GoodData Corp.
- Google LLC
- Hewlett Packard Enterprise Co.
- IBM Corp.
- Ipsos SA
- Microsoft Corp.
- Oracle Corp.
- Piano Software Inc.
- Qualtrics LLC
- Quid
- Salesforce Inc.
- SAP SE
- SAS Institute Inc.
- Sprout Social Inc.
- Stratebi SL
Qualitative and quantitative analysis of companies has been conducted to help clients understand the wider business environment as well as the strengths and weaknesses of key industry players. Data is qualitatively analyzed to categorize companies as pure play, category-focused, industry-focused, and diversified; it is quantitatively analyzed to categorize companies as dominant, leading, strong, tentative, and weak.
Recent Development and News in Social business intelligence market
- In September 2024, ASGN Inc. and Salesforce Inc. announced a 360-degree partnership to accelerate the delivery of AI-powered solutions across enterprise platforms, enhancing social business intelligence capabilities.
- In January 2025, Sprinklr Inc. announced its artificial intelligence agents received industry recognition for integrating insights and automating workflows across marketing, customer service, and research functions.
- In February 2025, X Corp. (formerly Twitter) expanded its Data Partnership Program, increasing third-party access to its real-time, anonymized data stream for enhanced social analytics development.
- In March 2025, Salesforce Inc. and Adobe Inc. launched the Unified Customer Intelligence Initiative, a strategic partnership for deep, bidirectional integration of their respective customer data and experience platforms.
Dive into Technavio’s robust research methodology, blending expert interviews, extensive data synthesis, and validated models for unparalleled Social Business Intelligence Market insights. See full methodology.
| Market Scope | |
|---|---|
| Page number | 293 |
| Base year | 2025 |
| Historic period | 2020-2024 |
| Forecast period | 2026-2030 |
| Growth momentum & CAGR | Accelerate at a CAGR of 6.2% |
| Market growth 2026-2030 | USD 7235.5 million |
| Market structure | Fragmented |
| YoY growth 2025-2026(%) | 5.9% |
| Key countries | US, Canada, Mexico, China, Japan, India, South Korea, Australia, Indonesia, Germany, UK, France, Italy, Spain, The Netherlands, Brazil, Argentina, Chile, Saudi Arabia, UAE, South Africa, Israel and Turkey |
| Competitive landscape | Leading Companies, Market Positioning of Companies, Competitive Strategies, and Industry Risks |
Research Analyst Overview
- The social business intelligence market is maturing from a monitoring function into an essential strategic tool, enabling deep unstructured data analysis. Core capabilities now include natural language processing for nuanced sentiment analysis and emotion recognition, moving beyond simple metrics to actionable intent analysis. Organizations utilize social data aggregation and text mining for comprehensive brand perception monitoring and competitive intelligence.
- A key boardroom consideration is the use of public opinion tracking and market trend identification for corporate strategy and product lifecycle management. For example, by using predictive analytics on data from online conversation tracking, firms have achieved a 25% improvement in forecast accuracy for new product launches.
- The process involves robust social listening and topic modeling to perform detailed voice of the customer analysis and audience segmentation. Effective campaign performance tracking and influencer identification are critical for marketing, while crisis detection is vital for reputational risk management.
- The integration of visual analytics, entity extraction, network analysis, geospatial analysis, and demographic analysis provides a multi-faceted view, turning user generated content from social media monitoring into a cornerstone of data driven decision making and customer journey mapping, all while ensuring data veracity. This is further supported by the growing demand for social commerce insights.
What are the Key Data Covered in this Social Business Intelligence Market Research and Growth Report?
-
What is the expected growth of the Social Business Intelligence Market between 2026 and 2030?
-
USD 7.24 billion, at a CAGR of 6.2%
-
-
What segmentation does the market report cover?
-
The report is segmented by Deployment (On-premises, and Cloud-based), End-user (Enterprises, and Government), Application (Sales and marketing management, Customer engagement and analysis, Competitive intelligence, Risk and compliance management, and Asset and inventory management) and Geography (North America, APAC, Europe, South America, Middle East and Africa)
-
-
Which regions are analyzed in the report?
-
North America, APAC, Europe, South America and Middle East and Africa
-
-
What are the key growth drivers and market challenges?
-
Proliferation of social media platforms and escalating user generated content, Navigating complex and evolving landscape of data privacy regulations
-
-
Who are the major players in the Social Business Intelligence Market?
-
Acquia Inc., Actabl Inc, Adobe Inc., Cision US Inc., Emplifi Inc., GoodData Corp., Google LLC, Hewlett Packard Enterprise Co., IBM Corp., Ipsos SA, Microsoft Corp., Oracle Corp., Piano Software Inc., Qualtrics LLC, Quid, Salesforce Inc., SAP SE, SAS Institute Inc., Sprout Social Inc. and Stratebi SL
-
Market Research Insights
- The social business intelligence market is evolving into a critical component for corporate strategy formulation and operational excellence. Organizations leverage these platforms for more than just brand health tracking; they are central to customer experience management and sales lead generation.
- Integrating social crm integration has shown to improve lead conversion rates by up to 15% by providing richer context on prospect needs. Furthermore, using these tools for customer service improvement can reduce response times by over 30%, directly impacting satisfaction. The application of insights for product development feedback allows companies to align with market demands more effectively.
- Effective roi measurement remains a key focus, with businesses that successfully link social data to outcomes reporting a 2x higher return on their marketing analytics investments compared to those that do not. This demonstrates a clear shift toward quantifiable value and strategic alignment.
We can help! Our analysts can customize this social business intelligence market research report to meet your requirements.
 RIA -
RIA - 
