Sodium Sulfite Market Size 2025-2029
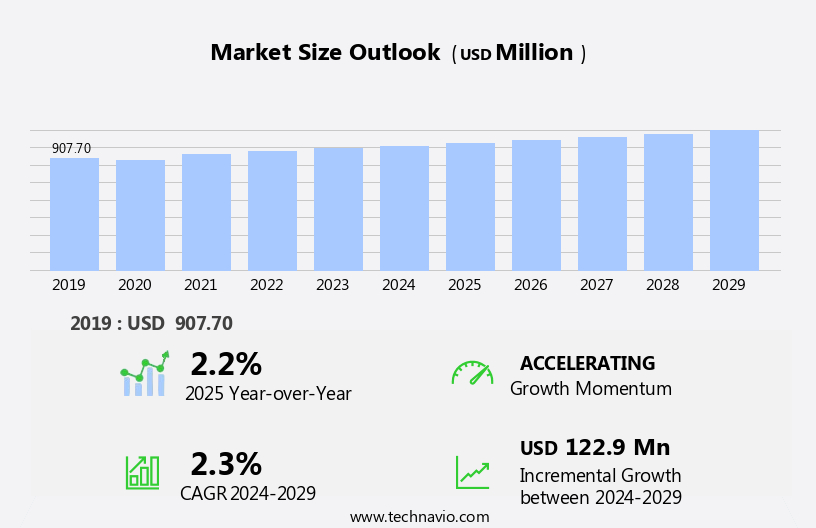
The sodium sulfite market size is forecast to increase by USD 122.9 million, at a CAGR of 2.3% between 2024 and 2029.
- The market is driven by the growing demand for this chemical in food packaging applications, particularly in China. Sodium sulfite's recognition as a safe food additive contributes significantly to its market growth. However, the market faces challenges related to the potential side effects of sodium sulfite, including respiratory issues and allergic reactions. These health concerns may limit the market's expansion and necessitate stringent regulations and safety measures.
- Navigating these challenges effectively requires a deep understanding of regulatory requirements and consumer preferences, as well as the ability to innovate and adapt to emerging trends in the industry. Companies seeking to capitalize on market opportunities should focus on ensuring product safety and transparency, while also exploring alternative applications for sodium sulfite beyond food packaging. The market faces challenges related to its production and disposal, as well as increasing regulations regarding its use in food packaging and wastewater treatment.
What will be the Size of the Sodium Sulfite Market during the forecast period?
- In the dynamic market, technology advances continue to shape the industry. Sodium sulfite sustainability is a growing concern, with an increasing focus on anhydrous sodium sulfite recycling and biodegradability. Sodium sulfite is a widely used chemical compound with preserving properties in various industries, including pulp and paper, pharmaceuticals, and water treatment. Research and development efforts are underway to enhance sodium sulfite's sustainability profile, leading to innovations in sodium sulfite decomposition and solubility. Regulations governing sodium sulfite disposal and density are evolving, with stricter standards and certifications becoming the norm. Sodium sulfite patents are being actively pursued to secure competitive advantages, while sodium sulfite monohydrate and heptahydrate remain key product offerings.
- Sodium sulfite's toxicity and its impact on the environment are topics of ongoing debate, with a push for safer alternatives and improved safety protocols. Overall, the market is characterized by continuous innovation and regulatory compliance, driven by the need for sustainable and efficient production processes. In the cleaning products sector, sodium sulfite is employed as a builder in detergents and a component in water treatment solutions.
How is this Sodium Sulfite Industry segmented?
The sodium sulfite industry research report provides comprehensive data (region-wise segment analysis), with forecasts and estimates in "USD million" for the period 2025-2029, as well as historical data from 2019-2023 for the following segments.
- Product Type
- Synthetic sodium sulfite
- Natural sodium sulfite
- End-user
- Food and beverage
- Cosmetics
- Pulp and paper
- Others
- Distribution Channel
- Offline
- Online
- Geography
- North America
- US
- Canada
- Europe
- France
- Germany
- UK
- APAC
- Australia
- China
- India
- Japan
- South Korea
- Rest of World (ROW)
- North America
By Product Type Insights
The synthetic sodium sulfite segment is estimated to witness significant growth during the forecast period. The synthetic market holds a significant position in the global sodium sulfite industry. Manufactured through industrial chemical synthesis, this segment ensures high purity and consistency levels. Its applications span various industries with stringent quality standards and performance requirements. Technological advancements and refined chemical processing techniques enhance efficiency, quality control, and environmental compliance. Regulatory alignment is crucial for manufacturers, necessitating standardized production methods across regions. Sodium sulfite's diverse uses include photography, reduction, dehydration, bleaching, testing, preservation, storage, oxidation, and as an anti-oxidant. In photography, it acts as a developer, while in reduction processes, it reduces metals.
Dehydration applications involve removing water from solutions, and bleaching utilizes sodium sulfite for textile and paper processing. Sodium sulfite testing is essential for monitoring its concentration, and it is used as a preservative and antioxidant in the food and beverage industries. Sodium sulfite's packaging, handling, transportation, and storage require careful consideration due to its sensitivity to air and moisture. Proper handling ensures safety and maintains product quality. Pricing dynamics are influenced by production costs, demand, and market conditions. Alternatives like sodium metabisulfite and sodium bisulfite exist, but sodium sulfite's unique properties make it the preferred choice for many applications. Sodium sulfite is also used in the pharmaceutical industry as a reducing agent and antioxidant.
Sodium sulfite's purity and grades are essential for maintaining consistent product performance. Overall, the market's evolution is driven by technological advancements, regulatory compliance, and the diverse applications of this versatile chemical.
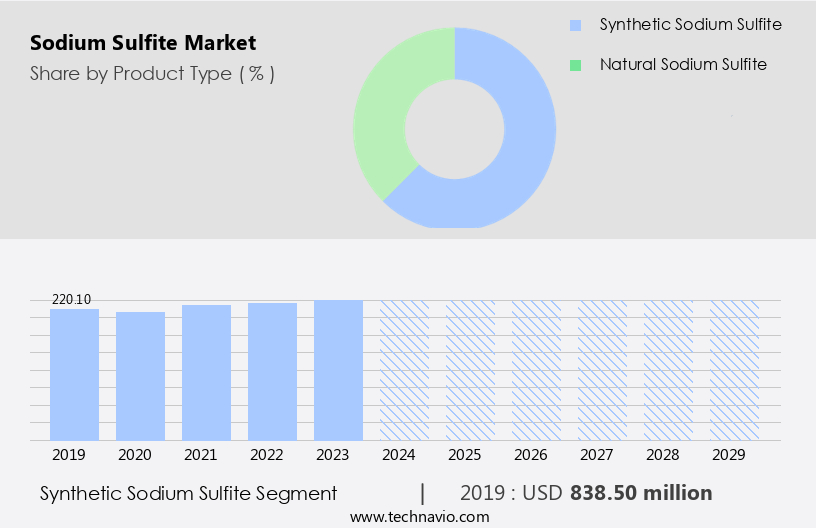
The Synthetic sodium sulfite segment was valued at USD 838.50 million in 2019 and showed a gradual increase during the forecast period.
Regional Analysis
APAC is estimated to contribute 54% to the growth of the global market during the forecast period. Technavio's analysts have elaborately explained the regional trends and drivers that shape the market during the forecast period.
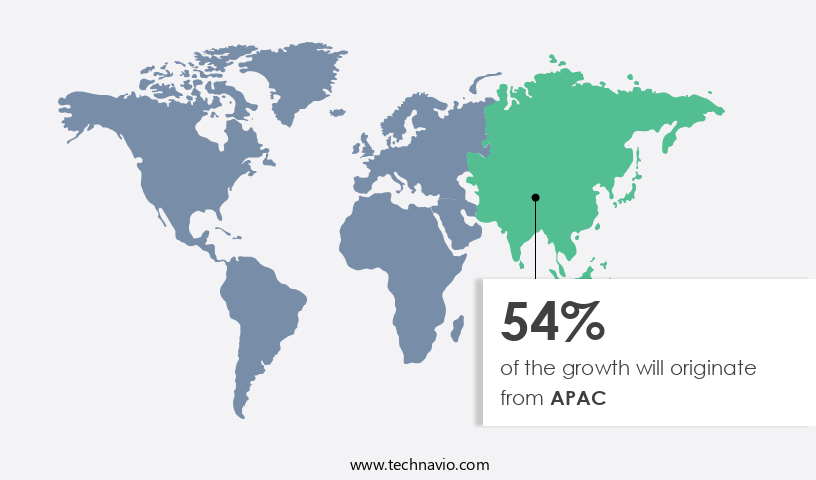
The market is a significant player in various industries, including food, pharmaceuticals, cosmetics, and chemicals. In 2024, APAC emerged as the leading consumer of sodium sulfite, accounting for a substantial share of the global market. The region's dominance can be attributed to its robust demand, innovation, and product development. The packaged food, pharmaceuticals, cosmetics, and chemical industries in APAC are the primary drivers of the market. The growth of these industries, particularly in China, India, South Korea, and Japan, is fueling the demand for sodium sulfite. In 2024, these countries collectively accounted for a significant portion of the sodium sulfite consumption in APAC and are expected to continue their leading position during the forecast period.
The market's growth in APAC is influenced by its applications in various industries, including food preservation, bleaching, and antioxidant properties. The market's evolution involves continuous research and development to meet the increasing demand for sodium sulfite and its derivatives. The sodium sulfite production process includes manufacturing, regulations, reduction, dehydration, testing, packaging, safety, preservation, storage, oxidation, pricing, and handling. These aspects are essential to maintaining the quality and purity of sodium sulfite, ensuring its safe transportation and usage, and providing alternatives and substitutes when necessary. The market's dynamics and trends reflect the industry's ongoing efforts to meet the evolving demands of various sectors while adhering to regulatory standards.
Market Dynamics
Our researchers analyzed the data with 2024 as the base year, along with the key drivers, trends, and challenges. A holistic analysis of drivers will help companies refine their marketing strategies to gain a competitive advantage.
What are the Sodium Sulfite market drivers leading to the rise in the adoption of Industry?
- Sodium sulfite's recognition as a safe food additive for use in packaging is a significant market driver. This approval, based on its food-grade status, significantly contributes to the growth and demand for sodium sulfite in the industry. Sodium sulfite is a crucial chemical compound with diverse applications in various industries, including food packaging, pharmaceuticals, water treatment, and photography. Its primary function as a preservative and antioxidant in food packaging is a significant growth driver in the market. This compound helps maintain food freshness and quality by preventing oxidation and spoilage, thereby extending shelf life. The approval of sodium sulfite by food safety authorities, such as the FDA and EFSA, adds to its market appeal. The increasing consumer preference for packaged and processed foods, coupled with the need for longer shelf life and reduced food waste, fuels the demand for sodium sulfite.
- Moreover, its versatility in various applications further broadens its market scope. In pharmaceuticals, it serves as an essential intermediate in the production of various drugs. In water treatment, it acts as a reducing agent for removing heavy metals and other impurities. In photography, it is used as a developer in black and white film processing. Sodium sulfite's handling, storage, and transportation require careful consideration due to its sensitivity to air and moisture. Proper storage conditions and protective packaging are essential to maintain its quality and efficacy.
What are the Sodium Sulfite market trends shaping the Industry?
- The growing demand for sodium sulfite in China represents a significant market trend in the chemical industry. This trend is driven by increasing applications in various sectors, including water treatment, food processing, and textile manufacturing. Sodium sulfite is a crucial chemical compound used primarily as an anti-oxidant in various industries, including pulp and paper. China is a significant producer and consumer of sodium sulfite, with the APAC region being the primary market due to the high consumption of paper products in countries like China, India, Malaysia, and Japan. The pulp and paper industry's growth in APAC is a key driver for sodium sulfite demand, as it is an essential component in the kraft pulping process.
- The increasing per capita consumption of paper products in APAC, coupled with the high production and export of pulp from Indonesia to major consumers like South Korea, India, Japan, and China, further boosts sodium sulfite demand. Additionally, the rising consumption of pulp in China for paper and paperboard production contributes to the market's growth. In the pulp and paper industry, sodium sulfite functions as a process regulator and dechlorinating agent, ensuring efficient steam boiler operations and reducing chlorine emissions.
How does Sodium Sulfite market face challenges during its growth?
- The growth of the industry is adversely affected by the challenges posed by the side effects of sodium sulfite. Specifically, this chemical compound's potential adverse reactions present a significant hurdle to industry expansion. Sodium sulfite is a widely used chemical in various industries, including food packaging, textiles, and paper production. However, its usage comes with potential health risks, as some individuals may experience adverse reactions, such as discomfort, itchy skin, mild stomach pain, and nausea. More severe reactions can include allergic responses, including skin rashes, hives, and swelling of the face, lips, or tongue. These health concerns have resulted in increased regulatory scrutiny, which could hinder market expansion. Despite its extensive applications, addressing the negative health impacts of sodium sulfite consumption is essential for market players to ensure consumer safety and sustainable growth.
- Sodium sulfite substitutes, such as ascorbic acid and calcium ascorbate, are gaining popularity due to their safer alternatives. Additionally, sodium sulfite reduction and dehydration techniques can minimize the health risks associated with its usage. Market dynamics, including regulatory challenges and the availability of substitutes, significantly impact the market. The food and beverage industry has experienced significant growth, with a rising population leading to an increase in demand for packaged and processed food items. This trend is driving the demand for sodium sulfite in the sector, particularly in the production of canned and frozen fruits, fruit and vegetable juices, fruit fillings, syrups, jams, jellies, and dried fruits and vegetables.
Exclusive Customer Landscape
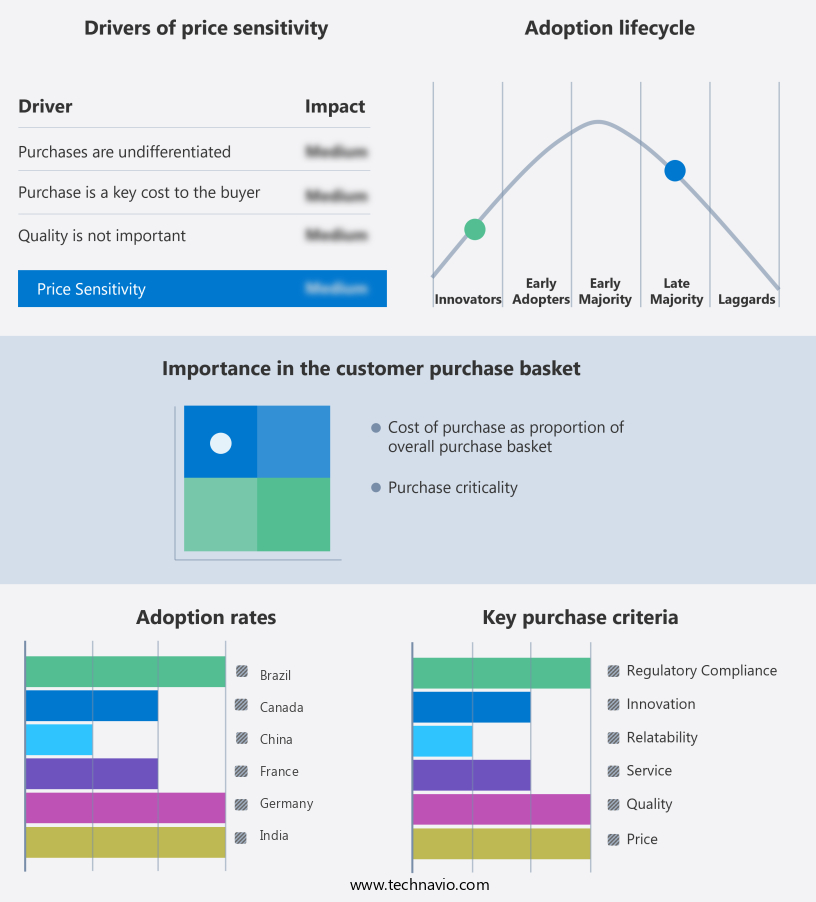
The sodium sulfite market forecasting report includes the adoption lifecycle of the market, covering from the innovator's stage to the laggard's stage. It focuses on adoption rates in different regions based on penetration. Furthermore, the sodium sulfite market report also includes key purchase criteria and drivers of price sensitivity to help companies evaluate and develop their market growth analysis strategies.
Customer Landscape
Key Companies & Market Insights
Companies are implementing various strategies, such as strategic alliances, sodium sulfite market forecast, partnerships, mergers and acquisitions, geographical expansion, and product/service launches, to enhance their presence in the industry.
Allan Chemical Corp. - The company provides Sodium sulfite which is a versatile chemical compound, widely utilized in various applications within the scientific community.
The industry research and growth report includes detailed analyses of the competitive landscape of the market and information about key companies, including:
- Allan Chemical Corp.
- American Elements
- BASF SE
- Borden and Remington Corp.
- Ganga Chemicals
- Grasim Industries Ltd
- Hemani Industries Ltd.
- INEOS Group Holdings S.A.
- Jay Dinesh Chemicals
- Maoming Guangdi Chemical Co. Ltd.
- Merck KGaA
- Nilkanth Organics
- Solvay SA
- Southern Ionics
- Tokyo Chemical Industry Co. Ltd.
Qualitative and quantitative analysis of companies has been conducted to help clients understand the wider business environment as well as the strengths and weaknesses of key industry players. Data is qualitatively analyzed to categorize companies as pure play, category-focused, industry-focused, and diversified; it is quantitatively analyzed to categorize companies as dominant, leading, strong, tentative, and weak.
Recent Development and News in Sodium Sulfite Market
- In January 2023, DuPont Sustainable Solutions, a leading global specialty materials company, announced the expansion of its sodium sulfite production capacity at its site in Tarragona, Spain. This expansion is expected to enhance DuPont's market position and cater to the growing demand for sodium sulfite in various industries such as pulp and paper, textiles, and water treatment (DuPont Sustainable Solutions, 2023).
- In March 2024, Ashland Global Holdings Inc., a leading specialty chemicals company, entered into a strategic partnership with BioAmber Inc., a biotech company specializing in the production of renewable chemicals. The collaboration aimed to develop and commercialize bio-based sodium sulfite, contributing to the global shift towards sustainable and eco-friendly chemicals (Ashland Global Holdings Inc., 2024).
- In August 2024, INEOS Styrolution, the world's leading styrenics supplier, completed the acquisition of the sodium sulfite business from INEOS ChlorVinyls. This acquisition strengthened INEOS Styrolution's position in the market and expanded its product portfolio (INEOS Styrolution, 2024).
Research Analyst Overview
The market continues to evolve, driven by the diverse applications across various sectors. Sodium sulfite, a versatile chemical compound, serves as an essential ingredient in numerous industries. Its purity, a critical factor in determining its effectiveness, is meticulously maintained throughout the production process. Sodium sulfite's anti-oxidant properties make it indispensable in food processing, water treatment, and textile manufacturing. The market dynamics are influenced by the ongoing research and development efforts to enhance the production methods and grades. Sodium sulfite production processes are continually refined to optimize efficiency and reduce environmental impact. The evolving production techniques aim to address the growing demand for sustainable and eco-friendly manufacturing practices.
The Sodium Sulfite Market is evolving with advancements in sodium sulfite technology and extensive sodium sulfite research driving innovation. The compound exists in various forms, including sodium sulfite heptahydrate, with properties like sodium sulfite solubility and sodium sulfite density playing critical roles in industrial applications. Environmental concerns highlight sodium sulfite toxicity and its sodium sulfite biodegradability, ensuring safe usage and disposal. Industry regulations enforce sodium sulfite standards and require sodium sulfite certifications for compliance. As new applications emerge, sodium sulfite innovation continues to enhance efficiency and sustainability across multiple sectors.
The market's continuous growth is underpinned by its extensive applications, from paper and pulp industry to pharmaceuticals and food processing. The demand for sodium sulfite's anti-oxidant properties in food preservation and its role in textile bleaching further bolster its market presence. In the ever-changing market landscape, sodium sulfite's role remains pivotal, with ongoing research and development efforts focusing on enhancing its purity, expanding its applications, and optimizing production methods. The market's dynamism is a testament to its importance in various industries and the continuous innovation in its production and usage.
The Sodium Sulfite Market is expanding, driven by its versatile sodium sulfite applications in industries such as food preservation, photography, and water treatment. Various sodium sulfite grades ensure adaptability for industrial and commercial uses, maintaining high sodium sulfite purity standards. Efficient sodium sulfite manufacturing processes influence sodium sulfite pricing, while strict sodium sulfite regulations ensure safety and compliance. Proper sodium sulfite handling, sodium sulfite storage, and sodium sulfite packaging are crucial for maintaining product integrity. Secure sodium sulfite transportation supports global distribution. Chemical properties such as sodium sulfite dehydration, sodium sulfite oxidation, and sodium sulfite antioxidant effects enhance usability in sodium sulfite bleaching and sodium sulfite preservation.
Dive into Technavio's strong research methodology, blending expert interviews, extensive data synthesis, and validated models for unparalleled Sodium Sulfite Market insights. See full methodology.
|
Market Scope |
|
|
Report Coverage |
Details |
|
Page number |
203 |
|
Base year |
2024 |
|
Historic period |
2019-2023 |
|
Forecast period |
2025-2029 |
|
Growth momentum & CAGR |
Accelerate at a CAGR of 2.3% |
|
Market growth 2025-2029 |
USD 122.9 million |
|
Market structure |
Fragmented |
|
YoY growth 2024-2025(%) |
2.2 |
|
Key countries |
China, US, India, Japan, Germany, South Korea, Canada, France, Australia, and UK |
|
Competitive landscape |
Leading Companies, Market Positioning of Companies, Competitive Strategies, and Industry Risks |
What are the Key Data Covered in this Sodium Sulfite Market Research and Growth Report?
- CAGR of the Sodium Sulfite industry during the forecast period
- Detailed information on factors that will drive the growth and forecasting between 2025 and 2029
- Precise estimation of the size of the market and its contribution of the industry in focus to the parent market
- Accurate predictions about upcoming growth and trends and changes in consumer behaviour
- Growth of the market across APAC, Europe, North America, Middle East and Africa, and South America
- Thorough analysis of the market's competitive landscape and detailed information about companies
- Comprehensive analysis of factors that will challenge the sodium sulfite market growth of industry companies
We can help! Our analysts can customize this sodium sulfite market research report to meet your requirements.
 RIA -
RIA - 
