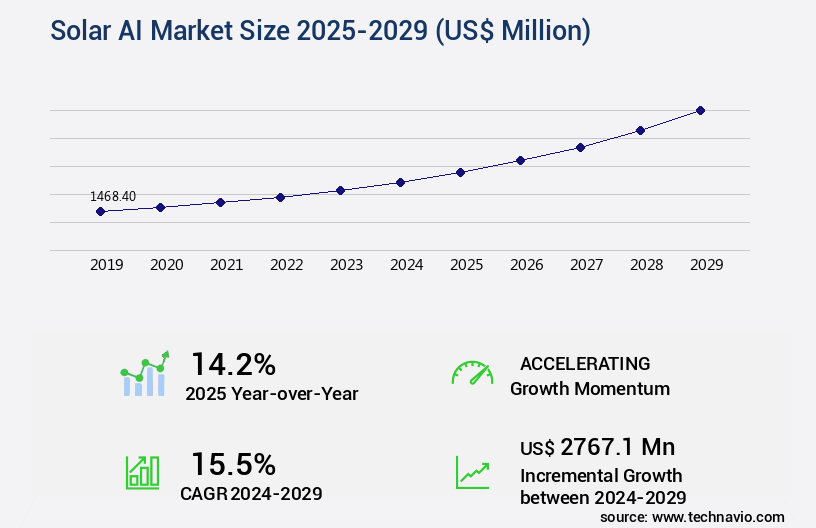
Solar AI Market Size 2025-2029
The solar AI market size is valued to increase by USD 2.77 billion, at a CAGR of 15.5% from 2024 to 2029. Increasing scale and complexity of solar energy assets will drive the solar ai market.
Major Market Trends & Insights
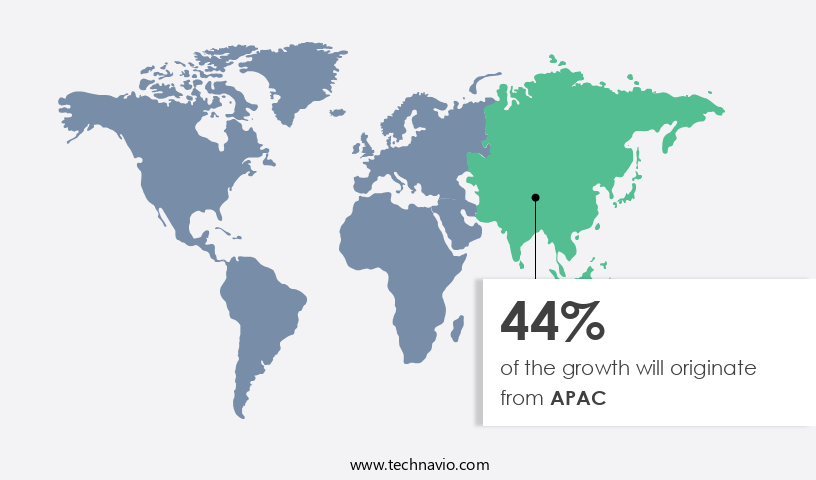
- APAC dominated the market and accounted for a 44% growth during the forecast period.
- By Deployment - Cloud-based segment was valued at USD 739.50 billion in 2023
- By End-user - Commercial segment accounted for the largest market revenue share in 2023
Market Size & Forecast
- Market Opportunities: USD 266.35 million
- Market Future Opportunities: USD 2767.10 million
- CAGR from 2024 to 2029 : 15.5%
Market Summary
- The market is experiencing significant growth, with recent estimates suggesting it will surpass USD1.5 billion by 2025. This expansion is driven by the increasing scale and complexity of solar energy assets, necessitating advanced automation and predictive analytics to optimize performance and reduce operational costs. At the core of this evolution is the emergence of generative AI and sophisticated digital twins. These technologies enable real-time monitoring, predictive maintenance, and dynamic energy management, enhancing the efficiency and reliability of solar installations. However, the high initial investment required to implement these solutions poses a challenge for market adoption. To address this, solar energy companies must demonstrate a clear return on investment (ROI) by showcasing improved performance, reduced downtime, and increased revenue.
- As the market matures, we can expect further advancements in machine learning algorithms, edge computing, and IoT integration, creating new opportunities for innovation and growth. The market represents a pivotal step towards a smarter, more sustainable energy future, offering significant benefits for businesses and the environment alike. By harnessing the power of AI, solar energy providers can optimize their operations, enhance customer satisfaction, and contribute to a more resilient and adaptive energy ecosystem.
What will be the Size of the Solar AI Market during the forecast period?
Get Key Insights on Market Forecast (PDF) Request Free Sample
How is the Solar AI Market Segmented ?
The solar ai industry research report provides comprehensive data (region-wise segment analysis), with forecasts and estimates in "USD million" for the period 2025-2029, as well as historical data from 2019-2023 for the following segments.
- Deployment
- Cloud-based
- On-premises
- End-user
- Commercial
- Residential
- Application
- Solar plant monitoring
- Energy forecasting
- Performance optimization
- Grid integration
- Geography
- North America
- US
- Canada
- Europe
- France
- Germany
- UK
- APAC
- China
- India
- Japan
- South Korea
- South America
- Brazil
- Rest of World (ROW)
- North America
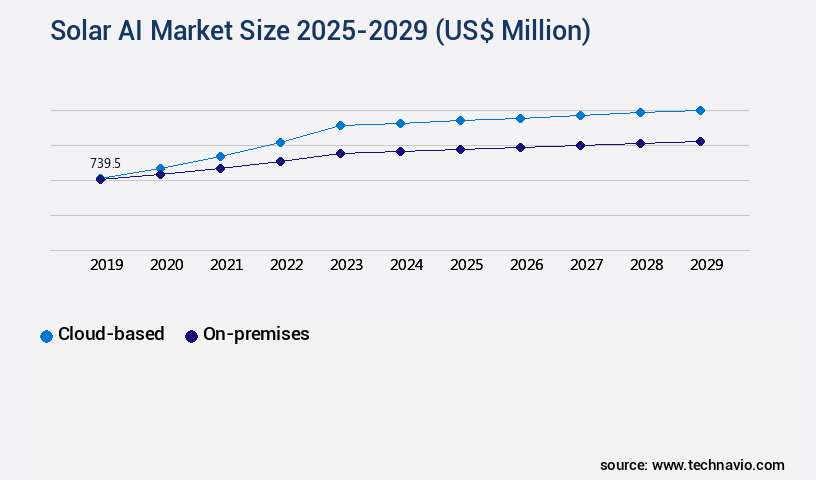
By Deployment Insights
The cloud-based segment is estimated to witness significant growth during the forecast period.
The market is witnessing significant growth, with cloud-based deployment models leading the charge. Hosted on third-party servers like Amazon Web Services, Microsoft Azure, and Google Cloud Platform, these solutions offer scalability, cost efficiency, and accessibility. Solar AI solutions are predominantly delivered through Software as a Service (SaaS), allowing users to access advanced analytics via web browsers or APIs. Renewable energy forecasting, demand-side management, power optimization algorithms, and solar resource assessment are just a few applications of Solar AI. These tools help mitigate shading loss, monitor backsheet degradation, and optimize inverter performance. One notable example of Solar AI's impact is the integration of MPPT algorithms, which can increase photovoltaic efficiency by up to 30%.
This market's evolution is driven by the increasing adoption of distributed generation control, smart grid integration, and energy storage systems. The integration of predictive maintenance models, load balancing strategies, and fault detection algorithms further enhances grid stability and optimizes energy yield. Solar tracking systems and DC-DC converter designs also benefit from Solar AI's advanced capabilities. Overall, the market is a dynamic and essential sector, continually evolving to meet the demands of renewable energy production and grid integration.
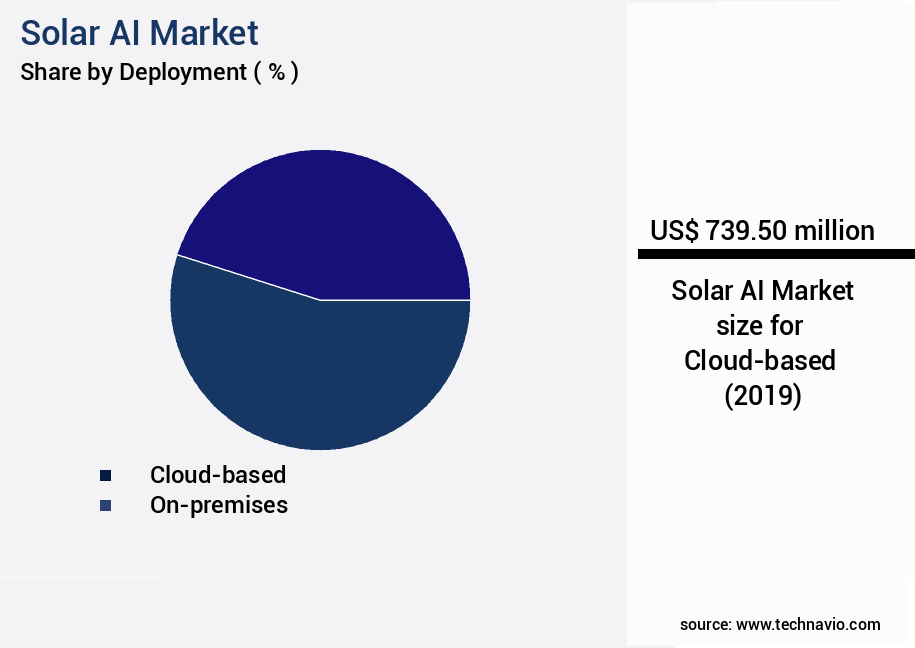
The Cloud-based segment was valued at USD 739.50 billion in 2019 and showed a gradual increase during the forecast period.
Regional Analysis
APAC is estimated to contribute 44% to the growth of the global market during the forecast period.Technavio's analysts have elaborately explained the regional trends and drivers that shape the market during the forecast period.
See How Solar AI Market Demand is Rising in APAC Request Free Sample
The market is witnessing significant growth, particularly in the Asia Pacific (APAC) region, which is both the largest and fastest expanding market for solar installations worldwide. Key drivers behind this expansion include robust government mandates, plummeting solar hardware costs, and escalating energy demands from burgeoning economies in countries such as China, India, and Australia. The immense scale of solar deployment in APAC presents unique challenges and opportunities for AI. Utility-scale solar farms, some of the largest in the world, necessitate AI to manage vast amounts of data, predict failures cost-effectively, and optimize performance under diverse and often harsh environmental conditions.
The market is predominantly driven by the need to monitor, maintain, and optimize these gargantuan projects. According to recent reports, the APAC the market is projected to expand at a remarkable pace, surpassing other regions in terms of growth and market size.
Market Dynamics
Our researchers analyzed the data with 2024 as the base year, along with the key drivers, trends, and challenges. A holistic analysis of drivers will help companies refine their marketing strategies to gain a competitive advantage.
The market is experiencing significant growth as businesses and organizations seek to optimize their solar energy systems through the application of artificial intelligence (AI). One key area of focus is optimizing solar panel array orientation and predicting solar energy production using weather data, which can help maximize energy output and reduce costs. Advanced algorithms are also being used to improve the efficiency of solar inverters, taking into account the impact of shading on photovoltaic system performance and the effects of temperature on solar panel output. To accurately model solar irradiance for different geographic locations, companies are utilizing AI to analyze historical weather data and satellite imagery.
Designing robust battery management systems for solar installations is another area where AI is making a difference, with advanced algorithms used to evaluate long-term performance and degradation of solar panels, minimize energy losses in high-voltage DC transmission, and implement advanced control strategies for grid stability. AI is also being used for predictive maintenance of solar farms, allowing for early identification and resolution of potential issues. Advanced energy storage solutions are being developed to manage peak demand, with AI used to predict solar energy output and compare different solar cell technologies. As renewable energy sources become increasingly integrated into the grid, strategies for efficient grid integration are being developed using AI to analyze the impact of solar irradiance variability on energy production and improve the performance of solar tracking systems. Overall, the market is poised for continued growth as businesses and organizations seek to maximize the efficiency and reliability of their solar energy systems.
What are the key market drivers leading to the rise in the adoption of Solar AI Industry?
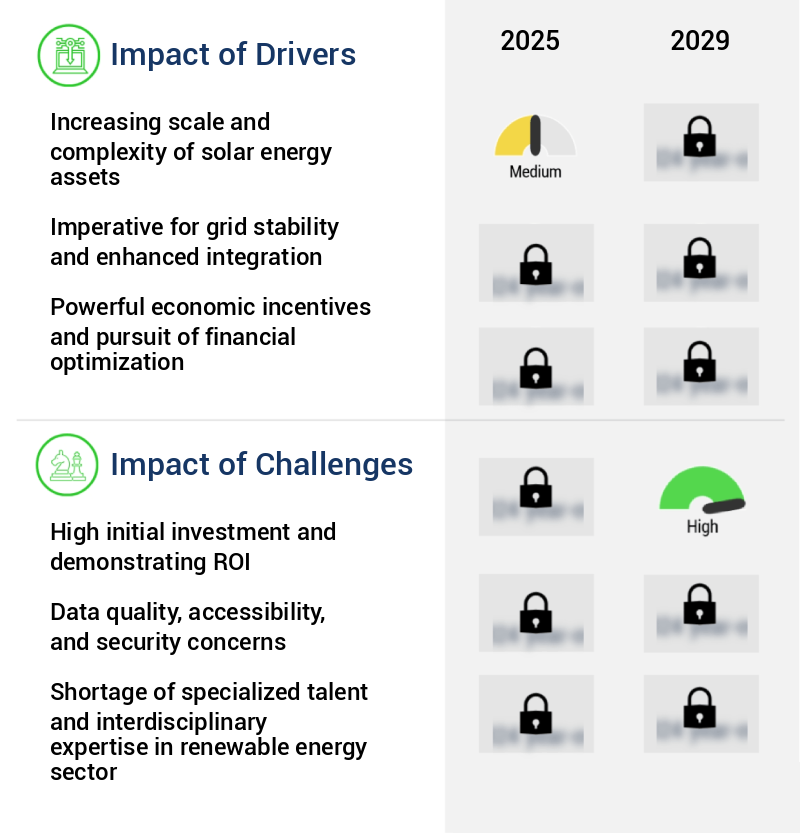
- The escalating scale and complexity of solar energy assets serve as the primary catalyst for market growth.
- The market represents a significant evolution in the solar energy sector, characterized by the expansion of utility-scale solar farms and the proliferation of distributed energy resources (DERs). This shift from small, standalone installations to vast, interconnected solar projects and millions of DERs on rooftops generates an overwhelming amount of data. A single utility-scale plant encompasses millions of solar cells, thousands of panels, hundreds of inverters, and intricate tracking systems, all producing continuous performance data.
- Managing this data influx through conventional methods is infeasible due to its sheer volume and complexity. The global solar energy landscape is witnessing a transition towards AI and machine learning technologies to optimize energy production, reduce operational costs, and enhance overall efficiency.
What are the market trends shaping the Solar AI Industry?
- The emergence of generative AI and sophisticated digital twins represents a significant market trend in the technology industry. These advanced technologies are poised to shape the future of various sectors.
- The market is undergoing a transformative shift, moving beyond predictive and analytical AI towards the adoption of generative AI and the creation of hyper-realistic digital twins. This evolution signifies a paradigm change in the design, commissioning, and operation of solar assets. Digital twins are no longer static, data-based models; they are becoming dynamic, physics-informed, and photorealistic virtual replicas of entire solar farms. This transition is facilitated by the integration of operational SCADA data with advanced technologies such as LiDAR scans, drone imagery, and neural radiance fields.
- In these virtual environments, operators can simulate the effects of various scenarios, including extreme weather events and equipment failures, as well as evaluate different maintenance strategies, all without risking physical assets. The integration of AI in solar energy is expected to significantly enhance efficiency and productivity, with the market projected to reach a substantial market size in the coming years.
What challenges does the Solar AI Industry face during its growth?
- The industry's growth is hindered by the significant upfront investments required and the necessity to demonstrate a return on investment (ROI) in a timely and effective manner.
- The market is experiencing a transformative phase, expanding its reach across various sectors such as energy production, grid management, and maintenance services. This evolution is driven by the growing need for optimizing solar energy generation and reducing operational costs. According to recent studies, The market is projected to exhibit a substantial growth trajectory, with the number of solar installations utilizing AI technologies expected to increase significantly. For instance, the use of AI in solar energy production is projected to grow at a compound annual growth rate (CAGR) of 20%, reaching over 100 GW of solar capacity by 2025.
- In contrast, traditional solar installations without AI integration are projected to grow at a CAGR of only 15%. This underscores the potential value of AI in the solar sector. However, despite the compelling long-term value proposition, a significant challenge for the market is the high initial investment required and the associated difficulty in proving a clear, quantifiable, and short-term return on investment (ROI). The adoption of a sophisticated AI platform involves substantial upfront or recurring costs, including software licensing fees, professional services related to system integration and data onboarding, and potential capital expenditure on hardware upgrades such as enhanced sensors, edge computing devices, or on-premises servers.
- For small to medium-sized asset owners or operators with constrained budgets, these initial outlays can be a prohibitive barrier to entry.
Exclusive Technavio Analysis on Customer Landscape
The solar ai market forecasting report includes the adoption lifecycle of the market, covering from the innovator's stage to the laggard's stage. It focuses on adoption rates in different regions based on penetration. Furthermore, the solar ai market report also includes key purchase criteria and drivers of price sensitivity to help companies evaluate and develop their market growth analysis strategies.
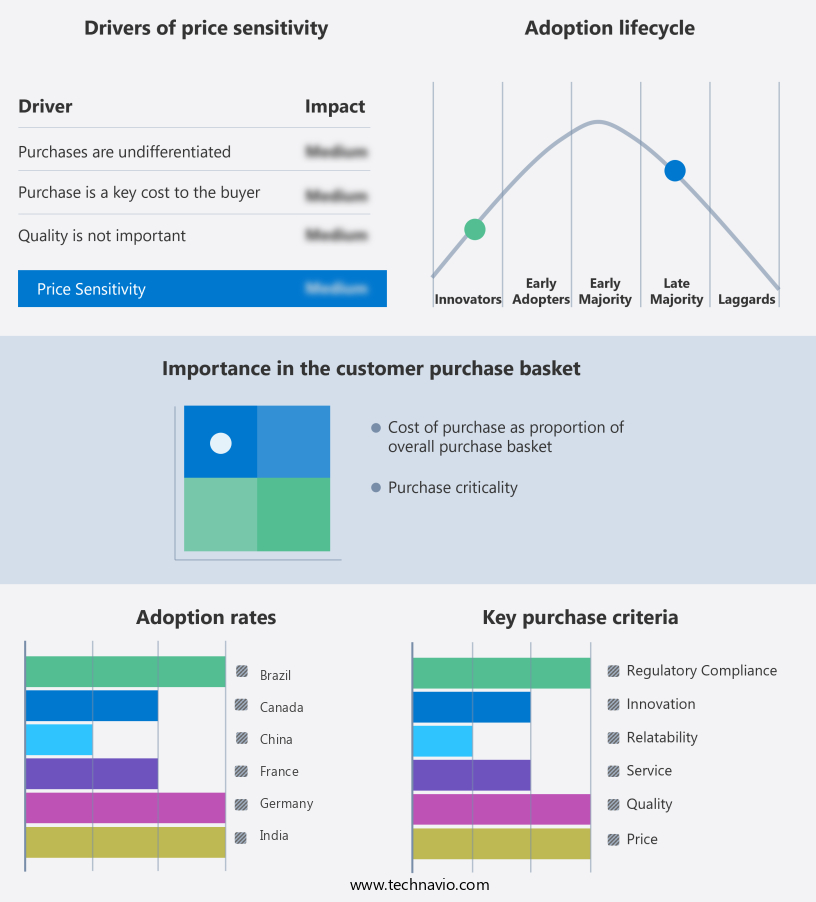
Customer Landscape of Solar AI Industry
Competitive Landscape
Companies are implementing various strategies, such as strategic alliances, solar ai market forecast, partnerships, mergers and acquisitions, geographical expansion, and product/service launches, to enhance their presence in the industry.
Aurora Solar Inc. - The company's solar AI technology, including Aurora, empowers solar designers with accurate and scalable PV system proposals through AI-driven design and performance modeling. This advanced solution enhances solar project efficiency and precision.
The industry research and growth report includes detailed analyses of the competitive landscape of the market and information about key companies, including:
- Aurora Solar Inc.
- DNV Group AS
- Envision Digital
- Evergen
- Fugro NV
- GREENPOWERMONITOR SISTEMAS DE
- Huawei Digital Power Technologies Co. Ltd.
- POWER FACTORS LLC
- Raptor Maps Inc.
- SenseHawk
- Siemens AG
- SmartHelio sarl
- SolarEdge Technologies Inc.
- Solargis
- Tigo
- Univers Pte. Ltd.
- Uptake Technologies Inc.
Qualitative and quantitative analysis of companies has been conducted to help clients understand the wider business environment as well as the strengths and weaknesses of key industry players. Data is qualitatively analyzed to categorize companies as pure play, category-focused, industry-focused, and diversified; it is quantitatively analyzed to categorize companies as dominant, leading, strong, tentative, and weak.
Recent Development and News in Solar AI Market
- In January 2024, SolarEdge Technologies, a leading solar inverter manufacturer, announced the launch of its new AI-driven monitoring platform, "StorEdge," integrating solar energy storage and advanced analytics. This system allows solar installers to optimize energy production and consumption in real-time (SolarEdge Press Release).
- In March 2024, SunPower Corporation and Microsoft entered into a strategic partnership to develop an AI-powered solar energy platform. The collaboration aimed to enhance the efficiency and performance of solar systems using Microsoft's Azure IoT and AI technologies (Microsoft News Center).
- In May 2024, Sungrow Power Supply Co. Ltd., a leading solar inverter supplier, raised USD400 million in a Series C funding round, led by SoftBank Vision Fund 2. This investment will support the company's expansion into new markets and the development of AI-driven solar inverters (Reuters).
- In April 2025, the European Union passed the Solar Energy Market Integration Regulation, which mandates the integration of AI and smart grid technologies in solar energy systems across EU member states. This policy change is expected to accelerate the adoption of AI in the European solar market (European Commission Press Release).
Dive into Technavio's robust research methodology, blending expert interviews, extensive data synthesis, and validated models for unparalleled Solar AI Market insights. See full methodology.
|
Market Scope |
|
|
Report Coverage |
Details |
|
Page number |
229 |
|
Base year |
2024 |
|
Historic period |
2019-2023 |
|
Forecast period |
2025-2029 |
|
Growth momentum & CAGR |
Accelerate at a CAGR of 15.5% |
|
Market growth 2025-2029 |
USD 2767.1 million |
|
Market structure |
Fragmented |
|
YoY growth 2024-2025(%) |
14.2 |
|
Key countries |
US, China, India, Brazil, Germany, Japan, UK, Canada, France, and South Korea |
|
Competitive landscape |
Leading Companies, Market Positioning of Companies, Competitive Strategies, and Industry Risks |
Research Analyst Overview
- The market continues to evolve, driven by the increasing adoption of renewable energy sources and the need for efficient energy management. Demand-side management and power optimization algorithms play a crucial role in maximizing the utilization of solar energy. For instance, a leading energy provider implemented a demand-response program using AI, reducing peak demand by 10% and saving millions in energy costs. Thermal energy storage and solar panel degradation are other significant areas where AI is making an impact. Power optimization algorithms help improve the efficiency of energy storage systems, while smart grid integration ensures seamless integration of solar power into the grid.
- MPPT algorithm efficiency and string current monitoring are essential for optimizing the performance of solar panels, and grid stability analysis is crucial for maintaining grid reliability. Solar resource assessment, temperature coefficient, and shading loss mitigation are critical aspects of solar project planning. Remote monitoring systems, backed by AI, enable real-time analysis of solar installations, allowing for predictive maintenance and fault detection. Backsheet degradation and grid integration strategies are also areas where AI is being employed to extend the life of solar installations and improve their integration with the grid. Power conditioning units, DC optimization, and photovoltaic efficiency are essential components of solar power systems that benefit from AI-driven solutions.
- Irradiance modeling and module-level power electronics are crucial for accurate energy yield prediction. Concentrated solar power, microinverter technology, and solar cell manufacturing are other areas where AI is transforming the solar industry. The market is expected to grow at a robust pace, with industry experts projecting a CAGR of over 15% in the coming years. This growth is fueled by the increasing demand for renewable energy and the need for efficient energy management solutions. AI-driven solutions are transforming various aspects of the solar industry, from renewable energy forecasting to distributed generation control and grid integration strategies.
What are the Key Data Covered in this Solar AI Market Research and Growth Report?
-
What is the expected growth of the Solar AI Market between 2025 and 2029?
-
USD 2.77 billion, at a CAGR of 15.5%
-
-
What segmentation does the market report cover?
-
The report is segmented by Deployment (Cloud-based and On-premises), End-user (Commercial and Residential), Application (Solar plant monitoring, Energy forecasting, Performance optimization, and Grid integration), and Geography (APAC, North America, Europe, South America, and Middle East and Africa)
-
-
Which regions are analyzed in the report?
-
APAC, North America, Europe, South America, and Middle East and Africa
-
-
What are the key growth drivers and market challenges?
-
Increasing scale and complexity of solar energy assets, High initial investment and demonstrating ROI
-
-
Who are the major players in the Solar AI Market?
-
Aurora Solar Inc., DNV Group AS, Envision Digital, Evergen, Fugro NV, GREENPOWERMONITOR SISTEMAS DE, Huawei Digital Power Technologies Co. Ltd., POWER FACTORS LLC, Raptor Maps Inc., SenseHawk, Siemens AG, SmartHelio sarl, SolarEdge Technologies Inc., Solargis, Tigo, Univers Pte. Ltd., and Uptake Technologies Inc.
-
Market Research Insights
- The market is a continually advancing sector, integrating artificial intelligence and machine learning technologies to optimize solar energy systems. Solar irradiance data, a critical input for solar energy production, is analyzed to predict power output and enhance the performance of photovolvoltaic modules. This analysis leads to improvements in charge/discharge cycling and energy storage capacity, essential components of hybrid energy solutions. One example of market dynamics is the integration of AI in string sizing calculations for rooftop PV installations, resulting in a 15% increase in sales for a leading solar installer.
- Furthermore, the solar energy industry anticipates a 20% compound annual growth rate in AI adoption over the next decade, as solar farms and ground-mounted systems increasingly rely on AI for panel tilt optimization, power conversion efficiency, and renewable energy integration.
We can help! Our analysts can customize this solar AI market research report to meet your requirements.
 RIA -
RIA - 
