Solar Panel Coatings Market Size 2024-2028
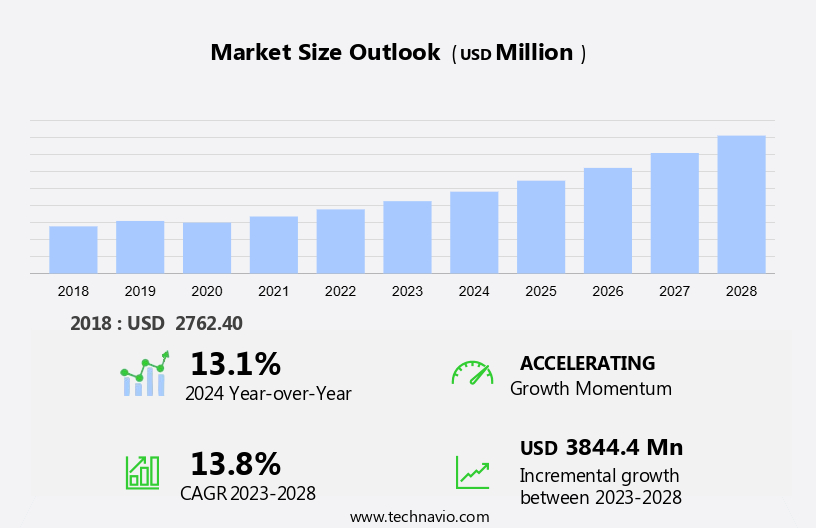
The solar panel coatings market size is forecast to increase by USD 3.84 billion at a CAGR of 13.8% between 2023 and 2028.
- The market is experiencing significant growth due to the increasing demand for solar energy as a renewable power source. Superhydrophilic coatings are gaining popularity for enhancing the efficiency of solar panels by reducing water contamination and improving self-cleaning properties. Photoactive coatings, which possess electrical conductivity and light transparency, are another trend in the market, enabling solar cells to convert a broader spectrum of light into electricity.
- Antireflective properties are crucial for enhancing the absorption of sunlight, making coatings with hybrid functionalities increasingly desirable. Furthermore, the development of underwater coatings for solar cells is a promising trend, expanding the application areas of solar energy. However, durability issues with solar panel coatings remain a challenge, necessitating the development of self-healing and antimicrobial coatings to ensure long-term performance and prevent degradation.
What will be the Size of the Solar Panel Coatings Market During the Forecast Period?
- The use of fossil fuels for energy generation continues to have detrimental effects on the earth's atmosphere, leading to increase in greenhouse gases and environmental concerns. In response, the renewable energy sector, particularly solar energy, has gained significant traction as a viable alternative. Solar panel technology has seen remarkable advancements in recent years, with a primary focus on enhancing solar panel efficiency. Solar panel efficiency is crucial for maximizing energy generation from solar panels.
- However, several factors, such as reflection, dust accumulation, and surface morphology, can negatively impact the performance of solar panels. To address these challenges, the market for solar panel coatings has emerged as a promising solution. Coatings are thin films applied to the surface of solar panels to improve their functionality and durability. Self-cleaning coatings, for instance, help prevent dust accumulation, ensuring optimal energy transmittance and reflection. Anti-reflection coatings reduce reflection, allowing more sunlight to reach the solar cells and thereby increasing energy generation. Moreover, the development of photoactive coatings has been a significant breakthrough in the solar panel coating market. These coatings possess antireflective properties, self-healing capabilities, and hybrid functionalities that include antimicrobial activity. Furthermore, superhydrophobic and superhydrophilic coatings are gaining popularity due to their ability to repel water and enhance the cleaning process, respectively. The air/glass interface is another critical aspect of solar panel performance. Coatings with anti-fogging properties help maintain clear visibility on the solar panels, ensuring optimal energy generation.
How is this market segmented and which is the largest segment?
The market research report provides comprehensive data (region-wise segment analysis), with forecasts and estimates in "USD million" for the period 2024-2028, as well as historical data from 2018-2022 for the following segments.
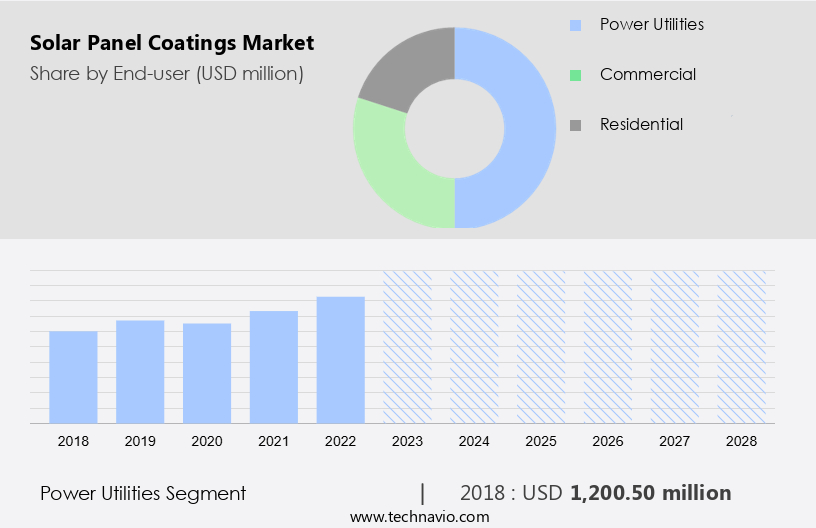
- End-user
- Power utilities
- Commercial
- Residential
- Type
- Anti-reflective
- Hydrophobic
- Self-cleaning
- Anti-soiling
- Others
- Geography
- APAC
- China
- India
- Japan
- Europe
- Germany
- UK
- France
- Italy
- North America
- US
- Middle East and Africa
- South America
- Brazil
- APAC
By End-user Insights
- The power utilities segment is estimated to witness significant growth during the forecast period.
The Market encompasses the production and application of coatings on renewable energy systems, specifically solar panels, to enhance their efficiency and durability. In the United States, the adoption of solar energy is on the rise due to the increasing demand for renewable sources of electricity. Power utilities are a significant end-user segment in this market, given their role in supplying electricity to meet the expanding demand. The US electricity consumption is surging, fueled by the expansion of data centers, manufacturing industries, and the electrification trend.
However, challenges such as delays in project implementation and escalating electricity costs may hinder the sustained growth of the power utilities segment. Solar panel coatings play a crucial role in optimizing the performance of solar panels by reducing the adverse effects of environmental factors like dust, dirt, snow, and ice. These coatings minimize light scattering, ensuring maximum energy absorption. Moreover, they offer protection against extreme weather events, ensuring the longevity of solar panels. The companies specializing in solar panel coatings are capitalizing on this growing market by providing innovative solutions to enhance the efficiency and durability of solar panels, thereby contributing to the nation's renewable energy goals.
Get a glance at the market report of share of various segments Request Free Sample
The power utilities segment was valued at USD 1.20 billion in 2018 and showed a gradual increase during the forecast period.
Regional Analysis
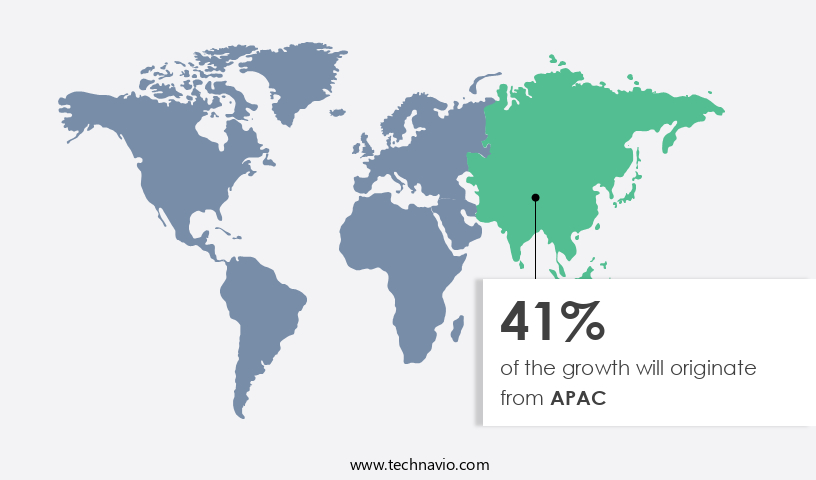
- APAC is estimated to contribute 41% to the growth of the global market during the forecast period.
Technavio's analysts have elaborately explained the regional trends and drivers that shape the market during the forecast period.
For more insights on the market share of various regions Request Free Sample
The market in the APAC region is experiencing significant growth due to substantial investments and government initiatives aimed at expanding renewable energy capacity. In India, for instance, the PM Suryaghar Yojana program, launched in February 2024 by Prime Minister Narendra Modi, has successfully installed over 400,000 rooftop solar connections. The Indian government's focus on rapid implementation of renewable energy projects is evident, despite challenges such as high transportation costs for solar panels in certain states. Solar panel coatings play a crucial role in maintaining solar efficiency by reducing snow accumulation depth and ensuring effective cleaning schedules. Snow microstructure and wind velocity are critical factors affecting solar cell maintenance. Ensuring the coatings are effective in these conditions is essential to maximizing the return on investment for solar projects.
Market Dynamics
Our researchers analyzed the data with 2023 as the base year, along with the key drivers, trends, and challenges. A holistic analysis of drivers will help companies refine their marketing strategies to gain a competitive advantage.
What are the key market drivers leading to the rise in adoption of Solar Panel Coatings Market?
Increasing demand for solar energy is the key driver of the market.
- The market is witnessing notable expansion due to the escalating demand for renewable energy sources in the face of the detrimental effects of fossil fuels on the Earth's atmosphere. In 2023, global renewable energy capacity additions saw a remarkable increase of around 50%, reaching approximately 510 gigawatts (GW), marking the fastest growth rate in the last two decades. This rise in renewable energy capacity is particularly prominent in regions such as Europe, the US, and Brazil, where record-breaking highs were attained. China's contribution to this trend is significant, with the country adding an impressive amount of solar photovoltaic (PV) capacity in 2023.
- Furthermore, Chinese wind energy capacity grew by an impressive 66% year-on-year in 2023, underscoring its rapid advancement in the adoption of green energy technologies. The shift towards solar energy generation is crucial in mitigating the negative impacts of fossil fuels, including the production of acid rain. By enhancing solar panel efficiency through coatings, energy companies can optimize energy production and reduce their carbon footprint. Thus, such factors are driving the growth of the market during the forecast period.
What are the market trends shaping the Solar Panel Coatings Market?
The development of underwater coatings for solar cells is the upcoming trend in the market.
- The market is experiencing notable growth due to the innovation of superhydrophilic underwater coatings for solar cells. Funded by the US Navy, these advanced coatings incorporate minute quantities of seawater-soluble pigments and a biocide to generate a permeable layer, enabling seawater penetration. This development tackles the problem of biofouling, where underwater solar cells get obstructed by marine growths like algae and barnacles, leading to decreased efficiency and elevated maintenance expenses.
- Moreover, the groundbreaking coating maintains light transparency, ensuring the necessary passage of visible light for solar cells to function optimally, while effectively preventing biofouling. Photoactive and antimicrobial properties are integrated into these hybrid functionalities, contributing to the self-healing and antimicrobial activity of the coating. By addressing biofouling, these solar panel coatings significantly enhance the efficiency and durability of underwater solar energy systems. Thus, such Solar Panel Coatings Market trends will shape the growth of the market during the forecast period.
What challenges does Solar Panel Coatings Market face during the growth?
Durability issues with solar panel coatings is a key challenge affecting the market growth.
- The market encounters substantial challenges with the longevity of coatings, primarily due to environmental stressors. A significant concern involves the effects of ultraviolet (UV) radiation and damp heat (DH) on hydrophobic coatings. Over an extended duration, these conditions can result in alterations to the coatings' surface morphology. Hydrophobic coatings, particularly those based on silane and applied via techniques such as dip-coating and spray-coating, undergo noticeable morphological transformations upon UV exposure. After approximately 600 hours, characteristic features akin to blisters emerge on the coatings' surface.
- In addressing these concerns, self-cleaning, anti-reflection, anti-fogging, and superhydrophobic coatings have gained traction. These advanced coatings offer enhanced energy transmittance and improved resistance to environmental conditions. By integrating these coatings into solar panels, manufacturers aim to mitigate the impact of UV radiation and damp heat, thereby ensuring the durability and efficiency of their products. Hence, the above factors will impede the growth of the market during the forecast period.
Exclusive Customer Landscape
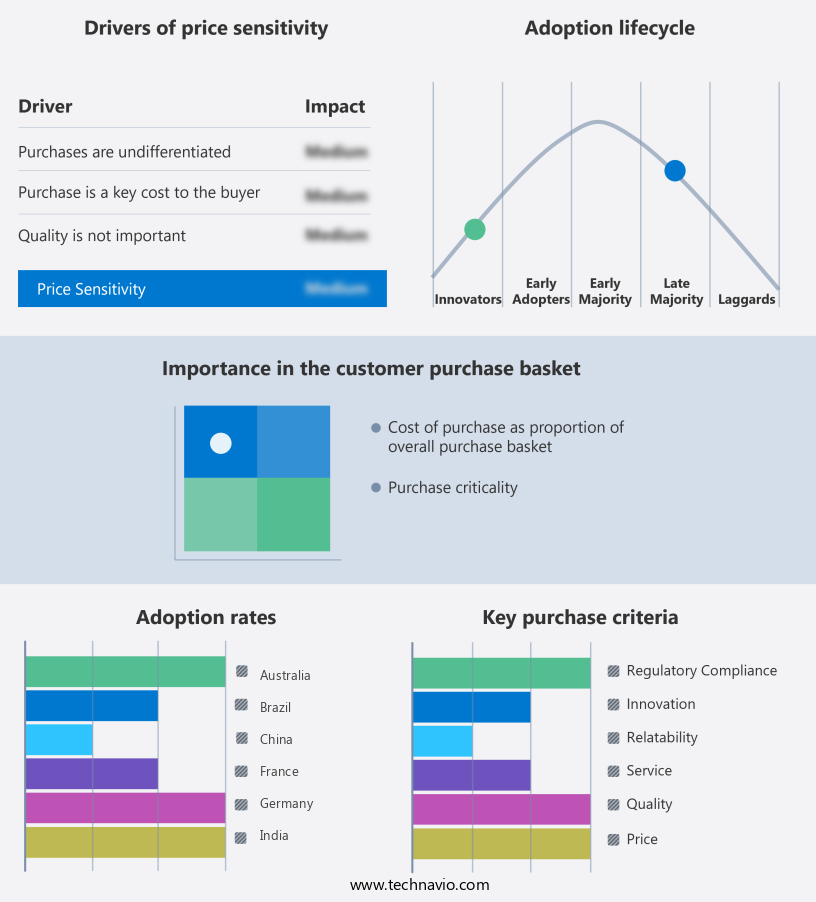
The market forecasting report includes the adoption lifecycle of the market, covering from the innovator's stage to the laggard's stage. It focuses on adoption rates in different regions based on penetration. Furthermore, the market report also includes key purchase criteria and drivers of price sensitivity to help companies evaluate and develop their market growth analysis strategies.
Customer Landscape
Key Companies & Market Insights
Companies are implementing various strategies, such as strategic alliances, market forecast, partnerships, mergers and acquisitions, geographical expansion, and product/service launches, to enhance their presence in the market.
The market research and growth report includes detailed analyses of the competitive landscape of the market and information about key companies, including:
- 3M India Ltd.
- Advanced Nanotech Lab
- Arkema
- Balconano
- Chemitek
- Compagnie de Saint-Gobain SA
- Covestro AG
- Diamon Fusion International Inc.
- DSM-Firmenich AG
- Element 119
- FENZI Spa
- Leybold GmbH
- Nanomason Inc.
- nanopool GmbH
- PPG Industries Inc.
- Sinovoltaics Group Ltd.
- Soilar Technologies
- UNELKO CORP.
Qualitative and quantitative analysis of companies has been conducted to help clients understand the wider business environment as well as the strengths and weaknesses of key market players. Data is qualitatively analyzed to categorize companies as pure play, category-focused, industry-focused, and diversified; it is quantitatively analyzed to categorize companies as dominant, leading, strong, tentative, and weak.
Research Analyst Overview
Solar panel coatings have gained significant attention in recent years due to the detrimental effects of fossil fuels on the Earth's atmosphere. Renewable energy and green energy technologies have emerged as viable alternatives, and solar energy, in particular, has shown promising potential. Solar panel efficiency is a crucial factor in energy generation, and reflection, dust accumulation, and surface morphology are key challenges. Thin films and coatings have been developed to enhance solar panel performance. Self-cleaning and anti-reflection coatings help maintain optimal energy transmittance by reducing dust, dirt, snow, and ice accumulation. Superhydrophobic and superhydrophilic coatings offer unique optical and thermal properties, improving reflectivity, absorption, and transmission. Photoactive coatings, with antireflective properties and hybrid functionalities, offer self-healing, antimicrobial activity, and adaptability to extreme weather events.
Furthermore, hydrophilic and hydrophobic coatings have been employed to mitigate snow accumulation and improve cleaning schedules. Nano-sized and micro-sized particles are used to modify surface wettability and enhance solar efficiency. The particle size, solar radiation, and power production capabilities of solar panels are influenced by various factors, including snow microstructure, snow accumulation depth, wind velocity, and soil constituents. Effective solar cell maintenance is essential to ensure optimal performance and longevity. These advancements in solar panel coatings contribute significantly to the growing solar energy market and the transition towards renewable sources.
|
Market Scope |
|
|
Report Coverage |
Details |
|
Page number |
210 |
|
Base year |
2023 |
|
Historic period |
2018-2022 |
|
Forecast period |
2024-2028 |
|
Growth momentum & CAGR |
Accelerate at a CAGR of 13.8% |
|
Market Growth 2024-2028 |
USD 3.84 billion |
|
Market structure |
Fragmented |
|
YoY growth 2023-2024(%) |
13.1 |
|
Key countries |
China, US, Germany, Japan, UK, Australia, India, France, Italy, and Brazil |
|
Competitive landscape |
Leading Companies, Market Positioning of Companies, Competitive Strategies, and Industry Risks |
What are the Key Data Covered in this Market Research and Growth Report?
- CAGR of the market during the forecast period
- Detailed information on factors that will drive the market growth and forecasting between 2024 and 2028
- Precise estimation of the size of the market and its contribution of the market in focus to the parent market
- Accurate predictions about upcoming market growth and trends and changes in consumer behaviour
- Growth of the market across APAC, Europe, North America, Middle East and Africa, and South America
- Thorough analysis of the market's competitive landscape and detailed information about companies
- Comprehensive analysis of factors that will challenge the growth of market companies
We can help! Our analysts can customize this market research report to meet your requirements. Get in touch
 RIA -
RIA - 
