Spatial Computing Market Analysis North America, APAC, Europe, Middle East and Africa, South America - US, China, Japan, Germany, UK - Size and Forecast 2024-2028

Spatial Computing Market Analysis North America, APAC, Europe, Middle East and Africa, South America - US, China, Japan, Germany, UK - Size and Forecast 2024-2028

Published: Mar 2024 171 Pages SKU: IRTNTR77821

Market Overview at a Glance

$259.9 B
Market Opportunity
27.72%
CAGR
26.93
YoY growth 2023-2024(%)

Spatial Computing Market Size 2024-2028

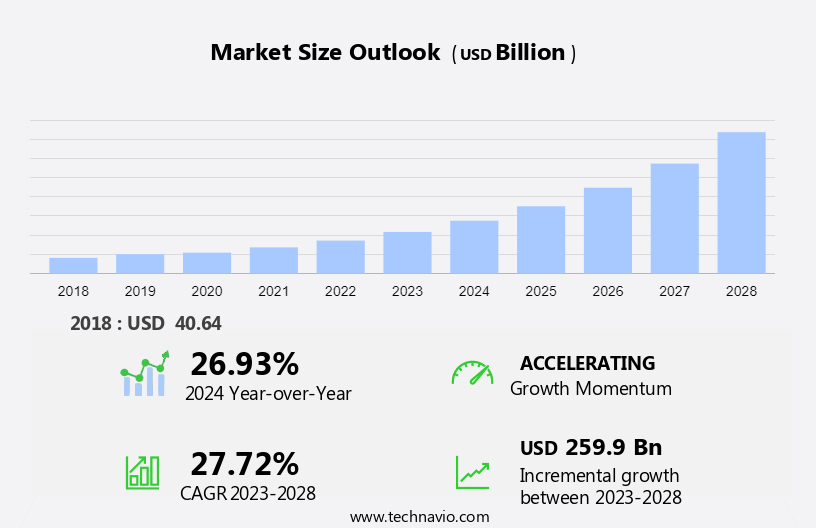
The spatial computing market size is forecast to increase by USD 259.9 billion at a CAGR of 27.72% between 2023 and 2028.

  • The market is experiencing significant growth due to the increasing demand for augmented reality (AR) and virtual reality (VR) technology. This trend is driven by advancements in spatial computing technology, which enables the creation of great experiences in various industries such as gaming, education, healthcare, and manufacturing. However, the market faces challenges related to privacy concerns over the use of spatial computing technology. As users become more conscious of their digital footprint, companies must address these concerns by implementing strong security measures and transparent data handling practices. In addition, continued advancements in technology are expected to drive innovation and expand the applications of spatial computing, making it an exciting area to watch In the coming years.

What will be the Size of the Spatial Computing Market During the Forecast Period?

Spatial Computing Market Size

 Request Free Sample

  • In the contemporary landscape of healthcare, technological advancements have revolutionized the way medical practitioners engage with patients. Modern healthcare organizations are increasingly adopting spatial computing technologies, such as augmented reality (AR), virtual reality (VR), and mixed reality (MR), to enhance doctor-patient interaction and improve overall healthcare experiences. Doctors and medical practitioners are leveraging these technologies to provide virtual wellness services, offering fitness and mental health assessments and treatments in a more accessible manner. Patients, in turn, benefit from the convenience and personalized care these solutions provide. HMDs (Head-Mounted Displays), VR devices, mobile phones, tablets, and computers are some of the devices driving this market's growth.
  • Legacy hardware is being replaced with these advanced technologies, enabling more efficient and effective doctor-patient communication and consultation. The driving forces behind this trend include the investment and funding in technological advancements, the retail sector's integration of spatial computing for customer experiences, and the training and simulation opportunities these technologies offer. In the realm of healthcare, spatial computing is transforming the way we approach wellness, providing new business opportunities and enhancing the patient experience. Spatial computing technologies, including AR, VR, and MR, are revolutionizing the way medical practitioners engage with patients. From virtual wellness services to doctor-patient consultations, these technologies are transforming the healthcare landscape.

How is this Spatial Computing Industry segmented and which is the largest segment?

The industry research report provides comprehensive data (region-wise segment analysis), with forecasts and estimates in "USD billion" for the period 2024-2028, as well as historical data from 2018-2022 for the following segments.
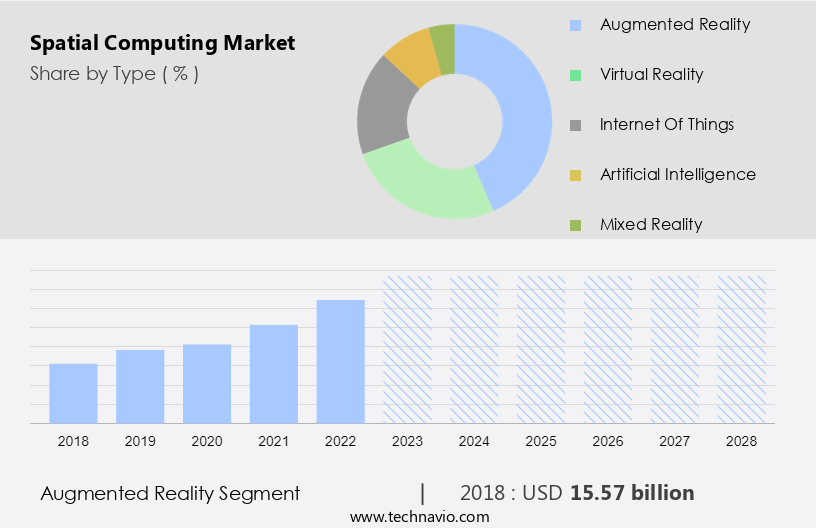
  • Type
    • Augmented reality
    • Virtual reality
    • Internet of Things
    • Artificial intelligence
    • Mixed reality
  • Solution
    • Hardware
    • Software
    • Services
  • Geography
    • North America
      • US
    • APAC
      • China
      • Japan
    • Europe
      • Germany
      • UK
    • Middle East and Africa
    • South America

By Type Insights

  • The augmented reality segment is estimated to witness significant growth during the forecast period.

The market, specifically the Augmented Reality (AR) segment, is experiencing significant growth due to increasing adoption in various industries. AR technology enhances the real world by digitally overlaying information, enabling more efficient and interactive enterprise operations. Factors contributing to this growth include new product launches, expanding applications in healthcare, design and engineering, remote collaboration, training, and education, and increasing investment and funding in AR technology.

AR can be delivered through apps or web-based platforms and is increasingly integrated into industries such as healthcare for medical visualization, design and engineering for prototyping, and car technology for head-up Displays. Technological advancements in AR hardware and software, as well as the integration of AR with platforms like Unity for ads, mediation, and in-app bidding, further fuel market growth. The market is expected to continue expanding during the forecast period, offering opportunities for developers and businesses alike.

Spatial Computing Market Size

Get a glance at the Industry report of share of various segments Request Free Sample

The augmented reality segment was valued at USD 15.57 billion in 2018 and showed a gradual increase during the forecast period.

Regional Analysis

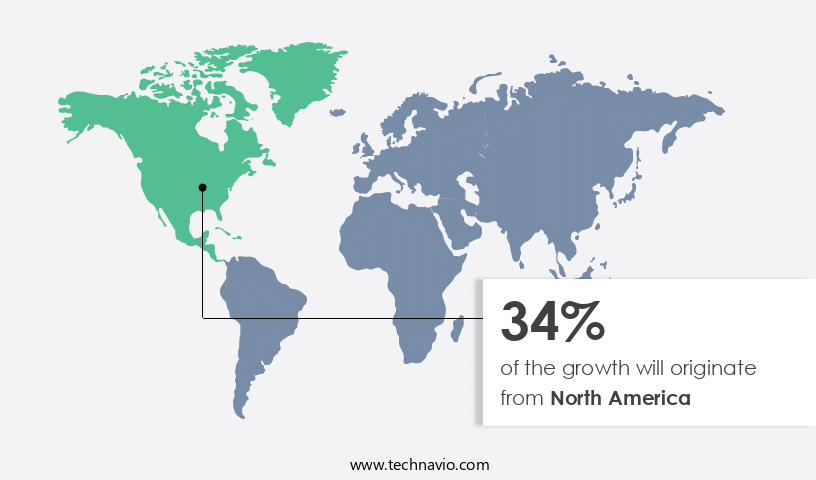
  • North America is estimated to contribute 34% to the growth of the global market during the forecast period.

Technavio's analysts have elaborately explained the regional trends and drivers that shape the market during the forecast period.

Spatial Computing Market Share by Geography

For more insights on the market share of various regions, Request Free Sample

The North American region dominates The market, accounting for the largest share in 2023. Key factors driving this growth include the presence of major companies, increasing investments in spatial technology, and the rising adoption of advanced applications by consumers. Notable contributors to the market in this region are the US and Canada. The presence of prominent companies is expected to further propel market expansion. The application of spatial technology in modern healthcare organizations, including virtual wellness, fitness, mental health, and doctor-patient interaction, is a significant growth area. Spatial computing is revolutionizing industries by integrating HMDs, legacy hardware, mobile phones, tablets, computers, VR devices, and AR/VR/MR technologies.

Market Dynamics

Our researchers analyzed the data with 2023 as the base year, along with the key drivers, trends, and challenges. A holistic analysis of drivers will help companies refine their marketing strategies to gain a competitive advantage.

What are the key market drivers leading to the rise In the adoption of Spatial Computing Industry?

Growing demand for AR and VR technology is the key driver of the market.

  • The market, encompassing augmented reality (AR) and virtual reality (VR) technologies, is experiencing significant growth due to increasing consumer adoption. Modern healthcare organizations and medical practitioners are integrating these technologies for virtual wellness, mental health, doctor-patient interaction, and training. Doctors use VR devices, such as HMDs, to simulate complex medical procedures, while AR glasses offer real-time patient data during surgeries. Economic downturns and consumers' discretionary spending have not hindered the market's growth, as investments in startups and funding for technological development continue. AR and VR applications, including remote work, education, and entertainment, are driving user immersion and presence. The convergence of AR, VR, and MR technologies, along with hardware capabilities, operating systems, and the development landscape, is optimized for consistent, high-quality experiences.
  • The aerospace & defense sector, automotive industry, and consumer privacy concerns are among the market's driving forces. Technological advancements in real-time rendering technology, AI/ML solutions deployment, and software handling will further fuel the market's growth during the forecast period. The healthcare end-use segment, including medical visualization, design and engineering, and remote collaboration, is expected to dominate the market.

What are the market trends shaping the Spatial Computing Industry?

Rising technological advancements in spatial computing is the upcoming market trend.

  • Spatial computing technology, which includes virtual reality (VR), augmented reality (AR), and mixed reality (MR) devices, is experiencing significant growth due to the integration of egocentric sensing and spatial computation. This technology is revolutionizing various industries, including healthcare, automotive, and aerospace, by providing great experiences and enhancing human-robot collaboration. In modern healthcare organizations, spatial computing is being used for medical visualization, surgical training, patient examination, and medical interventions. Doctors and medical practitioners are utilizing VR headsets, AR glasses, and other spatial computing devices to provide virtual wellness services, improve doctor-patient interaction, and offer remote consultation. The economic downturns caused by the pandemic have led to increased discretionary spending on consumer technologies, driving investments in spatial computing startups and funding for technological development.
  • The convergence of AR, VR, and MR technologies with real-time rendering technology, AI/ML solutions, and cloud computing is creating new opportunities for software handling, onboarding, and training. The automotive industry is using spatial computing for car technology market applications, such as Head-up Displays, and In the aerospace sector for simulating applications, and virtual representation of aircraft, satellite, and semiconductor subsystems. The development landscape for spatial computing is optimizing hardware capabilities, operating systems, and user interfaces for consistent, high-quality experiences. The technological advancements in spatial computing are also impacting retail, education, and remote work, with the use of motion controllers, wearable devices, and smartwatches for biometric data tracking and fitness training.

What challenges does the Spatial Computing Industry face during its growth?

Privacy concerns over spatial computing technology is a key challenge affecting the industry growth.

  • The market, driven by technologies such as augmented reality (AR), virtual reality (VR), and mixed reality (MR), is transforming various industries, including healthcare. Modern healthcare organizations and medical practitioners are increasingly adopting spatial computing to enhance doctor-patient interaction, virtual wellness, fitness, and mental health applications. HMDs, such as AR glasses and VR headsets, along with legacy hardware like mobile phones, tablets, computers, and VR devices, are key hardware components in this market. AR and VR applications offer user immersion, presence, and real-time rendering technology, driving innovation in medical visualization, design and engineering, prototypes, remote collaboration, training, and education. Spatial computing is also making strides In the aerospace & defense sector for simulating applications, and virtual representation of aircraft, satellites, and other larger systems for prototyping, inspection, malfunctions, safety, and weapon training.
  • However, privacy concerns arise due to the vast amounts of sensitive user data collected by AR devices, including biometric data and social networking account information. Consumer privacy, cloud computing, blockchain, and AI/ML solutions are essential to mitigate these concerns. Economic downturns, discretionary spending, and technological advancements influence investments in startups and funding in this market. The development landscape includes hardware capabilities, operating systems, optimization, compatibility testing, customization, and technical intricacies. User interfaces and interaction methods must deliver consistent, high-quality experiences. AR/VR applications use 3D objects, images, video, and textual data, requiring content creation tools, game engines, and authoring platforms.

Exclusive Customer Landscape

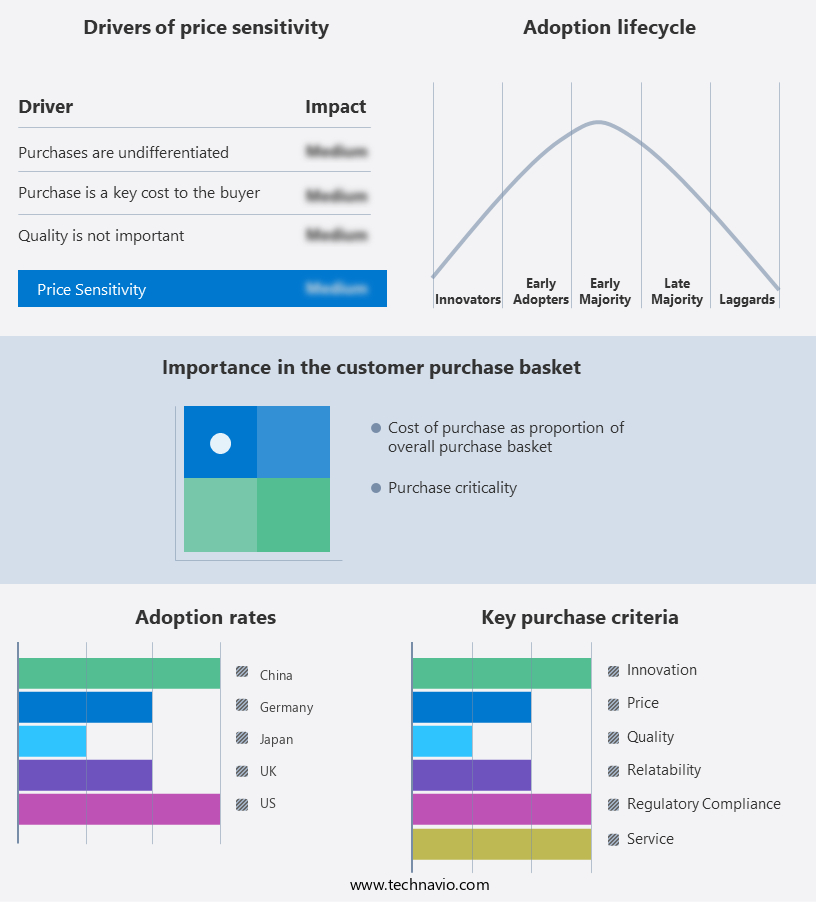
The market forecasting report includes the adoption lifecycle of the market, covering from the innovator's stage to the laggard's stage. It focuses on adoption rates in different regions based on penetration. Furthermore, the market report also includes key purchase criteria and drivers of price sensitivity to help companies evaluate and develop their market growth analysis strategies.

Spatial Computing Market Share by Geography

 Customer Landscape

Key Companies & Market Insights

Companies are implementing various strategies, such as strategic alliances, market forecast, partnerships, mergers and acquisitions, geographical expansion, and product/service launches, to enhance their presence In the industry.

The industry research and growth report includes detailed analyses of the competitive landscape of the market and information about key companies, including:

  • Apple Inc.
  • Augtual Reality Pvt Ltd.
  • Blippar Ltd.
  • HTC Corp.
  • Lenovo Group Ltd.
  • Magic Leap Inc.
  • Meta Platforms Inc.
  • Microsoft Corp.
  • NexTech AR Solutions Corp.
  • Nimo Planet Inc.
  • NVIDIA Corp.
  • PlugXR Reality Pvt. Ltd.
  • PTC Inc.
  • Rokid.
  • Samsung Electronics Co. Ltd.
  • Seiko Epson Corp.
  • Unity Software Inc.
  • Weald Creative Ltd 
  • Qualcomm Inc.
  • Sony Group Corp.

Qualitative and quantitative analysis of companies has been conducted to help clients understand the wider business environment as well as the strengths and weaknesses of key industry players. Data is qualitatively analyzed to categorize companies as pure play, category-focused, industry-focused, and diversified; it is quantitatively analyzed to categorize companies as dominant, leading, strong, tentative, and weak.

Research Analyst Overview

Spatial computing, a revolutionary technology encompassing Augmented Reality (AR), Virtual Reality (VR), and Mixed Reality (MR), is transforming various industries by delivering great experiences and enhancing user interaction. This technology is poised to redefine the way we perceive and engage with digital content, from healthcare to education, entertainment, and beyond. In modern healthcare organizations, spatial computing is revolutionizing doctor-patient interaction. Medical practitioners are utilizing AR and VR to provide virtual wellness services, enabling patients to access fitness programs, mental health resources, and consultations from the comfort of their homes.

Moreover, these technologies offer an unparalleled level of user immersion, allowing for more effective and engaging healthcare experiences. The driving forces behind the market are numerous. Economic downturns have led consumers to focus on discretionary spending, making cost-effective and accessible technologies like AR and VR increasingly popular. Investments in startups and funding for technology development have also been on the rise, fueling innovation and growth In the sector. The gaming and entertainment industries have been early adopters of spatial computing, with VR headsets and AR glasses offering great experiences for consumers. However, the technology's potential extends far beyond entertainment.

Furthermore, in remote work environments, spatial computing enables real-time collaboration and training, allowing teams to work together seamlessly from anywhere In the world. Government stimulus packages and technological advancements have further accelerated the adoption of spatial computing. Real-time rendering technology and AR/VR applications have found applications in various sectors, including aerospace & defense, where they are used for simulating applications, virtual representation, and training. The development landscape for spatial computing is diverse and complex. Optimization, compatibility testing, and customization are essential considerations for hardware capabilities, operating systems, and user interfaces. Interaction methods and user experiences must be consistent and high-quality to ensure a seamless and engaging experience for users.

Market Scope

Report Coverage

Details

Page number

171

Base year

2023

Historic period

2018-2022

Forecast period

2024-2028

Growth momentum & CAGR

Accelerate at a CAGR of 27.72%

Market Growth 2024-2028

USD 259.9 billion

Market structure

Fragmented

YoY growth 2023-2024(%)

26.93

Key countries

US, China, Japan, Germany, and UK

Competitive landscape

Leading Companies, Market Positioning of Companies, Competitive Strategies, and Industry Risks

Request Free Sample

What are the Key Data Covered in this Market Research and Growth Report?

  • CAGR of the industry during the forecast period
  • Detailed information on factors that will drive the market growth and forecasting between 2024 and 2028
  • Precise estimation of the size of the market and its contribution of the industry in focus to the parent market
  • Accurate predictions about upcoming growth and trends and changes in consumer behaviour
  • Growth of the market across North America, APAC, Europe, Middle East and Africa, and South America
  • Thorough analysis of the market's competitive landscape and detailed information about companies
  • Comprehensive analysis of factors that will challenge the market growth of industry companies

We can help! Our analysts can customize this market research report to meet your requirements.

Get in touch

1 Executive Summary

  • 1.1 Market overview
    • Exhibit 01: Executive Summary – Chart on Market Overview
    • Exhibit 02: Executive Summary – Data Table on Market Overview
    • Exhibit 03: Executive Summary – Chart on Global Market Characteristics
    • Exhibit 04: Executive Summary – Chart on Market by Geography
    • Exhibit 05: Executive Summary – Chart on Market Segmentation by Type
    • Exhibit 06: Executive Summary – Chart on Market Segmentation by Solution
    • Exhibit 07: Executive Summary – Chart on Incremental Growth
    • Exhibit 08: Executive Summary – Data Table on Incremental Growth
    • Exhibit 09: Executive Summary – Chart on Vendor Market Positioning

2 Market Landscape

  • 2.1 Market ecosystem
    • Exhibit 10: Parent market
    • Exhibit 11: Market Characteristics

3 Market Sizing

  • 3.1 Market definition
    • Exhibit 12: Offerings of vendors included in the market definition
  • 3.2 Market segment analysis
    • Exhibit 13: Market segments
  • 3.3 Market size 2023
    • 3.4 Market outlook: Forecast for 2023-2028
      • Exhibit 14: Chart on Global - Market size and forecast 2023-2028 ($ billion)
      • Exhibit 15: Data Table on Global - Market size and forecast 2023-2028 ($ billion)
      • Exhibit 16: Chart on Global Market: Year-over-year growth 2023-2028 (%)
      • Exhibit 17: Data Table on Global Market: Year-over-year growth 2023-2028 (%)

    4 Historic Market Size

    • 4.1 Global spatial computing market 2018 - 2022
      • Exhibit 18: Historic Market Size – Data Table on global spatial computing market 2018 - 2022 ($ billion)
    • 4.2 Type Segment Analysis 2018 - 2022
      • Exhibit 19: Historic Market Size – Type Segment 2018 - 2022 ($ billion)
    • 4.3 Solution Segment Analysis 2018 - 2022
      • Exhibit 20: Historic Market Size – Solution Segment 2018 - 2022 ($ billion)
    • 4.4 Geography Segment Analysis 2018 - 2022
      • Exhibit 21: Historic Market Size – Geography Segment 2018 - 2022 ($ billion)
    • 4.5 Country Segment Analysis 2018 - 2022
      • Exhibit 22: Historic Market Size – Country Segment 2018 - 2022 ($ billion)

    5 Five Forces Analysis

    • 5.1 Five forces summary
      • Exhibit 23: Five forces analysis - Comparison between 2023 and 2028
    • 5.2 Bargaining power of buyers
      • Exhibit 24: Chart on Bargaining power of buyers – Impact of key factors 2023 and 2028
    • 5.3 Bargaining power of suppliers
      • Exhibit 25: Bargaining power of suppliers – Impact of key factors in 2023 and 2028
    • 5.4 Threat of new entrants
      • Exhibit 26: Threat of new entrants – Impact of key factors in 2023 and 2028
    • 5.5 Threat of substitutes
      • Exhibit 27: Threat of substitutes – Impact of key factors in 2023 and 2028
    • 5.6 Threat of rivalry
      • Exhibit 28: Threat of rivalry – Impact of key factors in 2023 and 2028
    • 5.7 Market condition
      • Exhibit 29: Chart on Market condition - Five forces 2023 and 2028

    6 Market Segmentation by Type

    • 6.1 Market segments
      • Exhibit 30: Chart on Type - Market share 2023-2028 (%)
      • Exhibit 31: Data Table on Type - Market share 2023-2028 (%)
    • 6.2 Comparison by Type
      • Exhibit 32: Chart on Comparison by Type
      • Exhibit 33: Data Table on Comparison by Type
    • 6.3 Augmented reality - Market size and forecast 2023-2028
      • Exhibit 34: Chart on Augmented reality - Market size and forecast 2023-2028 ($ billion)
      • Exhibit 35: Data Table on Augmented reality - Market size and forecast 2023-2028 ($ billion)
      • Exhibit 36: Chart on Augmented reality - Year-over-year growth 2023-2028 (%)
      • Exhibit 37: Data Table on Augmented reality - Year-over-year growth 2023-2028 (%)
    • 6.4 Virtual reality - Market size and forecast 2023-2028
      • Exhibit 38: Chart on Virtual reality - Market size and forecast 2023-2028 ($ billion)
      • Exhibit 39: Data Table on Virtual reality - Market size and forecast 2023-2028 ($ billion)
      • Exhibit 40: Chart on Virtual reality - Year-over-year growth 2023-2028 (%)
      • Exhibit 41: Data Table on Virtual reality - Year-over-year growth 2023-2028 (%)
    • 6.5 Internet of Things - Market size and forecast 2023-2028
      • Exhibit 42: Chart on Internet of Things - Market size and forecast 2023-2028 ($ billion)
      • Exhibit 43: Data Table on Internet of Things - Market size and forecast 2023-2028 ($ billion)
      • Exhibit 44: Chart on Internet of Things - Year-over-year growth 2023-2028 (%)
      • Exhibit 45: Data Table on Internet of Things - Year-over-year growth 2023-2028 (%)
    • 6.6 Artificial intelligence - Market size and forecast 2023-2028
      • Exhibit 46: Chart on Artificial intelligence - Market size and forecast 2023-2028 ($ billion)
      • Exhibit 47: Data Table on Artificial intelligence - Market size and forecast 2023-2028 ($ billion)
      • Exhibit 48: Chart on Artificial intelligence - Year-over-year growth 2023-2028 (%)
      • Exhibit 49: Data Table on Artificial intelligence - Year-over-year growth 2023-2028 (%)
    • 6.7 Mixed reality - Market size and forecast 2023-2028
      • Exhibit 50: Chart on Mixed reality - Market size and forecast 2023-2028 ($ billion)
      • Exhibit 51: Data Table on Mixed reality - Market size and forecast 2023-2028 ($ billion)
      • Exhibit 52: Chart on Mixed reality - Year-over-year growth 2023-2028 (%)
      • Exhibit 53: Data Table on Mixed reality - Year-over-year growth 2023-2028 (%)
    • 6.8 Market opportunity by Type
      • Exhibit 54: Market opportunity by Type ($ billion)
      • Exhibit 55: Data Table on Market opportunity by Type ($ billion)

    7 Market Segmentation by Solution

    • 7.1 Market segments
      • Exhibit 56: Chart on Solution - Market share 2023-2028 (%)
      • Exhibit 57: Data Table on Solution - Market share 2023-2028 (%)
    • 7.2 Comparison by Solution
      • Exhibit 58: Chart on Comparison by Solution
      • Exhibit 59: Data Table on Comparison by Solution
    • 7.3 Hardware - Market size and forecast 2023-2028
      • Exhibit 60: Chart on Hardware - Market size and forecast 2023-2028 ($ billion)
      • Exhibit 61: Data Table on Hardware - Market size and forecast 2023-2028 ($ billion)
      • Exhibit 62: Chart on Hardware - Year-over-year growth 2023-2028 (%)
      • Exhibit 63: Data Table on Hardware - Year-over-year growth 2023-2028 (%)
    • 7.4 Software - Market size and forecast 2023-2028
      • Exhibit 64: Chart on Software - Market size and forecast 2023-2028 ($ billion)
      • Exhibit 65: Data Table on Software - Market size and forecast 2023-2028 ($ billion)
      • Exhibit 66: Chart on Software - Year-over-year growth 2023-2028 (%)
      • Exhibit 67: Data Table on Software - Year-over-year growth 2023-2028 (%)
    • 7.5 Services - Market size and forecast 2023-2028
      • Exhibit 68: Chart on Services - Market size and forecast 2023-2028 ($ billion)
      • Exhibit 69: Data Table on Services - Market size and forecast 2023-2028 ($ billion)
      • Exhibit 70: Chart on Services - Year-over-year growth 2023-2028 (%)
      • Exhibit 71: Data Table on Services - Year-over-year growth 2023-2028 (%)
    • 7.6 Market opportunity by Solution
      • Exhibit 72: Market opportunity by Solution ($ billion)
      • Exhibit 73: Data Table on Market opportunity by Solution ($ billion)

    8 Customer Landscape

    • 8.1 Customer landscape overview
      • Exhibit 74: Analysis of price sensitivity, lifecycle, customer purchase basket, adoption rates, and purchase criteria

    9 Geographic Landscape

    • 9.1 Geographic segmentation
      • Exhibit 75: Chart on Market share by geography 2023-2028 (%)
      • Exhibit 76: Data Table on Market share by geography 2023-2028 (%)
    • 9.2 Geographic comparison
      • Exhibit 77: Chart on Geographic comparison
      • Exhibit 78: Data Table on Geographic comparison
    • 9.3 North America - Market size and forecast 2023-2028
      • Exhibit 79: Chart on North America - Market size and forecast 2023-2028 ($ billion)
      • Exhibit 80: Data Table on North America - Market size and forecast 2023-2028 ($ billion)
      • Exhibit 81: Chart on North America - Year-over-year growth 2023-2028 (%)
      • Exhibit 82: Data Table on North America - Year-over-year growth 2023-2028 (%)
    • 9.4 APAC - Market size and forecast 2023-2028
      • Exhibit 83: Chart on APAC - Market size and forecast 2023-2028 ($ billion)
      • Exhibit 84: Data Table on APAC - Market size and forecast 2023-2028 ($ billion)
      • Exhibit 85: Chart on APAC - Year-over-year growth 2023-2028 (%)
      • Exhibit 86: Data Table on APAC - Year-over-year growth 2023-2028 (%)
    • 9.5 Europe - Market size and forecast 2023-2028
      • Exhibit 87: Chart on Europe - Market size and forecast 2023-2028 ($ billion)
      • Exhibit 88: Data Table on Europe - Market size and forecast 2023-2028 ($ billion)
      • Exhibit 89: Chart on Europe - Year-over-year growth 2023-2028 (%)
      • Exhibit 90: Data Table on Europe - Year-over-year growth 2023-2028 (%)
    • 9.6 Middle East and Africa - Market size and forecast 2023-2028
      • Exhibit 91: Chart on Middle East and Africa - Market size and forecast 2023-2028 ($ billion)
      • Exhibit 92: Data Table on Middle East and Africa - Market size and forecast 2023-2028 ($ billion)
      • Exhibit 93: Chart on Middle East and Africa - Year-over-year growth 2023-2028 (%)
      • Exhibit 94: Data Table on Middle East and Africa - Year-over-year growth 2023-2028 (%)
    • 9.7 South America - Market size and forecast 2023-2028
      • Exhibit 95: Chart on South America - Market size and forecast 2023-2028 ($ billion)
      • Exhibit 96: Data Table on South America - Market size and forecast 2023-2028 ($ billion)
      • Exhibit 97: Chart on South America - Year-over-year growth 2023-2028 (%)
      • Exhibit 98: Data Table on South America - Year-over-year growth 2023-2028 (%)
    • 9.8 US - Market size and forecast 2023-2028
      • Exhibit 99: Chart on US - Market size and forecast 2023-2028 ($ billion)
      • Exhibit 100: Data Table on US - Market size and forecast 2023-2028 ($ billion)
      • Exhibit 101: Chart on US - Year-over-year growth 2023-2028 (%)
      • Exhibit 102: Data Table on US - Year-over-year growth 2023-2028 (%)
    • 9.9 China - Market size and forecast 2023-2028
      • Exhibit 103: Chart on China - Market size and forecast 2023-2028 ($ billion)
      • Exhibit 104: Data Table on China - Market size and forecast 2023-2028 ($ billion)
      • Exhibit 105: Chart on China - Year-over-year growth 2023-2028 (%)
      • Exhibit 106: Data Table on China - Year-over-year growth 2023-2028 (%)
    • 9.10 Germany - Market size and forecast 2023-2028
      • Exhibit 107: Chart on Germany - Market size and forecast 2023-2028 ($ billion)
      • Exhibit 108: Data Table on Germany - Market size and forecast 2023-2028 ($ billion)
      • Exhibit 109: Chart on Germany - Year-over-year growth 2023-2028 (%)
      • Exhibit 110: Data Table on Germany - Year-over-year growth 2023-2028 (%)
    • 9.11 UK - Market size and forecast 2023-2028
      • Exhibit 111: Chart on UK - Market size and forecast 2023-2028 ($ billion)
      • Exhibit 112: Data Table on UK - Market size and forecast 2023-2028 ($ billion)
      • Exhibit 113: Chart on UK - Year-over-year growth 2023-2028 (%)
      • Exhibit 114: Data Table on UK - Year-over-year growth 2023-2028 (%)
    • 9.12 Japan - Market size and forecast 2023-2028
      • Exhibit 115: Chart on Japan - Market size and forecast 2023-2028 ($ billion)
      • Exhibit 116: Data Table on Japan - Market size and forecast 2023-2028 ($ billion)
      • Exhibit 117: Chart on Japan - Year-over-year growth 2023-2028 (%)
      • Exhibit 118: Data Table on Japan - Year-over-year growth 2023-2028 (%)
    • 9.13 Market opportunity by geography
      • Exhibit 119: Market opportunity by geography ($ billion)
      • Exhibit 120: Data Tables on Market opportunity by geography ($ billion)

    10 Drivers, Challenges, and Trends

    • 10.1 Market drivers
      • 10.2 Market challenges
        • 10.3 Impact of drivers and challenges
          • Exhibit 121: Impact of drivers and challenges in 2023 and 2028
        • 10.4 Market trends

          11 Vendor Landscape

          • 11.1 Overview
            • 11.2 Vendor landscape
              • Exhibit 122: Overview on Criticality of inputs and Factors of differentiation
            • 11.3 Landscape disruption
              • Exhibit 123: Overview on factors of disruption
            • 11.4 Industry risks
              • Exhibit 124: Impact of key risks on business

            12 Vendor Analysis

            • 12.1 Vendors covered
              • Exhibit 125: Vendors covered
            • 12.2 Market positioning of vendors
              • Exhibit 126: Matrix on vendor position and classification
            • 12.3 Apple Inc.
              • Exhibit 127: Apple Inc. - Overview
              • Exhibit 128: Apple Inc. - Business segments
              • Exhibit 129: Apple Inc. - Key news
              • Exhibit 130: Apple Inc. - Key offerings
              • Exhibit 131: Apple Inc. - Segment focus
            • 12.4 Blippar Ltd.
              • Exhibit 132: Blippar Ltd. - Overview
              • Exhibit 133: Blippar Ltd. - Product / Service
              • Exhibit 134: Blippar Ltd. - Key offerings
            • 12.5 HTC Corp.
              • Exhibit 135: HTC Corp. - Overview
              • Exhibit 136: HTC Corp. - Product / Service
              • Exhibit 137: HTC Corp. - Key offerings
            • 12.6 Lenovo Group Ltd.
              • Exhibit 138: Lenovo Group Ltd. - Overview
              • Exhibit 139: Lenovo Group Ltd. - Business segments
              • Exhibit 140: Lenovo Group Ltd. - Key news
              • Exhibit 141: Lenovo Group Ltd. - Key offerings
              • Exhibit 142: Lenovo Group Ltd. - Segment focus
            • 12.7 Magic Leap Inc.
              • Exhibit 143: Magic Leap Inc. - Overview
              • Exhibit 144: Magic Leap Inc. - Product / Service
              • Exhibit 145: Magic Leap Inc. - Key news
              • Exhibit 146: Magic Leap Inc. - Key offerings
            • 12.8 Meta Platforms Inc.
              • Exhibit 147: Meta Platforms Inc. - Overview
              • Exhibit 148: Meta Platforms Inc. - Product / Service
              • Exhibit 149: Meta Platforms Inc. - Key offerings
            • 12.9 Microsoft Corp.
              • Exhibit 150: Microsoft Corp. - Overview
              • Exhibit 151: Microsoft Corp. - Business segments
              • Exhibit 152: Microsoft Corp. - Key news
              • Exhibit 153: Microsoft Corp. - Key offerings
              • Exhibit 154: Microsoft Corp. - Segment focus
            • 12.10 NVIDIA Corp.
              • Exhibit 155: NVIDIA Corp. - Overview
              • Exhibit 156: NVIDIA Corp. - Business segments
              • Exhibit 157: NVIDIA Corp. - Key news
              • Exhibit 158: NVIDIA Corp. - Key offerings
              • Exhibit 159: NVIDIA Corp. - Segment focus
            • 12.11 PlugXR Reality Pvt. Ltd.
              • Exhibit 160: PlugXR Reality Pvt. Ltd. - Overview
              • Exhibit 161: PlugXR Reality Pvt. Ltd. - Product / Service
              • Exhibit 162: PlugXR Reality Pvt. Ltd. - Key offerings
            • 12.12 PTC Inc.
              • Exhibit 163: PTC Inc. - Overview
              • Exhibit 164: PTC Inc. - Product / Service
              • Exhibit 165: PTC Inc. - Key news
              • Exhibit 166: PTC Inc. - Key offerings
            • 12.13 Qualcomm Inc.
              • Exhibit 167: Qualcomm Inc. - Overview
              • Exhibit 168: Qualcomm Inc. - Business segments
              • Exhibit 169: Qualcomm Inc. - Key news
              • Exhibit 170: Qualcomm Inc. - Key offerings
              • Exhibit 171: Qualcomm Inc. - Segment focus
            • 12.14 Samsung Electronics Co. Ltd.
              • Exhibit 172: Samsung Electronics Co. Ltd. - Overview
              • Exhibit 173: Samsung Electronics Co. Ltd. - Business segments
              • Exhibit 174: Samsung Electronics Co. Ltd. - Key news
              • Exhibit 175: Samsung Electronics Co. Ltd. - Key offerings
              • Exhibit 176: Samsung Electronics Co. Ltd. - Segment focus
            • 12.15 Seiko Epson Corp.
              • Exhibit 177: Seiko Epson Corp. - Overview
              • Exhibit 178: Seiko Epson Corp. - Business segments
              • Exhibit 179: Seiko Epson Corp. - Key news
              • Exhibit 180: Seiko Epson Corp. - Key offerings
              • Exhibit 181: Seiko Epson Corp. - Segment focus
            • 12.16 Sony Group Corp.
              • Exhibit 182: Sony Group Corp. - Overview
              • Exhibit 183: Sony Group Corp. - Business segments
              • Exhibit 184: Sony Group Corp. - Key news
              • Exhibit 185: Sony Group Corp. - Key offerings
              • Exhibit 186: Sony Group Corp. - Segment focus
            • 12.17 Unity Software Inc.
              • Exhibit 187: Unity Software Inc. - Overview
              • Exhibit 188: Unity Software Inc. - Product / Service
              • Exhibit 189: Unity Software Inc. - Key offerings

            13 Appendix

            • 13.1 Scope of the report
              • 13.2 Inclusions and exclusions checklist
                • Exhibit 190: Inclusions checklist
                • Exhibit 191: Exclusions checklist
              • 13.3 Currency conversion rates for US$
                • Exhibit 192: Currency conversion rates for US$
              • 13.4 Research methodology
                • Exhibit 193: Research methodology
                • Exhibit 194: Validation techniques employed for market sizing
                • Exhibit 195: Information sources
              • 13.5 List of abbreviations
                • Exhibit 196: List of abbreviations

              Research Methodology

              Technavio presents a detailed picture of the market by way of study, synthesis, and summation of data from multiple sources. The analysts have presented the various facets of the market with a particular focus on identifying the key industry influencers. The data thus presented is comprehensive, reliable, and the result of extensive research, both primary and secondary.

              INFORMATION SOURCES

              Primary sources

              • Manufacturers and suppliers
              • Channel partners
              • Industry experts
              • Strategic decision makers

              Secondary sources

              • Industry journals and periodicals
              • Government data
              • Financial reports of key industry players
              • Historical data
              • Press releases

              DATA ANALYSIS

              Data Synthesis

              • Collation of data
              • Estimation of key figures
              • Analysis of derived insights

              Data Validation

              • Triangulation with data models
              • Reference against proprietary databases
              • Corroboration with industry experts

              REPORT WRITING

              Qualitative

              • Market drivers
              • Market challenges
              • Market trends
              • Five forces analysis

              Quantitative

              • Market size and forecast
              • Market segmentation
              • Geographical insights
              • Competitive landscape

              Interested in this report?

              Get your sample now to see our research methodology and insights!

              Download Now

              Frequently Asked Questions

              Spatial Computing market growth will increase by $ 259.9 bn during 2024-2028.

              The Spatial Computing market is expected to grow at a CAGR of 27.72% during 2024-2028.

              Spatial Computing market is segmented by Type( Augmented reality, Virtual reality, Internet of Things, Artificial intelligence, Mixed reality) Solution( Hardware, Software, Services)

              Apple Inc., Augtual Reality Pvt Ltd., Blippar Ltd., HTC Corp., Lenovo Group Ltd., Magic Leap Inc., Meta Platforms Inc., Microsoft Corp., NexTech AR Solutions Corp., Nimo Planet Inc., NVIDIA Corp., PlugXR Reality Pvt. Ltd., PTC Inc., Rokid., Samsung Electronics Co. Ltd., Seiko Epson Corp., Unity Software Inc., Weald Creative Ltd , Qualcomm Inc., Sony Group Corp. are a few of the key vendors in the Spatial Computing market.

              North America will register the highest growth rate of 34% among the other regions. Therefore, the Spatial Computing market in North America is expected to garner significant business opportunities for the vendors during the forecast period.

              US, China, Japan, Germany, UK

              • Growing demand for AR and VR technologyTechnologies included under the spatial computing domain majorly include AR and VR. Customers are increasingly adopting VR and AR technology is the driving factor this market.
              • either for professional or private use. This adoption rate has increased significantly in the last decade. An increasing number of customers are actively requesting VR solutions for virtual experiences is the driving factor this market.
              • whereas others are curious about VR and are seeking information about it. Therefore is the driving factor this market.
              • the increasing demand for VR and AR technology will boost the growth of the global spatial computing market during the forecast period. Technological innovations will further drive the demand for AR and VR applications during the forecast period is the driving factor this market.
              • as these applications will enable users to use the technology in a more user-friendly manner. Wearable technology platforms will likely enhance the utility of AR in everyday life. The development of AR Android applications enables users to have a new experience is the driving factor this market.
              • both for offline and online shopping. Virtual fitting rooms will help users choose the right size and decrease purchase returns. A similar benefit is associated with choosing a color for a new car or new furniture for the apartment. The growing application area of AR and VR technology in different fields is the driving factor this market.
              • such as education is the driving factor this market.
              • medical is the driving factor this market.
              • retail is the driving factor this market.
              • and training is the driving factor this market.
              • will further boost the growth of the global spatial computing market during the forecast period. is the driving factor this market.

              The Spatial Computing market vendors should focus on grabbing business opportunities from the Augmented reality segment as it accounted for the largest market share in the base year.