Spherical Activated Alumina Market Size 2024-2028
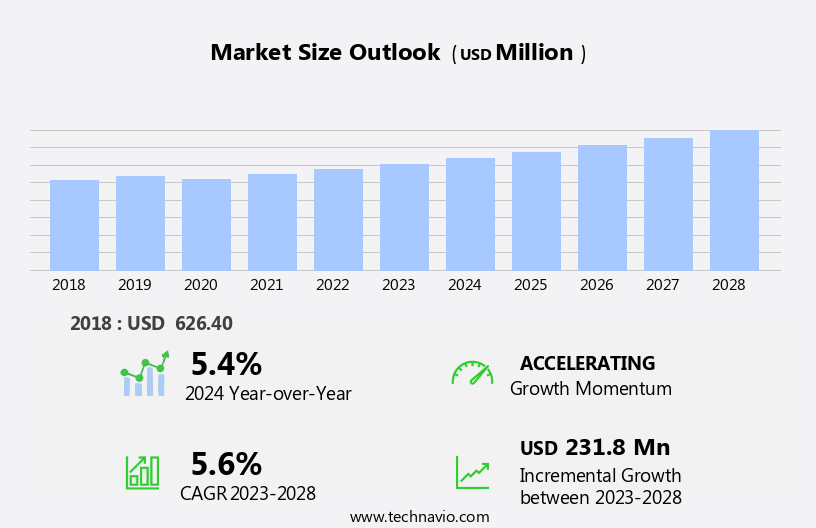
The spherical activated alumina market size is forecast to increase by USD 231.8 million at a CAGR of 5.6% between 2023 and 2028.
- The market is witnessing significant growth due to various key trends and drivers. One of the primary drivers is the increasing demand for water treatment applications, as spherical activated alumina offers superior adsorption capacity and longer service life compared to other adsorbents. Additionally, strategic partnerships and collaborations among market players are contributing to the market's growth.
- However, disruptions in the supply chain due to raw material availability and price fluctuations pose a challenge to market growth. Furthermore, government initiatives to promote water treatment and wastewater management are expected to create opportunities for market expansion. Overall, these factors are shaping the growth trajectory of the market.
What will be the Size of the Spherical Activated Alumina Market During the Forecast Period?
- The market is experiencing significant growth due to its application in various industries addressing critical environmental and energy challenges. With the rise of shale gas and unconventional oil extraction, the demand for energy efficiency and water management in energy production processes has intensified. Spherical activated alumina plays a crucial role in water treatment for industrial applications, including energy, pharmaceuticals, and mining, by removing contaminants such as heavy metals, PCBs, and lead through adsorption technology. Additionally, it is employed in water purification technologies for municipal and industrial water treatment, desalination, and power generation. The market is also driven by the increasing focus on sustainable water management, renewable energy, and green chemistry in various sectors.
- Furthermore, advancements in nanotechnology and process optimization have expanded the potential applications of spherical activated alumina in water infrastructure, membrane filtration, and reverse osmosis systems. Overall, the market is poised for continued growth as industries seek innovative solutions for water treatment, contaminant removal, and environmental remediation.
How is this Spherical Activated Alumina Industry segmented and which is the largest segment?
The spherical activated alumina industry research report provides comprehensive data (region-wise segment analysis), with forecasts and estimates in "USD million" for the period 2024-2028, as well as historical data from 2018-2022 for the following segments.
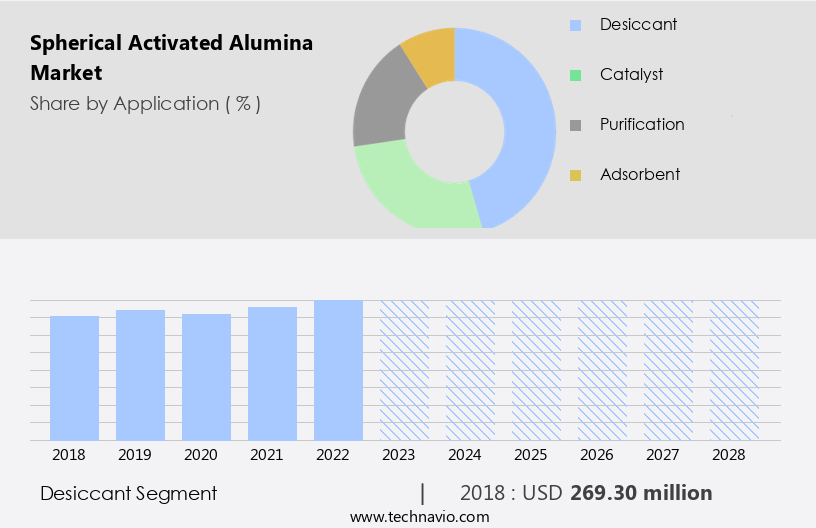
- Application
- Desiccant
- Catalyst
- Purification
- Adsorbent
- End-user
- Oil and gas
- Chemical
- Water treatment
- Others
- Geography
- APAC
- China
- India
- Japan
- South Korea
- North America
- US
- Europe
- Germany
- UK
- France
- Middle East and Africa
- South America
- Brazil
- APAC
By Application Insights
- The desiccant segment is estimated to witness significant growth during the forecast period.
The market is primarily driven by its application in various industries, with a significant focus on desiccant applications. Activated alumina, such as AD-101 (SORB-I) and ALSORB-F from Sorbead India, is widely used due to its high surface area, approximately 415 square meters per gram. This feature enables effective adsorption of water vapor and moisture, making it suitable for applications requiring air drying in heated or heatless air dryers and compressed air systems. The superior adsorption capacity of spherical activated alumina compared to other adsorbents like silica gel and molecular sieves makes it a preferred choice for these applications. Additionally, spherical activated alumina is used in water treatment for the removal of contaminants like arsenic, fluoride, and nitrogen, as well as decolorization and desulfurization.
Its use in industries like oil & gas, textile, and refining for water purification, crude oil desulfurization, and refinery expansion projects is also noteworthy. The high-surface-area, porous nature of spherical activated alumina makes it an effective adsorbent for various applications, contributing to its growing demand in industries seeking to address water shortage, water recycling, and environmental protection issues.
Get a glance at the Spherical Activated Alumina Industry report of share of various segments Request Free Sample
The Desiccant segment was valued at USD 269.30 million in 2018 and showed a gradual increase during the forecast period.
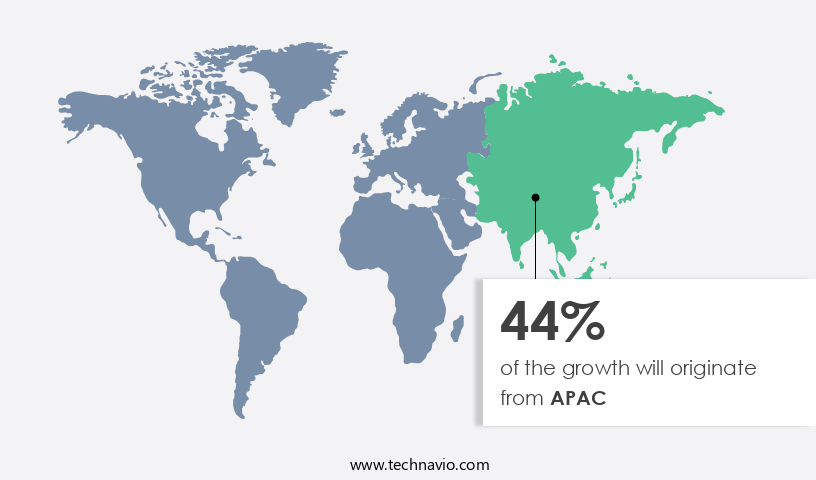
Regional Analysis
- APAC is estimated to contribute 44% to the growth of the global market during the forecast period.
Technavio's analysts have elaborately explained the regional trends and drivers that shape the market during the forecast period.
For more insights on the market share of various regions, Request Free Sample
The Asia Pacific region is witnessing significant growth In the market due to increasing investments in water treatment and oil & gas projects. For instance, the Bengaluru Water Supply and Sewerage Board (BWSSB) in India plans to establish the largest water treatment facility in Asia at TK Halli. This facility, set to address the region's water demand, will utilize spherical activated alumina for contaminant removal and water purification. In the oil & gas sector, the material's applications include desulfurization, decolorization, and the removal of sulfur impurities in unconventional onshore oil and natural gas. Spherical activated alumina's high-surface-area and porous properties make it an effective adsorbent for various industries, including biopharmaceutical, textile, and chemical.
Additionally, it plays a crucial role in water recycling and wastewater treatment, addressing water shortage concerns and ensuring compliance with discharge standards. Key industries utilizing spherical activated alumina include refining, lithium production, and nuclear industries, among others.
Market Dynamics
Our researchers analyzed the data with 2023 as the base year, along with the key drivers, trends, and challenges. A holistic analysis of drivers will help companies refine their marketing strategies to gain a competitive advantage.
What are the key market drivers leading to the rise In the adoption of Spherical Activated Alumina Industry?
Government initiatives is the key driver of the market.
- The market is experiencing significant growth due to increasing demand for water treatment applications, particularly In the oil & gas industry for desulfurization and water recycling. Palladium alumina catalysts are widely used in this sector for decolorization, sulfur impurities removal, and selective hydrogenation catalysts. In the biopharmaceutical industry, activated alumina serves as an adsorbent for removing contaminants such as arsenic, fluoride, and PCBs from water and wastewater. The market is further propelled by the need for water purification in various industries, including textile, municipal water treatment, and food & beverage. Strategic acquisitions and collaborations are driving innovation In the market, with companies focusing on enhancing the anti-corrosion properties and high-surface-area of spherical activated alumina for diverse applications.
- The market also caters to environmental protection needs, including the removal of nitrogen and toxic spills, and the treatment of process gases for environmental cleanup. The market is expected to continue expanding due to increasing demand for water shortage solutions, wastewater treatment, and alternative energy applications such as lithium production and Claus process in refinery projects and refinery expansion.
What are the market trends shaping the Spherical Activated Alumina Industry?
Strategic partnerships is the upcoming market trend.
- The market is experiencing a trend of strategic acquisitions to expand product offerings and enhance technological capabilities. An illustrative instance is Momentive Technologies' acquisition of spherical alumina and spherical silica businesses in South Korea in October 2024. This deal will broaden Momentive Technologies' ceramic powder product line and boost innovation In thermal fillers, essential components in thermal interface materials. TIMs play a pivotal role in managing heat dissipation, ensuring high performance, and prolonging the lifespan of power electronic and battery systems. In various industries, spherical activated alumina serves as an essential adsorbent for water treatment, decolorization, and purification applications.
- It is widely used In the oil & gas sector for desulfurization, particularly in unconventional onshore oil and shale oil production. In the biopharmaceutical industry, it functions as a selective hydrogenation catalyst and a desiccant. Spherical activated alumina also finds application In the textile industry for water recycling and In the removal of arsenic, fluoride, and other contaminants from water. Moreover, spherical activated alumina is utilized In the chemical industry for the production of surgical metal alloys, hip prosthesis, and tooth implants. It is also employed in environmental protection agencies for the treatment of wastewater and the removal of PCBs and other toxic spills.
- In the food & beverage industry, it is used for water purification and In the production of lithium, which is crucial for batteries in alternative energy sources. The market's growth is driven by the increasing demand for water shortage solutions, water recycling, and freshwater supply. The need for water treatment in industries such as oil & gas, textile, and chemical production is escalating due to stringent discharge standards and environmental concerns. The market's growth is further fueled by the rising awareness of health issues associated with water contamination and the need for efficient water purification systems. In conclusion, the market is a significant player in various industries, including water treatment, oil & gas, biopharmaceutical, textile, chemical, and food & beverage.
- Its unique properties, such as high-surface-area, porous structure, and selective adsorption capabilities, make it an indispensable component in numerous applications. The market's growth is driven by the increasing demand for water treatment and purification, stringent regulations, and the need for efficient and cost-effective solutions. Strategic acquisitions and partnerships are expected to continue shaping the market landscape, with a focus on innovation and technological advancements.
What challenges does the Spherical Activated Alumina Industry face during its growth?
Disruptions in supply chain is a key challenge affecting the industry growth.
- The market is experiencing challenges due to disruptions In the global supply chain, particularly In the Red Sea region. This vital trade route connecting Asia, Africa, and Europe has faced security concerns since the attack on an Israeli industrial ship in 2023. These incidents have raised concerns about increased freight costs, extended shipping times, and potential supply chain disruptions. The ongoing Israel-Hamas conflict further aggravates these issues, with Iran-backed Houthi rebels of Yemen seizing a ship owned by an Israeli businessman and redirecting it towards the Yemeni coast, threatening broader trade disruptions. In the industrial sector, spherical activated alumina is used extensively in various applications, including water treatment for the removal of contaminants such as arsenic, fluoride, and sulfur impurities.
- In the oil and gas industry, it is employed in desulfurization processes, refinery projects, and refinery expansions. In the biopharmaceutical sector, it serves as an adsorbent for antibiotics and other pharmaceutical compounds. The market's growth is also driven by its use In the textile industry for decolorization and In the Claus process for sulfur recovery. Despite these challenges, the market's demand remains strong due to its essential role in water purification, environmental protection, and various industrial processes. The market's key applications include water shortage mitigation through water recycling, wastewater treatment, and freshwater supply enhancement. Additionally, spherical activated alumina is used in alternative energy production, such as lithium-ion batteries, and in various industries, including chemical manufacturing, food and beverage production, surgical metal alloys, and nuclear industries.
- The market's future growth is expected to be influenced by strategic acquisitions, the development of selective hydrogenation catalysts, and the need for anti-corrosion properties in various applications. However, the market's growth may also be impacted by regulatory requirements, such as discharge standards set by the Environmental Protection Agency, and the need for continuous regeneration to maintain its high-surface-area and porous properties. The market's future outlook is promising, with potential applications In the removal of toxic spills, process gases, and environmental cleanup. Overall, the market's growth is driven by its essential role in various industries and its ability to address critical environmental and industrial challenges.
Exclusive Customer Landscape
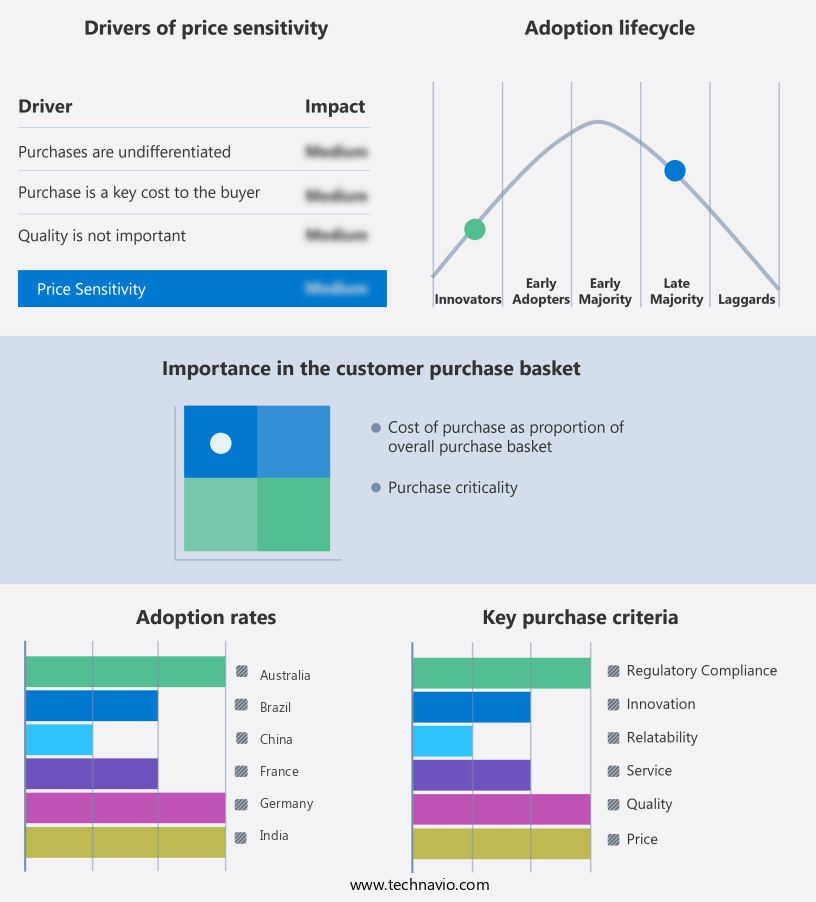
The spherical activated alumina market forecasting report includes the adoption lifecycle of the market, covering from the innovator's stage to the laggard's stage. It focuses on adoption rates in different regions based on penetration. Furthermore, the spherical activated alumina market report also includes key purchase criteria and drivers of price sensitivity to help companies evaluate and develop their market growth analysis strategies.
Customer Landscape
Key Companies & Market Insights
Companies are implementing various strategies, such as strategic alliances, spherical activated alumina market forecast, partnerships, mergers and acquisitions, geographical expansion, and product/service launches, to enhance their presence In the industry.
The industry research and growth report includes detailed analyses of the competitive landscape of the market and information about key companies, including:
- Adsorption Technologies
- AGC Chemicals Pvt. Ltd.
- Axens
- BASF SE
- BeeChems
- CHALCO Advanced Material Co., Ltd.
- Desicca Chemicals Pvt Ltd
- DS Filtration Pty Ltd.
- Evonik Industries AG
- HengYe Inc.
- Honeywell International Inc.
- J M Huber Corp.
- Shandong Zhongxing New Material Technology Co. Ltd.
- Sialca Industries
- Smart elements GmbH
- SORBEAD India
- Sumitomo Chemical Co. Ltd.
- Zibo Yinghe Chemical Co Ltd
Qualitative and quantitative analysis of companies has been conducted to help clients understand the wider business environment as well as the strengths and weaknesses of key industry players. Data is qualitatively analyzed to categorize companies as pure play, category-focused, industry-focused, and diversified; it is quantitatively analyzed to categorize companies as dominant, leading, strong, tentative, and weak.
Research Analyst Overview
Spherical activated alumina is a type of adsorbent material that has gained significant attention in various industries due to its unique properties. This versatile material is known for its high surface area and porosity, making it an effective solution for a range of applications. The market for spherical activated alumina is driven by its ability to effectively remove impurities from water and gases. In the water treatment sector, it is used for purification and desulfurization, particularly In the oil and gas industry. Spherical activated alumina plays a crucial role In the refining process, where it is used to remove sulfur impurities from crude oil and natural gas.
Moreover, the material is also used In the treatment of industrial wastewater, where it helps to remove contaminants such as heavy metals, PCBs, and other toxic substances. In the food and beverage industry, spherical activated alumina is used for the removal of fluoride and other impurities from drinking water. The textile industry is another significant consumer of spherical activated alumina. It is used for decolorization and desizing of textiles, as well as for the removal of hardness from water used In the manufacturing process. The material's high surface area and porosity make it an effective desiccant, which is used in various applications such as air conditioning and refrigeration.
The market for spherical activated alumina is also driven by its use In the chemical industry. It is used as a catalyst in various chemical reactions, including selective hydrogenation catalysts and the Claus process. In the nuclear industries, it is used for the removal of radioactive isotopes and other impurities from cooling water. The market for spherical activated alumina is expected to grow due to the increasing demand for water purification and desulfurization in various industries. The shortage of freshwater and the need for water recycling have led to an increased focus on water treatment technologies, which is expected to drive the demand for spherical activated alumina.
Moreover, the material's anti-corrosion properties make it an attractive option for use in refinery projects and refinery expansion. The growing demand for alternative energy sources, such as shale oil and natural gas, is also expected to drive the demand for spherical activated alumina. The market for spherical activated alumina is highly competitive, with several players offering products with varying specifications and applications. The market is characterized by continuous research and development efforts to improve the material's properties and expand its applications. Strategic acquisitions and collaborations are also common In the market to gain a competitive edge. In conclusion, spherical activated alumina is a versatile and effective adsorbent material that is used in various industries for water and gas purification, desulfurization, and catalysis. The market for spherical activated alumina is expected to grow due to the increasing demand for water treatment technologies and the expanding applications of the material in various industries. The market is highly competitive, with continuous research and development efforts and strategic collaborations driving innovation and growth.
|
Market Scope |
|
|
Report Coverage |
Details |
|
Page number |
212 |
|
Base year |
2023 |
|
Historic period |
2018-2022 |
|
Forecast period |
2024-2028 |
|
Growth momentum & CAGR |
Accelerate at a CAGR of 5.6% |
|
Market growth 2024-2028 |
USD 231.8 million |
|
Market structure |
Fragmented |
|
YoY growth 2023-2024(%) |
5.4 |
|
Key countries |
US, China, India, Japan, Germany, South Korea, UK, France, Brazil, and Australia |
|
Competitive landscape |
Leading Companies, Market Positioning of Companies, Competitive Strategies, and Industry Risks |
What are the Key Data Covered in this Spherical Activated Alumina Market Research and Growth Report?
- CAGR of the Spherical Activated Alumina industry during the forecast period
- Detailed information on factors that will drive the growth and forecasting between 2024 and 2028
- Precise estimation of the size of the market and its contribution of the industry in focus to the parent market
- Accurate predictions about upcoming growth and trends and changes in consumer behaviour
- Growth of the market across APAC, North America, Europe, Middle East and Africa, and South America
- Thorough analysis of the market's competitive landscape and detailed information about companies
- Comprehensive analysis of factors that will challenge the spherical activated alumina market growth of industry companies
We can help! Our analysts can customize this spherical activated alumina market research report to meet your requirements.
 RIA -
RIA - 
