Spinning Machinery Market Analysis APAC, North America, Europe, South America, Middle East and Africa - US, China, India, Japan, Vietnam - Size and Forecast 2024-2028

Spinning Machinery Market Analysis APAC, North America, Europe, South America, Middle East and Africa - US, China, India, Japan, Vietnam - Size and Forecast 2024-2028

Published: Jan 2024 162 Pages SKU: IRTNTR75357

Market Overview at a Glance

$2.24 B
Market Opportunity
6.56%
CAGR
6.38
YoY growth 2023-2024(%)

Spinning Machinery Market Size Report 2024-2028

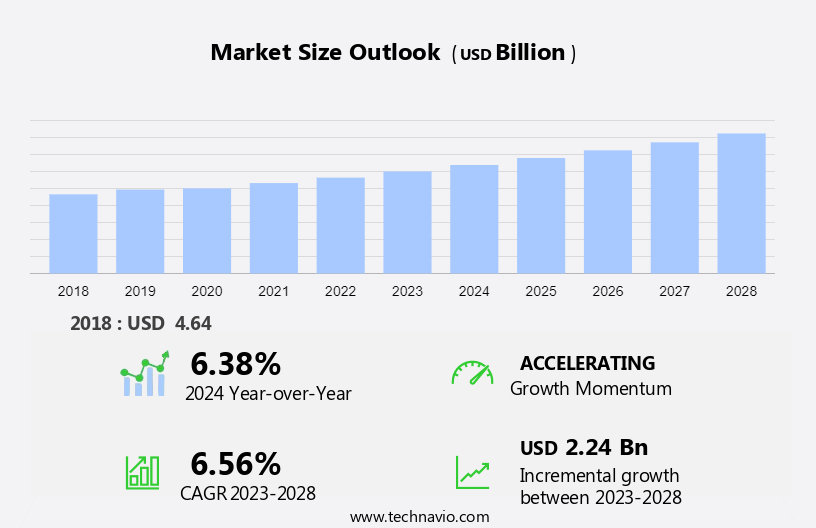
The spinning machinery market size is forecast to increase by USD 2.24 billion, at a CAGR of 6.56% between 2023 and 2028. The market's growth is driven by several key factors. One major driver is the increasing adoption of sustainable manufacturing practices within the textile industry. As environmental concerns become more prominent, manufacturers are incorporating eco-friendly processes and materials, leading to a higher demand for advanced spinning machinery, including industrial sewing machines designed with sustainability in mind. Government policies that support the textile industry also play a crucial role in market expansion. Incentives, subsidies, and favorable regulations encourage investments in modern spinning technologies, further boosting market growth. Additionally, the rising demand for non-woven fabrics, driven by their wide range of applications in industries such as healthcare, automotive, and consumer goods, is creating a greater need for efficient and innovative spinning machinery. These factors highlight the dynamic nature of the market and its crucial role in advancing both the capabilities and sustainability of the textile industry.

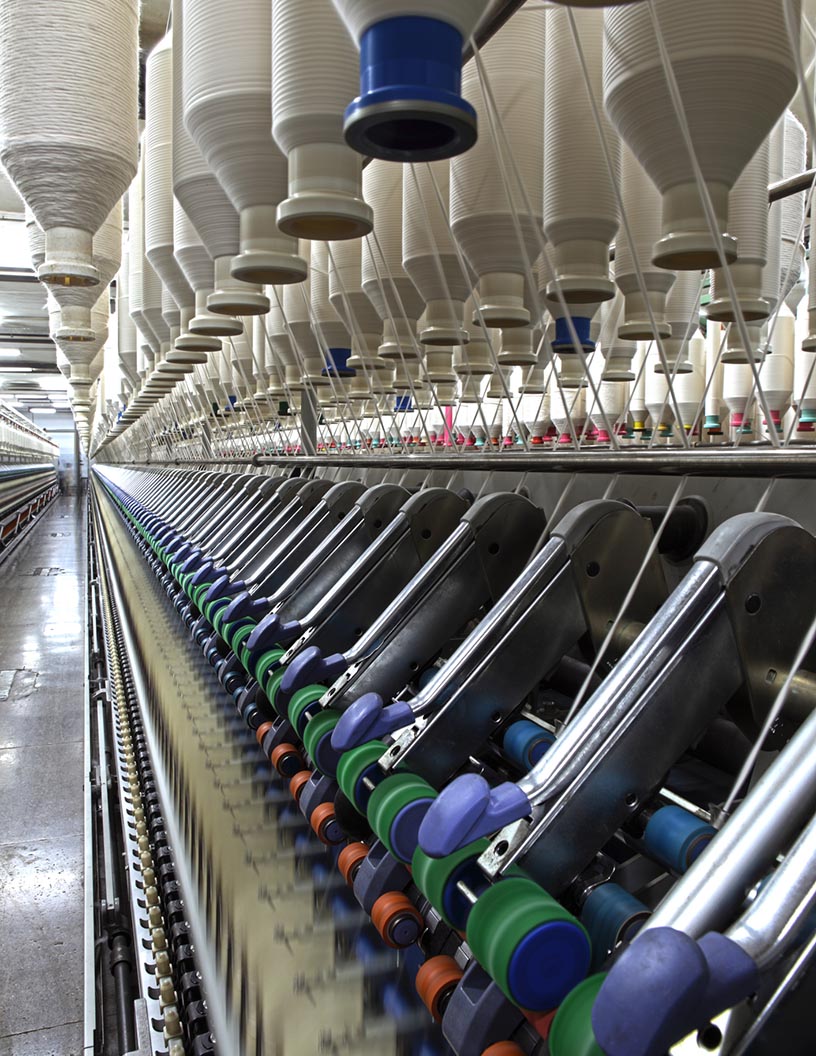
What will the size of the Spinning Machinery Market be during the Forecast Period?

Spinning Machinery Market Size

To learn more about this market report, Request Free Sample

Spinning Machinery Market Segmentation

The report offers extensive research analysis on the market, with a categorization based on Application, including textiles, clothing, and others. It further segments the market by Product, encompassing short-staple spindles, long-staple spindles, and open-end rotors.

  • Application Outlook 
    • Textiles
    • Clothing
    • Others
  • Product Outlook 
    • Short-staple spindles
    • Long-staple spindles
    • Open-end rotors
  • Region Outlook 
    • North America
      • The U.S.
      • Canada
    • Europe
      • The U.K.
      • Germany
      • France
      • Rest of Europe
    • APAC
      • China
      • India
    • South America
      • Chile
      • Argentina
      • Brazil
    • Middle East & Africa
      • Saudi Arabia
      • South Africa
      • Rest of the Middle East & Africa

Application Analysis

The textiles segment is estimated to witness significant growth during the forecast period. The growth in the textile segment is fuelled by factors such as technological advancements in the textile industry, such as the adoption of automation, smart textiles, and sustainable manufacturing practices. In addition, spinning machinery plays a major role in the textile segment, from fiber preparation to determining the yarn characteristics.

Spinning Machinery Market Size

Get Sample Report

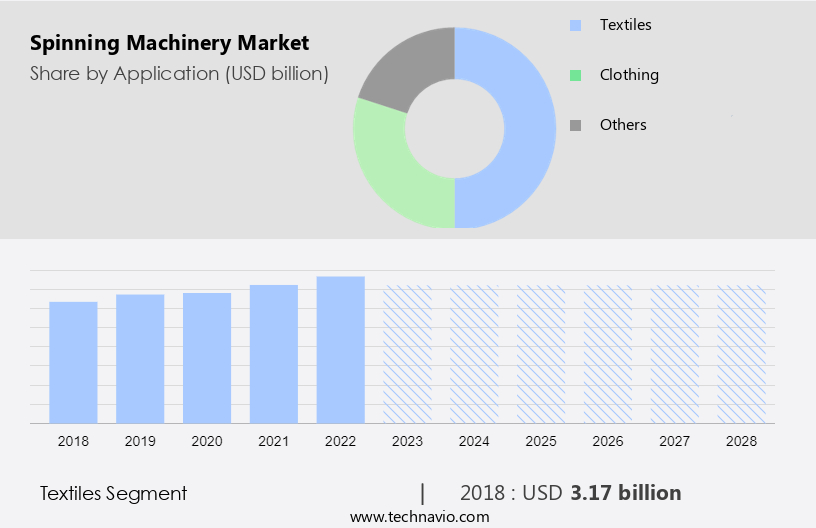
The textiles segment was the largest segment and was valued at USD 3.17 billion in 2018. Moreover, the primary function of spinning machinery is to convert raw fibers into yarn, which serves as the basic building block for subsequent processes in textile manufacturing. In addition, China and India are two of the largest producers and exporters of textiles in this region. Furthermore, rapid innovation in the production of textile machinery is adding momentum to the Chinese textile industry. In addition, innovations in textile manufacturing, such as computerized data monitoring, automatic fabric spreaders, automatic fabric cutters, and high-speed sewing machines, join forces with garment workers to increase productivity in the textile segment. Hence, such factors are fuelling the growth of this segment which in turn drives market growth during the forecast period.

Additionally, the report provides region segmentation, covering APAC, Europe, North America, Middle East and Africa, and South America. The market analysis and report forecasts market growth by revenue at global, regional & country levels and provides an analysis of the latest trends and growth opportunities from 2018 to 2028. This research and growth report includes market size, historical data (2018-2022), and future projections are presented in terms of value (in USD billion) for all the mentioned segments.

Product Analysis

Based on the product, the market has been segmented into short-staple spindles, long-staple spindles, and open-end rotors. The short-staple spindles segment will account for the largest share of this segment. This segment is mainly used for spinning yarns from cotton, polyester, viscose, and other blends.  In addition, with the increase in the production of fibers such as cotton and polyester, the demand for short-staple spindles also grows.  Moreover, the leading countries in APAC that have the highest installed capacities in short-staple spindles are China, India, Vietnam, Bangladesh, Indonesia, and Pakistan. Furthermore, the escalating integration of technology in short-spindles enhances the product quality and efficiency of the short-staple spindle. Hence, such factors are fuelling the growth of this segment which in turn drives the market growth during the forecast period.

Regional Analysis

Spinning Machinery Market Share by Geography

For more insights on the Spinning Machinery market share of various regions, Download Sample PDF

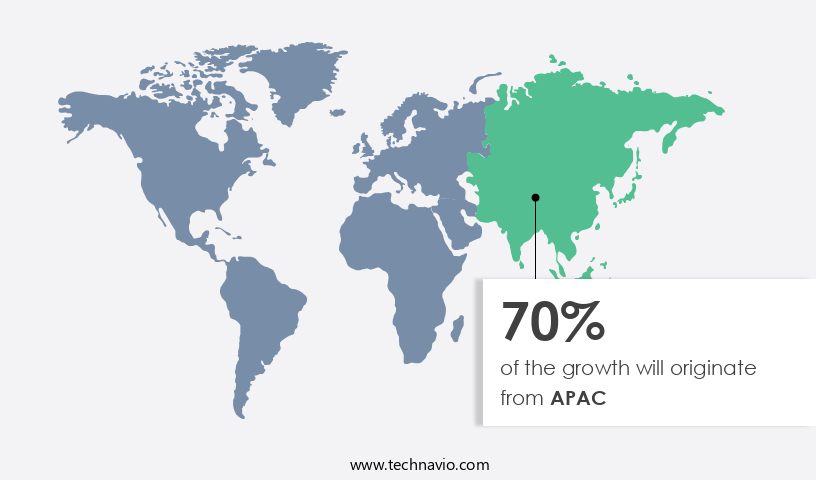
APAC is estimated to contribute 70% to the growth by 2028. Technavio's analysts have provided extensive insight into the market forecasting, detailing the regional trends and drivers influencing the market's trajectory throughout the forecast period. The market growth in APAC is fuelled by the demand for spinning machinery from countries such as China, India, and Bangladesh. In addition, the blooming garment and textile industry in China is one of the key drivers for the growth of the market in the region. Moreover,  China is considered one of the largest producers and exporters of textiles and apparel in the world. Furthermore, India is also emerging as a leading textile manufacturer owing to the robust demand for clothing and fabrics and its competitive advantage. Hence, such factors are driving the market growth in APAC during the forecast period.

Spinning Machinery Market Dynamics

Our researchers studied the market research and growth data for years, with 2023 as the base year and 2024 as the estimated year, and presented the key drivers, trends, and challenges for the market. Although there has been a disruption in the market growth during the COVID-19 pandemic, a holistic analysis of drivers, trends, and challenges of market growth and forecasting will help companies refine marketing strategies to gain a competitive advantage.    

Key Spinning Machinery Market Driver

The growing awareness of environmental issues and sustainable practices has resulted in an increased demand for spinning machinery that incorporates eco-friendly features.  In addition, the increasing adoption of sustainable spinning practices in the use of textile machinery that render minimal environmental impact, maximum savings in electric power consumption, and optimal utilization of resources are fuelling the growth of the market.

For instance, Rieter Holding AG is developing sustainable spinning machines and systems, and services to save energy, optimize resource utilization and produce efficiently and economically, and increase competitiveness in the market. In addition, innovative solutions, including ensuring optimum raw material utilization and minimizing fiber consumption and processing of sustainable and recycled fibers or eco fiber, help in the sustainable use of raw materials and increase the customer demand for sustainable fibers. Hence, such factors are driving the market growth during the forecast period.

Significant Spinning Machinery Market Trends

The growth potential of the market is encouraging companies to enter into strategic partnerships to expand their customer base and footprint. Therefore, companies in the market are carrying out mergers and acquisitions to remain competitive.

For example, in April 2022, Rieter Holding AG acquired three businesses from Saurer AG, including the automatic winding machine business. In addition, the acquisition completes Rieters ring and compact-spinning system and improves the company's strong position in the staple fiber sector. Hence, such factors are driving the market growth during the forecast period.

Major Spinning Machinery Market Challenge

Even though machinery in the textile industry, such as spinning machinery, is beneficial in minimizing the cost of production, the investment cost is high because of the expensive components required for textile manufacturing. In addition, for the coordination and smooth functioning of the machinery, end-users have to use expensive machinery.

Moreover, in most developing countries, the wages paid are comparatively lower than in developed industrialized countries, which limits many small-scale textile industries in countries including India and China from implementing spinning machinery. In addition, another reason is the difficulty in finding skilled labor to operate the machinery, as well as the maintenance is expensive. Hence, such factors are hindering the market growth during the forecast period.

Major Spinning Machinery Market Companies

Companies are implementing various strategies, such as strategic alliances, partnerships, mergers and acquisitions, geographical expansion, and product/service launches, to enhance their presence in the market.

ATE Pvt. Ltd: The company offers spinning machinery for textile industries. They also offer top notch fiber and yarn testing equipment.

We also have detailed analyses of the market's competitive landscape and offer information on 20 market companies, including:

Amarnaathh Engineering, Bonfiglioli Riduttori Spa, Camozzi Group SPA, DS Machinery Makers, Jutex Industries Pvt. Ltd., JWELL Intelligent Machinery Co. Ltd., Lakshmi Machine Works Ltd., Murata Machinery Ltd., Naugra Machines India, Perfect Equipments Pvt. Ltd., Prism Machinery Ltd., Rieter Holding AG, SAURER AG, Shandong Rifa Textile Machinery Co. Ltd., SSB Tex Engineering, Toyota Industries Corp., Trutzschler Group SE, VANDEWIELE NV, and Zhejiang Taitan Co. Ltd.

Technavio market forecast provides an in-depth analysis of the market and its players through combined qualitative and quantitative data. The analysis classifies companies into categories based on their business approaches, including pure-play, category-focused, industry-focused, and diversified. Companies are specially categorized into dominant, leading, strong, tentative, and weak, based on their quantitative data analysis. 

Market Analyst Overview

The global spinning machinery market is witnessing significant growth due to the increasing demand for high-quality textile products, particularly in the apparel and technical textiles industries. With a focus on sustainability and eco-friendliness, spinning machinery manufacturers are incorporating green technologies to reduce the carbon footprint of textile production. One such trend is the use of biodegradable materials in spinning machinery. This not only reduces the amount of greenhouse gases emitted during production but also aligns with the growing consumer preference for sustainable and eco-friendly products. Moreover, real-time monitoring of spinning machinery using sensors and software is becoming increasingly popular, allowing for improved efficiency and reduced waste.  Advancements in spinning machinery technology include the integration of robotics and artificial intelligence.

Ring spinning and rotor spinning techniques are being replaced with more advanced methods, enabling the production of superior textile fibers from both natural and synthetic materials, as well as blended fibers. The technical textiles industry, including automotive textiles, geotextiles, and industrial yarns, is a significant consumer of spinning machinery. The nonwoven fabric market, which includes sanitary care products such as feminine products and baby diapers, is another major consumer of spinning machinery. Diaper manufacturers are investing in advanced spinning machinery to produce high-quality, cost-effective materials for their products. The fast fashion market, driven by fashion trends and online retailers, is also a significant consumer of spinning machinery. Virtual and augmented reality technologies are being used to create virtual reality mirrors, allowing consumers to try on apparel products virtually before making a purchase. Yarn production businesses are also leveraging cloud-based software solutions for connectivity options and improved efficiency.

The Indian textile industry, with its cheap labor and large workforce, is a major player in the global spinning machinery market. The Textile Ministry and textile parks are investing in modern spinning machinery to improve the quality and competitiveness of Indian textile products in the global market. In conclusion, the global spinning machinery market is witnessing significant growth due to the increasing demand for high-quality textile products, particularly in the apparel and technical textiles industries. Advancements in technology, including the use of eco-friendly materials, real-time monitoring, robotics, artificial intelligence, and cloud-based software solutions, are driving innovation and efficiency in spinning machinery production. The market is expected to continue growing, particularly in emerging markets such as India, as the demand for sustainable and cost-effective textile production increases.

Spinning Machinery Market Scope

Report Coverage

Details

Page number

162

Base year

2023

Historic period

2018-2022

Forecast period

2024-2028

Growth momentum & CAGR

Accelerate at a CAGR of 6.56%

Market Growth 2024-2028

USD 2.24 billion

Market structure

Fragmented

YoY growth 2023-2024(%)

6.38

Regional analysis

APAC, North America, Europe, South America, and the Middle East and Africa

Performing market contribution

APAC at 70%

Key countries

US, China, India, Japan, and Vietnam

Competitive landscape

Leading Companies, Market Positioning of Companies, Competitive Strategies, and Industry Risks, Spinning Machinery Market Industry 

Key companies profiled

ATE Pvt. Ltd., Amarnaathh Engineering, Bonfiglioli Riduttori Spa, Camozzi Group SPA, DS Machinery Makers, Jutex Industries Pvt. Ltd., JWELL Intelligent Machinery Co. Ltd., Lakshmi Machine Works Ltd., Murata Machinery Ltd., Naugra Machines India, Perfect Equipments Pvt. Ltd., Prism Machinery Ltd., Rieter Holding AG, SAURER AG, Shandong Rifa Textile Machinery Co. Ltd., SSB Tex Engineering, Toyota Industries Corp., Trutzschler Group SE, VANDEWIELE NV, and Zhejiang Taitan Co. Ltd.

Market dynamics

Parent market analysis, Market growth inducers and obstacles, Fast-growing and slow-growing segment analysis, COVID-19 impact and recovery analysis and future consumer dynamics, and Market condition analysis for the forecast period, Spinning Machinery Market Growth Analysis

Customization purview

If our spinning machinery market worth report has not included the data that you are looking for, you can reach out to our analysts and get segments customized.

Request Sample PDF 

What are the Key Data Covered in this Spinning Machinery Market Research Report?

  • CAGR of the market during the forecast period
  • Detailed information on factors that will drive the growth of the market between 2023 and 2028
  • Precise estimation of the market growth and trends and its contribution to the market in focus on the parent market
  • Accurate predictions about upcoming market trends and analysis and changes in consumer behavior
  • Market growth and forecasting across APAC, North America, Europe, South America, and the Middle East and Africa
  • A thorough market report analysis and report of the market's competitive landscape and detailed information about companies
  • Comprehensive market growth analysis of factors that will challenge the growth of market  companies

We can help! Our analysts can customize this market research report to meet your requirements. Get in touch

1 Executive Summary

  • 1.1 Market overview
    • Exhibit 01: Executive Summary – Chart on Market Overview
    • Exhibit 02: Executive Summary – Data Table on Market Overview
    • Exhibit 03: Executive Summary – Chart on Global Market Characteristics
    • Exhibit 04: Executive Summary – Chart on Market by Geography
    • Exhibit 05: Executive Summary – Chart on Market Segmentation by Application
    • Exhibit 06: Executive Summary – Chart on Market Segmentation by Product
    • Exhibit 07: Executive Summary – Chart on Incremental Growth
    • Exhibit 08: Executive Summary – Data Table on Incremental Growth
    • Exhibit 09: Executive Summary – Chart on Vendor Market Positioning

2 Market Landscape

  • 2.1 Market ecosystem
    • Exhibit 10: Parent market
    • Exhibit 11: Market Characteristics

3 Market Sizing

  • 3.1 Market definition
    • Exhibit 12: Offerings of vendors included in the market definition
  • 3.2 Market segment analysis
    • Exhibit 13: Market segments
  • 3.3 Market size 2023
    • 3.4 Market outlook: Forecast for 2023-2028
      • Exhibit 14: Chart on Global - Market size and forecast 2023-2028 ($ billion)
      • Exhibit 15: Data Table on Global - Market size and forecast 2023-2028 ($ billion)
      • Exhibit 16: Chart on Global Market: Year-over-year growth 2023-2028 (%)
      • Exhibit 17: Data Table on Global Market: Year-over-year growth 2023-2028 (%)

    4 Historic Market Size

    • 4.1 Global spinning machinery market 2018 - 2022
      • Exhibit 18: Historic Market Size – Data Table on global spinning machinery market 2018 - 2022 ($ billion)
    • 4.2 Application Segment Analysis 2018 - 2022
      • Exhibit 19: Historic Market Size – Application Segment 2018 - 2022 ($ billion)
    • 4.3 Product Segment Analysis 2018 - 2022
      • Exhibit 20: Historic Market Size – Product Segment 2018 - 2022 ($ billion)
    • 4.4 Geography Segment Analysis 2018 - 2022
      • Exhibit 21: Historic Market Size – Geography Segment 2018 - 2022 ($ billion)
    • 4.5 Country Segment Analysis 2018 - 2022
      • Exhibit 22: Historic Market Size – Country Segment 2018 - 2022 ($ billion)

    5 Five Forces Analysis

    • 5.1 Five forces summary
      • Exhibit 23: Five forces analysis - Comparison between 2023 and 2028
    • 5.2 Bargaining power of buyers
      • Exhibit 24: Chart on Bargaining power of buyers – Impact of key factors 2023 and 2028
    • 5.3 Bargaining power of suppliers
      • Exhibit 25: Bargaining power of suppliers – Impact of key factors in 2023 and 2028
    • 5.4 Threat of new entrants
      • Exhibit 26: Threat of new entrants – Impact of key factors in 2023 and 2028
    • 5.5 Threat of substitutes
      • Exhibit 27: Threat of substitutes – Impact of key factors in 2023 and 2028
    • 5.6 Threat of rivalry
      • Exhibit 28: Threat of rivalry – Impact of key factors in 2023 and 2028
    • 5.7 Market condition
      • Exhibit 29: Chart on Market condition - Five forces 2023 and 2028

    6 Market Segmentation by Application

    • 6.1 Market segments
      • Exhibit 30: Chart on Application - Market share 2023-2028 (%)
      • Exhibit 31: Data Table on Application - Market share 2023-2028 (%)
    • 6.2 Comparison by Application
      • Exhibit 32: Chart on Comparison by Application
      • Exhibit 33: Data Table on Comparison by Application
    • 6.3 Textiles - Market size and forecast 2023-2028
      • Exhibit 34: Chart on Textiles - Market size and forecast 2023-2028 ($ billion)
      • Exhibit 35: Data Table on Textiles - Market size and forecast 2023-2028 ($ billion)
      • Exhibit 36: Chart on Textiles - Year-over-year growth 2023-2028 (%)
      • Exhibit 37: Data Table on Textiles - Year-over-year growth 2023-2028 (%)
    • 6.4 Clothing - Market size and forecast 2023-2028
      • Exhibit 38: Chart on Clothing - Market size and forecast 2023-2028 ($ billion)
      • Exhibit 39: Data Table on Clothing - Market size and forecast 2023-2028 ($ billion)
      • Exhibit 40: Chart on Clothing - Year-over-year growth 2023-2028 (%)
      • Exhibit 41: Data Table on Clothing - Year-over-year growth 2023-2028 (%)
    • 6.5 Others - Market size and forecast 2023-2028
      • Exhibit 42: Chart on Others - Market size and forecast 2023-2028 ($ billion)
      • Exhibit 43: Data Table on Others - Market size and forecast 2023-2028 ($ billion)
      • Exhibit 44: Chart on Others - Year-over-year growth 2023-2028 (%)
      • Exhibit 45: Data Table on Others - Year-over-year growth 2023-2028 (%)
    • 6.6 Market opportunity by Application
      • Exhibit 46: Market opportunity by Application ($ billion)
      • Exhibit 47: Data Table on Market opportunity by Application ($ billion)

    7 Market Segmentation by Product

    • 7.1 Market segments
      • Exhibit 48: Chart on Product - Market share 2023-2028 (%)
      • Exhibit 49: Data Table on Product - Market share 2023-2028 (%)
    • 7.2 Comparison by Product
      • Exhibit 50: Chart on Comparison by Product
      • Exhibit 51: Data Table on Comparison by Product
    • 7.3 Short-staple spindles - Market size and forecast 2023-2028
      • Exhibit 52: Chart on Short-staple spindles - Market size and forecast 2023-2028 ($ billion)
      • Exhibit 53: Data Table on Short-staple spindles - Market size and forecast 2023-2028 ($ billion)
      • Exhibit 54: Chart on Short-staple spindles - Year-over-year growth 2023-2028 (%)
      • Exhibit 55: Data Table on Short-staple spindles - Year-over-year growth 2023-2028 (%)
    • 7.4 Long-staple spindles - Market size and forecast 2023-2028
      • Exhibit 56: Chart on Long-staple spindles - Market size and forecast 2023-2028 ($ billion)
      • Exhibit 57: Data Table on Long-staple spindles - Market size and forecast 2023-2028 ($ billion)
      • Exhibit 58: Chart on Long-staple spindles - Year-over-year growth 2023-2028 (%)
      • Exhibit 59: Data Table on Long-staple spindles - Year-over-year growth 2023-2028 (%)
    • 7.5 Open-end rotors - Market size and forecast 2023-2028
      • Exhibit 60: Chart on Open-end rotors - Market size and forecast 2023-2028 ($ billion)
      • Exhibit 61: Data Table on Open-end rotors - Market size and forecast 2023-2028 ($ billion)
      • Exhibit 62: Chart on Open-end rotors - Year-over-year growth 2023-2028 (%)
      • Exhibit 63: Data Table on Open-end rotors - Year-over-year growth 2023-2028 (%)
    • 7.6 Market opportunity by Product
      • Exhibit 64: Market opportunity by Product ($ billion)
      • Exhibit 65: Data Table on Market opportunity by Product ($ billion)

    8 Customer Landscape

    • 8.1 Customer landscape overview
      • Exhibit 66: Analysis of price sensitivity, lifecycle, customer purchase basket, adoption rates, and purchase criteria

    9 Geographic Landscape

    • 9.1 Geographic segmentation
      • Exhibit 67: Chart on Market share by geography 2023-2028 (%)
      • Exhibit 68: Data Table on Market share by geography 2023-2028 (%)
    • 9.2 Geographic comparison
      • Exhibit 69: Chart on Geographic comparison
      • Exhibit 70: Data Table on Geographic comparison
    • 9.3 APAC - Market size and forecast 2023-2028
      • Exhibit 71: Chart on APAC - Market size and forecast 2023-2028 ($ billion)
      • Exhibit 72: Data Table on APAC - Market size and forecast 2023-2028 ($ billion)
      • Exhibit 73: Chart on APAC - Year-over-year growth 2023-2028 (%)
      • Exhibit 74: Data Table on APAC - Year-over-year growth 2023-2028 (%)
    • 9.4 North America - Market size and forecast 2023-2028
      • Exhibit 75: Chart on North America - Market size and forecast 2023-2028 ($ billion)
      • Exhibit 76: Data Table on North America - Market size and forecast 2023-2028 ($ billion)
      • Exhibit 77: Chart on North America - Year-over-year growth 2023-2028 (%)
      • Exhibit 78: Data Table on North America - Year-over-year growth 2023-2028 (%)
    • 9.5 Europe - Market size and forecast 2023-2028
      • Exhibit 79: Chart on Europe - Market size and forecast 2023-2028 ($ billion)
      • Exhibit 80: Data Table on Europe - Market size and forecast 2023-2028 ($ billion)
      • Exhibit 81: Chart on Europe - Year-over-year growth 2023-2028 (%)
      • Exhibit 82: Data Table on Europe - Year-over-year growth 2023-2028 (%)
    • 9.6 South America - Market size and forecast 2023-2028
      • Exhibit 83: Chart on South America - Market size and forecast 2023-2028 ($ billion)
      • Exhibit 84: Data Table on South America - Market size and forecast 2023-2028 ($ billion)
      • Exhibit 85: Chart on South America - Year-over-year growth 2023-2028 (%)
      • Exhibit 86: Data Table on South America - Year-over-year growth 2023-2028 (%)
    • 9.7 Middle East and Africa - Market size and forecast 2023-2028
      • Exhibit 87: Chart on Middle East and Africa - Market size and forecast 2023-2028 ($ billion)
      • Exhibit 88: Data Table on Middle East and Africa - Market size and forecast 2023-2028 ($ billion)
      • Exhibit 89: Chart on Middle East and Africa - Year-over-year growth 2023-2028 (%)
      • Exhibit 90: Data Table on Middle East and Africa - Year-over-year growth 2023-2028 (%)
    • 9.8 China - Market size and forecast 2023-2028
      • Exhibit 91: Chart on China - Market size and forecast 2023-2028 ($ billion)
      • Exhibit 92: Data Table on China - Market size and forecast 2023-2028 ($ billion)
      • Exhibit 93: Chart on China - Year-over-year growth 2023-2028 (%)
      • Exhibit 94: Data Table on China - Year-over-year growth 2023-2028 (%)
    • 9.9 India - Market size and forecast 2023-2028
      • Exhibit 95: Chart on India - Market size and forecast 2023-2028 ($ billion)
      • Exhibit 96: Data Table on India - Market size and forecast 2023-2028 ($ billion)
      • Exhibit 97: Chart on India - Year-over-year growth 2023-2028 (%)
      • Exhibit 98: Data Table on India - Year-over-year growth 2023-2028 (%)
    • 9.10 US - Market size and forecast 2023-2028
      • Exhibit 99: Chart on US - Market size and forecast 2023-2028 ($ billion)
      • Exhibit 100: Data Table on US - Market size and forecast 2023-2028 ($ billion)
      • Exhibit 101: Chart on US - Year-over-year growth 2023-2028 (%)
      • Exhibit 102: Data Table on US - Year-over-year growth 2023-2028 (%)
    • 9.11 Japan - Market size and forecast 2023-2028
      • Exhibit 103: Chart on Japan - Market size and forecast 2023-2028 ($ billion)
      • Exhibit 104: Data Table on Japan - Market size and forecast 2023-2028 ($ billion)
      • Exhibit 105: Chart on Japan - Year-over-year growth 2023-2028 (%)
      • Exhibit 106: Data Table on Japan - Year-over-year growth 2023-2028 (%)
    • 9.12 Vietnam - Market size and forecast 2023-2028
      • Exhibit 107: Chart on Vietnam - Market size and forecast 2023-2028 ($ billion)
      • Exhibit 108: Data Table on Vietnam - Market size and forecast 2023-2028 ($ billion)
      • Exhibit 109: Chart on Vietnam - Year-over-year growth 2023-2028 (%)
      • Exhibit 110: Data Table on Vietnam - Year-over-year growth 2023-2028 (%)
    • 9.13 Market opportunity by geography
      • Exhibit 111: Market opportunity by geography ($ billion)
      • Exhibit 112: Data Tables on Market opportunity by geography ($ billion)

    10 Drivers, Challenges, and Trends

    • 10.1 Market drivers
      • 10.2 Market challenges
        • 10.3 Impact of drivers and challenges
          • Exhibit 113: Impact of drivers and challenges in 2023 and 2028
        • 10.4 Market trends

          11 Vendor Landscape

          • 11.1 Overview
            • 11.2 Vendor landscape
              • Exhibit 114: Overview on Criticality of inputs and Factors of differentiation
            • 11.3 Landscape disruption
              • Exhibit 115: Overview on factors of disruption
            • 11.4 Industry risks
              • Exhibit 116: Impact of key risks on business

            12 Vendor Analysis

            • 12.1 Vendors covered
              • Exhibit 117: Vendors covered
            • 12.2 Market positioning of vendors
              • Exhibit 118: Matrix on vendor position and classification
            • 12.3 ATE Pvt. Ltd.
              • Exhibit 119: ATE Pvt. Ltd. - Overview
              • Exhibit 120: ATE Pvt. Ltd. - Product / Service
              • Exhibit 121: ATE Pvt. Ltd. - Key offerings
            • 12.4 Amarnaathh Engineering
              • Exhibit 122: Amarnaathh Engineering - Overview
              • Exhibit 123: Amarnaathh Engineering - Product / Service
              • Exhibit 124: Amarnaathh Engineering - Key offerings
            • 12.5 Camozzi Group SPA
              • Exhibit 125: Camozzi Group SPA - Overview
              • Exhibit 126: Camozzi Group SPA - Product / Service
              • Exhibit 127: Camozzi Group SPA - Key offerings
            • 12.6 JWELL Intelligent Machinery Co. Ltd.
              • Exhibit 128: JWELL Intelligent Machinery Co. Ltd. - Overview
              • Exhibit 129: JWELL Intelligent Machinery Co. Ltd. - Product / Service
              • Exhibit 130: JWELL Intelligent Machinery Co. Ltd. - Key offerings
            • 12.7 Lakshmi Machine Works Ltd.
              • Exhibit 131: Lakshmi Machine Works Ltd. - Overview
              • Exhibit 132: Lakshmi Machine Works Ltd. - Business segments
              • Exhibit 133: Lakshmi Machine Works Ltd. - Key offerings
              • Exhibit 134: Lakshmi Machine Works Ltd. - Segment focus
            • 12.8 Murata Machinery Ltd.
              • Exhibit 135: Murata Machinery Ltd. - Overview
              • Exhibit 136: Murata Machinery Ltd. - Business segments
              • Exhibit 137: Murata Machinery Ltd. - Key offerings
              • Exhibit 138: Murata Machinery Ltd. - Segment focus
            • 12.9 Prism Machinery Ltd.
              • Exhibit 139: Prism Machinery Ltd. - Overview
              • Exhibit 140: Prism Machinery Ltd. - Product / Service
              • Exhibit 141: Prism Machinery Ltd. - Key offerings
            • 12.10 Rieter Holding AG
              • Exhibit 142: Rieter Holding AG - Overview
              • Exhibit 143: Rieter Holding AG - Business segments
              • Exhibit 144: Rieter Holding AG - Key offerings
              • Exhibit 145: Rieter Holding AG - Segment focus
            • 12.11 SAURER AG
              • Exhibit 146: SAURER AG - Overview
              • Exhibit 147: SAURER AG - Product / Service
              • Exhibit 148: SAURER AG - Key offerings
            • 12.12 Shandong Rifa Textile Machinery Co. Ltd.
              • Exhibit 149: Shandong Rifa Textile Machinery Co. Ltd. - Overview
              • Exhibit 150: Shandong Rifa Textile Machinery Co. Ltd. - Product / Service
              • Exhibit 151: Shandong Rifa Textile Machinery Co. Ltd. - Key offerings
            • 12.13 SSB Tex Engineering
              • Exhibit 152: SSB Tex Engineering - Overview
              • Exhibit 153: SSB Tex Engineering - Product / Service
              • Exhibit 154: SSB Tex Engineering - Key offerings
            • 12.14 Toyota Industries Corp.
              • Exhibit 155: Toyota Industries Corp. - Overview
              • Exhibit 156: Toyota Industries Corp. - Business segments
              • Exhibit 157: Toyota Industries Corp. - Key news
              • Exhibit 158: Toyota Industries Corp. - Key offerings
              • Exhibit 159: Toyota Industries Corp. - Segment focus
            • 12.15 Trutzschler Group SE
              • Exhibit 160: Trutzschler Group SE - Overview
              • Exhibit 161: Trutzschler Group SE - Product / Service
              • Exhibit 162: Trutzschler Group SE - Key offerings
            • 12.16 VANDEWIELE NV
              • Exhibit 163: VANDEWIELE NV - Overview
              • Exhibit 164: VANDEWIELE NV - Product / Service
              • Exhibit 165: VANDEWIELE NV - Key offerings
            • 12.17 Zhejiang Taitan Co. Ltd.
              • Exhibit 166: Zhejiang Taitan Co. Ltd. - Overview
              • Exhibit 167: Zhejiang Taitan Co. Ltd. - Product / Service
              • Exhibit 168: Zhejiang Taitan Co. Ltd. - Key offerings

            13 Appendix

            • 13.1 Scope of the report
              • 13.2 Inclusions and exclusions checklist
                • Exhibit 169: Inclusions checklist
                • Exhibit 170: Exclusions checklist
              • 13.3 Currency conversion rates for US$
                • Exhibit 171: Currency conversion rates for US$
              • 13.4 Research methodology
                • Exhibit 172: Research methodology
                • Exhibit 173: Validation techniques employed for market sizing
                • Exhibit 174: Information sources
              • 13.5 List of abbreviations
                • Exhibit 175: List of abbreviations

              Research Methodology

              Technavio presents a detailed picture of the market by way of study, synthesis, and summation of data from multiple sources. The analysts have presented the various facets of the market with a particular focus on identifying the key industry influencers. The data thus presented is comprehensive, reliable, and the result of extensive research, both primary and secondary.

              INFORMATION SOURCES

              Primary sources

              • Manufacturers and suppliers
              • Channel partners
              • Industry experts
              • Strategic decision makers

              Secondary sources

              • Industry journals and periodicals
              • Government data
              • Financial reports of key industry players
              • Historical data
              • Press releases

              DATA ANALYSIS

              Data Synthesis

              • Collation of data
              • Estimation of key figures
              • Analysis of derived insights

              Data Validation

              • Triangulation with data models
              • Reference against proprietary databases
              • Corroboration with industry experts

              REPORT WRITING

              Qualitative

              • Market drivers
              • Market challenges
              • Market trends
              • Five forces analysis

              Quantitative

              • Market size and forecast
              • Market segmentation
              • Geographical insights
              • Competitive landscape

              Interested in this report?

              Get your sample now to see our research methodology and insights!

              Download Now

              Frequently Asked Questions

              Spinning Machinery market growth will increase by $ 2.24 bn during 2024-2028 .

              The Spinning Machinery market is expected to grow at a CAGR of 6.56% during 2024-2028 .

              Spinning Machinery market is segmented by Application( Textiles, Clothing, Others) Product( Short-staple spindles, Long-staple spindles, Open-end rotors)

              ATE Pvt. Ltd., Amarnaathh Engineering, Bonfiglioli Riduttori Spa, Camozzi Group SPA, DS Machinery Makers, Jutex Industries Pvt. Ltd., JWELL Intelligent Machinery Co. Ltd., Lakshmi Machine Works Ltd., Murata Machinery Ltd., Naugra Machines India, Perfect Equipments Pvt. Ltd., Prism Machinery Ltd., Rieter Holding AG, SAURER AG, Shandong Rifa Textile Machinery Co. Ltd., SSB Tex Engineering, Toyota Industries Corp., Trutzschler Group SE, VANDEWIELE NV, Zhejiang Taitan Co. Ltd. are a few of the key vendors in the Spinning Machinery market.

              APAC will register the highest growth rate of 70% among the other regions. Therefore, the Spinning Machinery market in APAC is expected to garner significant business opportunities for the vendors during the forecast period.

              US, China, India, Japan, Vietnam

              • Increasing adoption of sustainable manufacturing practicesRising awareness of environmental issues and sustainable practices has led to an increased demand for spinning machinery that incorporates eco-friendly features. The increasing adoption of sustainable spinning practices that render minimal environmental impact is the driving factor this market.
              • maximum savings in electric power consumption is the driving factor this market.
              • and optimal utilization of resources are driving the growth of the global spinning machinery market. For instance is the driving factor this market.
              • Rieter Holding AG develops sustainable spinning machines and systems and services to save energy is the driving factor this market.
              • optimize resource utilization and produce efficiently and economically is the driving factor this market.
              • and increase competitiveness in the market. Innovative solutions is the driving factor this market.
              • such as ensuring optimum raw material utilization and reducing fiber consumption and processing of sustainable and recycled fibers is the driving factor this market.
              • help in the sustainable use of raw materials and increase the customer demand for sustainable fibers. Therefore is the driving factor this market.
              • the increasing adoption of sustainable manufacturing practices in the spinning industry will drive the growth of the global spinning machinery market during the forecast period. is the driving factor this market.

              The Spinning Machinery market vendors should focus on grabbing business opportunities from the Textiles segment as it accounted for the largest market share in the base year.