Stevedoring and Marine Cargo Handling Market Analysis APAC, Europe, North America, Middle East and Africa, South America - US, China, Japan, Germany, France - Size and Forecast 2024-2028

Stevedoring and Marine Cargo Handling Market Analysis APAC, Europe, North America, Middle East and Africa, South America - US, China, Japan, Germany, France - Size and Forecast 2024-2028

Published: Mar 2024 153 Pages SKU: IRTNTR77748

Market Overview at a Glance

$2.66 B
Market Opportunity
4.45%
CAGR
4.15
YoY growth 2023-2024(%)

Stevedoring and Marine Cargo Handling Market Size 2024-2028 

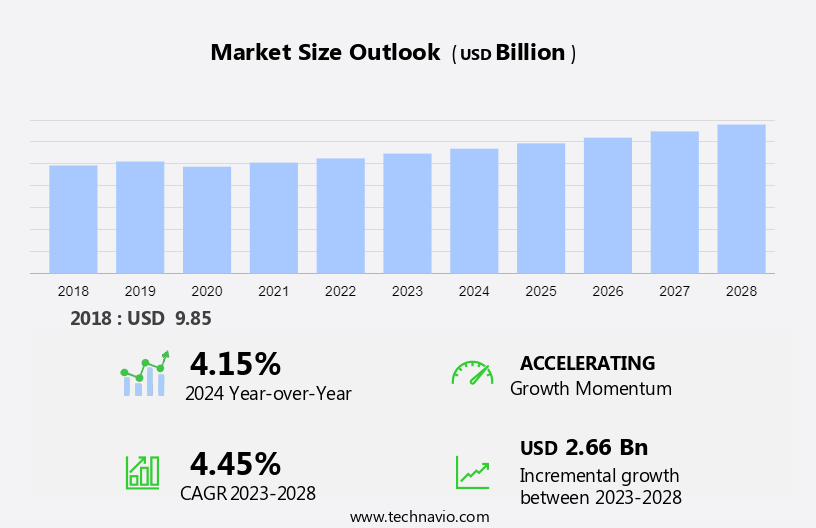
The stevedoring and marine cargo handling market size is forecast to increase by USD 2.66 billion at a CAGR of 4.45% between 2023 and 2028. The market is witnessing significant growth due to the increasing adoption of containerization as a more efficient and cost-effective method for transporting goods. This trend is particularly evident in international trade, where container ships dominate the seaborne trade landscape. Another key trend is the emergence of smart ports and IoT integration in stevedoring and marine cargo handling, which enhances operational efficiency and reduces errors.

Furthermore, congestion issues in ports and terminals continue to pose a challenge, necessitating the adoption of advanced technologies and strategies to streamline operations and improve turnaround times. Overall, the market is expected to experience strong growth in the coming years, driven by these and other factors.

Stevedoring and Marine Cargo Handling Market Size

 Request Free Sample

The market is experiencing significant growth due to the privatization of ports and the increasing volume of seaborne trade. The market is driven by the rise in waterborne transportation of containerized cargo shipping, gas shipping, and dry bulk shipping. Automated technology, online commerce, and the digital transformation of maritime logistics are also key factors fueling market growth. Cargo handling equipment, such as forklift trucks and cranes, play a crucial role in the efficient handling of marine cargo. The market is also influenced by inflation, which affects the cost of fuel and cargo handling services. Fuel efficiency and emission norms are becoming increasingly important in the shipping industry, leading to the adoption of market and novel technologies.

Furthermore, the market for cargo handling in the maritime industry caters to various sectors, including crude oil shipments, gas shipping, and dry bulk shipping. The market is further segmented into containerized cargo and non-containerized cargo. Air cargo movement is another important aspect of the market, which is influenced by factors such as fuel efficiency, propulsion type, and secure transportation. The market is expected to grow at a steady pace due to the increasing demand for low-cost transportation and the secure transportation of goods. The integration of automation and e-commerce is also expected to drive market growth. Despite these opportunities, the market faces challenges such as inflation, emission norms, and the need for advanced cargo-handling equipment.

Market Segmentation

The market research report provides comprehensive data (region-wise segment analysis), with forecasts and estimates in "USD Billion" for the period 2024-2028, as well as historical data from 2018 - 2022 for the following segments.

  • Type
    • Bulk Cargo
    • Containerized cargo
    • Others
  • Service
    • Stevedoring
    • Cargo handling and transportation
    • Others
  • Geography
    • APAC
      • China
      • Japan
    • Europe
      • Germany
      • France
    • North America
      • US
    • Middle East and Africa
    • South America

By Type Insights

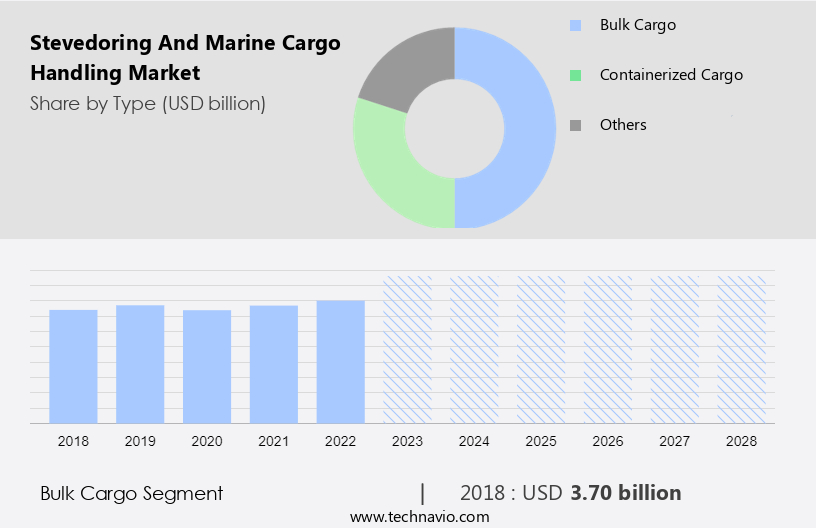
The bulk cargo segment is estimated to witness significant growth during the forecast period. The maritime industry encompasses various sectors, including marine cargo handling, which is undergoing significant transformation due to privatization, automation, and inflation. Marine cargo handling involves the efficient movement and stacking of diverse cargoes, such as containerized goods, dry bulk shipping, gas shipping, and crude oil shipments, at marine ports. Stevedoring companies specialize in this process, utilizing specialized cargo handling equipment, including cranes, forklift trucks, and conveyor systems. Waterborne transportation plays a crucial role in global trade, with seaborne trade volume accounting for a substantial proportion of international commerce. Macroeconomic headwinds, such as retail sales, industrial production, and e-commerce growth, impact the demand for cargo handling services.

Furthermore, automated technology, including online commerce, has transformed the logistics landscape, necessitating the need for low-cost, secure, and fuel-efficient transportation solutions. Fuel efficiency and emission norms are critical considerations for cargo transportation, with market and propulsion type gaining prominence. Air cargo movement complements seaborne trade, but its growth is influenced by factors such as fuel costs and competition from e-commerce. Stevedoring companies adapt to these trends by investing in novel technologies and optimizing their operations to cater to the unique requirements of various cargo types.

Stevedoring and Marine Cargo Handling Market Size

Get a glance at the market share of various segments Request Free Sample

The bulk cargo segment was valued at USD 3.70 billion in 2018 and showed a gradual increase during the forecast period.

Regional Insights

APAC is estimated to contribute 42% to the growth of the global market during the forecast period. Technavio's analysts have elaborately explained the regional trends and drivers that shape the market during the forecast period.

Stevedoring and Marine Cargo Handling Market Share by Geography

For more insights on the market share of various regions Request Free Sample

In the APAC region, the shipping industry experiences continuous growth due to increasing international trade activities driven by economic development, industrialization, and globalization. This wave in trade volumes, consisting of various cargo types such as manufactured goods, raw materials, energy products, and agricultural commodities, necessitates efficient cargo handling and port services. The transformation of maritime logistics through containerization has become the preferred mode of cargo transportation in the APAC region, accounting for a significant portion of maritime trade. Container handling services, container terminals, and specialized equipment for handling containerized cargo are in high demand. Stevedoring companies are essential players in this sector, supporting efficient container movement and transshipment activities.

Moreover, the adoption of Digital transformation in the maritime industry, including IoT, AI, and Blockchain, is revolutionizing cargo handling operations. Real-time cargo positioning data, vessel deployment, and port call optimization facilitate more effective and sustainable shipping operations. Empty back-haul trips are minimized through efficient trade agreements and multimodal transportation. Sustainable energy sources are being integrated into shipping operations to reduce carbon emissions and promote eco-friendly maritime transport. The stevedoring market caters to various cargo types, including general cargo, bulk cargo (dry and liquid), neo-bulk, and specialized cargo, necessitating versatile handling capabilities. Vessel chartering, crew management, and infrastructure investment are other key areas where stevedoring companies contribute to the overall efficiency of the maritime supply chain.

Our researchers analyzed the data with 2023 as the base year, along with the key drivers, trends, and challenges. A holistic analysis of drivers will help companies refine their marketing strategies to gain a competitive advantage.

Stevedoring and Marine Cargo Handling Market Driver

Growing adoption of containerization is the key driver of the market. The privatization of marine cargo handling has significantly transformed the maritime trade landscape, particularly in the handling of containerized cargo. Containerization has become a dominant mode of waterborne transportation due to its efficiency in packing and transporting a diverse range of goods, from manufactured products and raw materials to consumer goods. This trend has driven the demand for stevedoring services, which optimize cargo handling operations at marine ports. Container handling equipment, such as container cranes, reach stackers, and straddle carriers, have automated and streamlined the process, reducing the need for manual labor and enhancing space utilization. The growth of online commerce and e-retail has further fueled the demand for efficient and secure cargo handling, as retail sales shift towards digital platforms.

Moreover, the adoption of automation and advanced technologies, including electric forklift trucks and automated guided vehicles, has improved fuel efficiency and reduced emissions, aligning with emission norms and the electric market's growing importance. The maritime logistics industry is also adapting to macroeconomic headwinds, such as inflation and retail market trends, by focusing on low-cost transportation and secure transportation solutions. In addition to containerized cargo, the stevedoring and cargo handling market caters to various other cargo types, including gas shipping, dry bulk shipping, and crude oil shipments. Air cargo movement is another critical component of the logistics industry, and the adoption of automation and advanced technologies is transforming this sector as well.

Stevedoring and Marine Cargo Handling Market Trends

The emergence of smart ports and IoT integration in stevedoring and marine cargo handling is the upcoming trend in the market. The maritime industry, specifically marine cargo handling, has undergone significant transformations with the advent of privatization and automation. The global market for marine cargo handling is driven by various factors, including the growth in waterborne transportation, inflated retail sales due to online commerce, and macroeconomic headwinds such as industrial production and retail market trends. Seaborne trade volume has witnessed a wave in containerized cargo, gas shipping, and crude oil shipments. Automated technology, such as IoT devices and sensors, plays a crucial role in enhancing the efficiency of cargo handling operations. Smart ports integrate IoT technology into cargo handling equipment, terminals, and infrastructure to collect real-time data on container movements, equipment status, weather conditions, and environmental parameters. This data enables seamless connectivity and data exchange between different systems and stakeholders, leading to optimized resource allocation and improved operational efficiency.

Moreover, the increasing popularity of e-commerce and the need for low-cost and secure transportation have led to the adoption of electric and automated cargo handling equipment, such as forklift trucks. Fuel efficiency and emission norms are also major considerations in the marine cargo handling market. The electric market is expected to grow significantly due to the shift towards cleaner propulsion types. Air cargo movement also plays a vital role in the logistics industry, and the integration of IoT technology in air cargo handling has led to improved efficiency and productivity. The future of marine and land cargo handling lies in the adoption of novel technologies, such as automation, data analytics, and predictive modeling, to optimize resource allocation and enhance productivity.

Stevedoring and Marine Cargo Handling Market Challenge

Congestion issues in ports and terminals is a key challenge affecting the market growth. The privatization of marine cargo handling has significantly transformed the maritime industry, particularly in the realm of waterborne transportation. With the tide in maritime trade, driven by factors such as inflation, retail sales, e-commerce, and industrial production, the volume of containerized cargo, gas shipping, dry bulk shipping, and crude oil shipments has escalated. This growth has led to an increased demand for efficient cargo handling, including cargo stacking and automation. Automated technology, such as online commerce and automated cargo handling equipment, has become essential in addressing the challenges posed by the influx of cargo. Forklift trucks, powered by diesel and electric, play a crucial role in the handling process.

However, the increasing focus on fuel efficiency and emission norms has led to the adoption of electric and alternative propulsion types. Moreover, the integration of novel technologies, like automation and e-commerce, has revolutionized the logistics landscape. Seaborne trade volume continues to grow, and air cargo movement remains a critical component of the global supply chain. Despite these advancements, macroeconomic headwinds, such as inflation and retail market trends, pose challenges to the industry. The need for secure transportation, low-cost solutions, and adherence to emission norms remains a priority for stakeholders.

Exclusive Customer Landscape

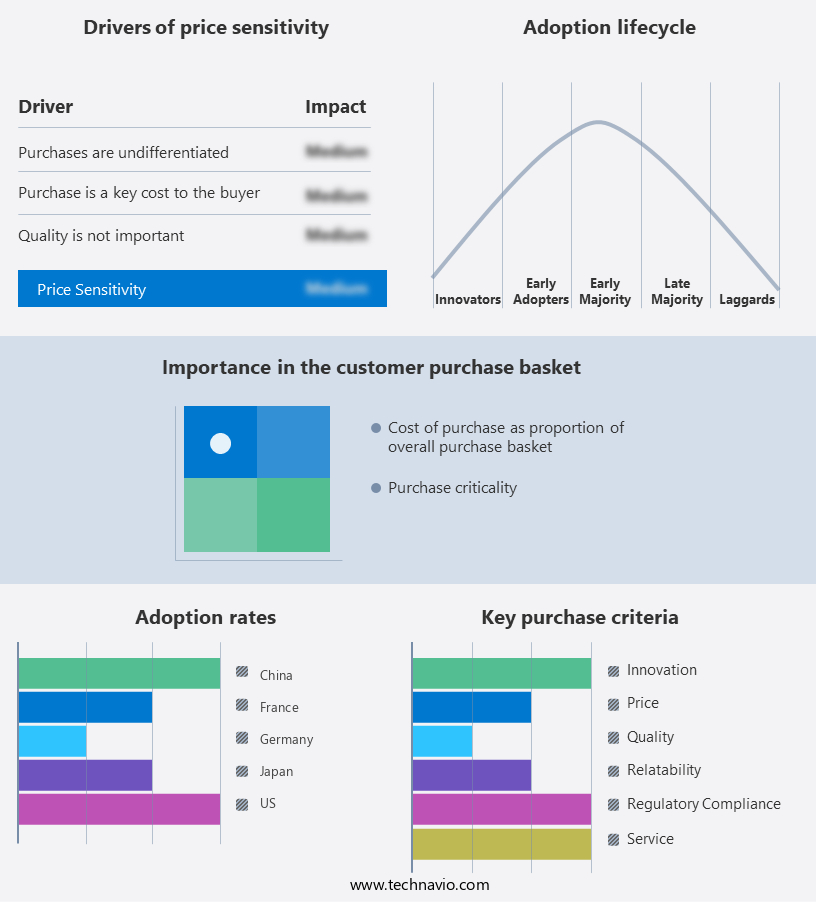
The market forecasting report includes the adoption lifecycle of the market, covering from the innovator's stage to the laggard's stage. It focuses on adoption rates in different regions based on penetration. Furthermore, the report also includes key purchase criteria and drivers of price sensitivity to help companies evaluate and develop their market growth analysis strategies.

Stevedoring and Marine Cargo Handling Market Share by Geography

 Customer Landscape

Key Companies & Market Insights

Companies are implementing various strategies, such as strategic alliances, partnerships, mergers and acquisitions, geographical expansion, and product/service launches, to enhance their presence in the market.

  • APS Stevedoring LLC - The company provides specialized stevedoring and marine cargo handling services for various types of cargoes, including automobiles, general merchandise, and breakbulk goods.

The market research and growth report includes detailed analyses of the competitive landscape of the market and information about key companies, including:

  • APS Stevedoring LLC
  • Blue Water Shipping AS
  • Bothra Group
  • Carver Companies.
  • CHARLESTON STEVEDORING COMPANY LLC
  • CJ Logistics Corp.
  • CMA CGM SA Group
  • Crowley Maritime Corp.
  • Deutsche Post AG
  • Enstructure
  • Hapag Lloyd AG
  • Japan Transcity Corp.
  • Jones Stevedoring
  • King Ocean Services Ltd.
  • Newcastle Stevedores
  • Orissa Stevedores Ltd.
  • Richardson Companies
  • Shannon Foynes Port
  • Texas Stevedoring Services LLC
  • The Cooper Group

Qualitative and quantitative analysis of companies has been conducted to help clients understand the wider business environment as well as the strengths and weaknesses of key market players. Data is qualitatively analyzed to categorize companies as pure play, category-focused, industry-focused, and diversified; it is quantitatively analyzed to categorize companies as dominant, leading, strong, tentative, and weak.

Research Analyst Overview

The market is witnessing significant growth due to the privatization of marine ports and the increasing volume of containerized cargo in waterborne transportation. The automation of cargo handling processes, including cargo stacking and the use of automated technology, is also driving market growth. Online commerce and retail sales are major contributors to the maritime trade of containerized cargo, particularly in e-commerce. Macroeconomic headwinds such as inflation and retail market trends are influencing the demand for low-cost transportation and secure transportation of various commodities, including dry bulk shipping, gas shipping, and crude oil shipments.

Further, cargo handling equipment, such as forklift trucks, is becoming increasingly important in the efficient handling of cargo, with a shift towards fuel efficiency and emission norms. The electric market is gaining traction in the propulsion type of marine cargo, land cargo, and air cargo. Novel technologies, including automation and electrification, are expected to revolutionize the cargo handling industry in the coming years.

Market Scope

Report Coverage

Details

Page number

153

Base year

2023

Historic period

2018-2022

Forecast period

2024-2028

Growth momentum & CAGR

Accelerate at a CAGR of 4.45%

Market Growth 2024-2028

USD 2.66 billion

Market structure

Fragmented

YoY growth 2023-2024(%)

4.15

Regional analysis

APAC, Europe, North America, Middle East and Africa, and South America

Performing market contribution

APAC at 42%

Key countries

US, China, Japan, Germany, and France

Competitive landscape

Leading Companies, Market Positioning of Companies, Competitive Strategies, and Industry Risks

Key companies profiled

APS Stevedoring LLC, Blue Water Shipping AS, Bothra Group, Carver Companies., CHARLESTON STEVEDORING COMPANY LLC, CJ Logistics Corp., CMA CGM SA Group, Crowley Maritime Corp., Deutsche Post AG, Enstructure, Hapag Lloyd AG, Japan Transcity Corp., Jones Stevedoring, King Ocean Services Ltd., Newcastle Stevedores, Orissa Stevedores Ltd., Richardson Companies, Shannon Foynes Port, Texas Stevedoring Services LLC, and The Cooper Group

Market dynamics

Parent market analysis, market growth inducers and obstacles, market forecast, fast-growing and slow-growing segment analysis, COVID-19 impact and recovery analysis and future consumer dynamics, market condition analysis for the forecast period

Customization purview

If our market report has not included the data that you are looking for, you can reach out to our analysts and get segments customized.

Request Free Sample

What are the Key Data Covered in this Market Research and Growth Report?

  • CAGR of the market during the forecast period
  • Detailed information on factors that will drive the market growth and forecasting between 2024 and 2028
  • Precise estimation of the size of the market  and its contribution of the market in focus to the parent market
  • Accurate predictions about upcoming market growth and trends and changes in consumer behaviour
  • Growth of the market across APAC, Europe, North America, Middle East and Africa, and South America
  • Thorough analysis of the market's competitive landscape and detailed information about companies
  • Comprehensive analysis of factors that will challenge the growth of market companies

We can help! Our analysts can customize this market research report to meet your requirements. Get in touch

1 Executive Summary

  • 1.1 Market overview
    • Exhibit 01: Executive Summary – Chart on Market Overview
    • Exhibit 02: Executive Summary – Data Table on Market Overview
    • Exhibit 03: Executive Summary – Chart on Global Market Characteristics
    • Exhibit 04: Executive Summary – Chart on Market by Geography
    • Exhibit 05: Executive Summary – Chart on Market Segmentation by Type
    • Exhibit 06: Executive Summary – Chart on Market Segmentation by Service
    • Exhibit 07: Executive Summary – Chart on Incremental Growth
    • Exhibit 08: Executive Summary – Data Table on Incremental Growth
    • Exhibit 09: Executive Summary – Chart on Vendor Market Positioning

2 Market Landscape

  • 2.1 Market ecosystem
    • Exhibit 10: Parent market
    • Exhibit 11: Market Characteristics

3 Market Sizing

  • 3.1 Market definition
    • Exhibit 12: Offerings of vendors included in the market definition
  • 3.2 Market segment analysis
    • Exhibit 13: Market segments
  • 3.3 Market size 2023
    • 3.4 Market outlook: Forecast for 2023-2028
      • Exhibit 14: Chart on Global - Market size and forecast 2023-2028 ($ billion)
      • Exhibit 15: Data Table on Global - Market size and forecast 2023-2028 ($ billion)
      • Exhibit 16: Chart on Global Market: Year-over-year growth 2023-2028 (%)
      • Exhibit 17: Data Table on Global Market: Year-over-year growth 2023-2028 (%)

    4 Historic Market Size

    • 4.1 Global stevedoring and marine cargo handling market 2018 - 2022
      • Exhibit 18: Historic Market Size – Data Table on global stevedoring and marine cargo handling market 2018 - 2022 ($ billion)
    • 4.2 Type Segment Analysis 2018 - 2022
      • Exhibit 19: Historic Market Size – Type Segment 2018 - 2022 ($ billion)
    • 4.3 Service Segment Analysis 2018 - 2022
      • Exhibit 20: Historic Market Size – Service Segment 2018 - 2022 ($ billion)
    • 4.4 Geography Segment Analysis 2018 - 2022
      • Exhibit 21: Historic Market Size – Geography Segment 2018 - 2022 ($ billion)
    • 4.5 Country Segment Analysis 2018 - 2022
      • Exhibit 22: Historic Market Size – Country Segment 2018 - 2022 ($ billion)

    5 Five Forces Analysis

    • 5.1 Five forces summary
      • Exhibit 23: Five forces analysis - Comparison between 2023 and 2028
    • 5.2 Bargaining power of buyers
      • Exhibit 24: Chart on Bargaining power of buyers – Impact of key factors 2023 and 2028
    • 5.3 Bargaining power of suppliers
      • Exhibit 25: Bargaining power of suppliers – Impact of key factors in 2023 and 2028
    • 5.4 Threat of new entrants
      • Exhibit 26: Threat of new entrants – Impact of key factors in 2023 and 2028
    • 5.5 Threat of substitutes
      • Exhibit 27: Threat of substitutes – Impact of key factors in 2023 and 2028
    • 5.6 Threat of rivalry
      • Exhibit 28: Threat of rivalry – Impact of key factors in 2023 and 2028
    • 5.7 Market condition
      • Exhibit 29: Chart on Market condition - Five forces 2023 and 2028

    6 Market Segmentation by Type

    • 6.1 Market segments
      • Exhibit 30: Chart on Type - Market share 2023-2028 (%)
      • Exhibit 31: Data Table on Type - Market share 2023-2028 (%)
    • 6.2 Comparison by Type
      • Exhibit 32: Chart on Comparison by Type
      • Exhibit 33: Data Table on Comparison by Type
    • 6.3 Bulk cargo - Market size and forecast 2023-2028
      • Exhibit 34: Chart on Bulk cargo - Market size and forecast 2023-2028 ($ billion)
      • Exhibit 35: Data Table on Bulk cargo - Market size and forecast 2023-2028 ($ billion)
      • Exhibit 36: Chart on Bulk cargo - Year-over-year growth 2023-2028 (%)
      • Exhibit 37: Data Table on Bulk cargo - Year-over-year growth 2023-2028 (%)
    • 6.4 Containerized cargo - Market size and forecast 2023-2028
      • Exhibit 38: Chart on Containerized cargo - Market size and forecast 2023-2028 ($ billion)
      • Exhibit 39: Data Table on Containerized cargo - Market size and forecast 2023-2028 ($ billion)
      • Exhibit 40: Chart on Containerized cargo - Year-over-year growth 2023-2028 (%)
      • Exhibit 41: Data Table on Containerized cargo - Year-over-year growth 2023-2028 (%)
    • 6.5 Others - Market size and forecast 2023-2028
      • Exhibit 42: Chart on Others - Market size and forecast 2023-2028 ($ billion)
      • Exhibit 43: Data Table on Others - Market size and forecast 2023-2028 ($ billion)
      • Exhibit 44: Chart on Others - Year-over-year growth 2023-2028 (%)
      • Exhibit 45: Data Table on Others - Year-over-year growth 2023-2028 (%)
    • 6.6 Market opportunity by Type
      • Exhibit 46: Market opportunity by Type ($ billion)
      • Exhibit 47: Data Table on Market opportunity by Type ($ billion)

    7 Market Segmentation by Service

    • 7.1 Market segments
      • Exhibit 48: Chart on Service - Market share 2023-2028 (%)
      • Exhibit 49: Data Table on Service - Market share 2023-2028 (%)
    • 7.2 Comparison by Service
      • Exhibit 50: Chart on Comparison by Service
      • Exhibit 51: Data Table on Comparison by Service
    • 7.3 Stevedoring - Market size and forecast 2023-2028
      • Exhibit 52: Chart on Stevedoring - Market size and forecast 2023-2028 ($ billion)
      • Exhibit 53: Data Table on Stevedoring - Market size and forecast 2023-2028 ($ billion)
      • Exhibit 54: Chart on Stevedoring - Year-over-year growth 2023-2028 (%)
      • Exhibit 55: Data Table on Stevedoring - Year-over-year growth 2023-2028 (%)
    • 7.4 Cargo handling and transportation - Market size and forecast 2023-2028
      • Exhibit 56: Chart on Cargo handling and transportation - Market size and forecast 2023-2028 ($ billion)
      • Exhibit 57: Data Table on Cargo handling and transportation - Market size and forecast 2023-2028 ($ billion)
      • Exhibit 58: Chart on Cargo handling and transportation - Year-over-year growth 2023-2028 (%)
      • Exhibit 59: Data Table on Cargo handling and transportation - Year-over-year growth 2023-2028 (%)
    • 7.5 Others - Market size and forecast 2023-2028
      • Exhibit 60: Chart on Others - Market size and forecast 2023-2028 ($ billion)
      • Exhibit 61: Data Table on Others - Market size and forecast 2023-2028 ($ billion)
      • Exhibit 62: Chart on Others - Year-over-year growth 2023-2028 (%)
      • Exhibit 63: Data Table on Others - Year-over-year growth 2023-2028 (%)
    • 7.6 Market opportunity by Service
      • Exhibit 64: Market opportunity by Service ($ billion)
      • Exhibit 65: Data Table on Market opportunity by Service ($ billion)

    8 Customer Landscape

    • 8.1 Customer landscape overview
      • Exhibit 66: Analysis of price sensitivity, lifecycle, customer purchase basket, adoption rates, and purchase criteria

    9 Geographic Landscape

    • 9.1 Geographic segmentation
      • Exhibit 67: Chart on Market share by geography 2023-2028 (%)
      • Exhibit 68: Data Table on Market share by geography 2023-2028 (%)
    • 9.2 Geographic comparison
      • Exhibit 69: Chart on Geographic comparison
      • Exhibit 70: Data Table on Geographic comparison
    • 9.3 APAC - Market size and forecast 2023-2028
      • Exhibit 71: Chart on APAC - Market size and forecast 2023-2028 ($ billion)
      • Exhibit 72: Data Table on APAC - Market size and forecast 2023-2028 ($ billion)
      • Exhibit 73: Chart on APAC - Year-over-year growth 2023-2028 (%)
      • Exhibit 74: Data Table on APAC - Year-over-year growth 2023-2028 (%)
    • 9.4 Europe - Market size and forecast 2023-2028
      • Exhibit 75: Chart on Europe - Market size and forecast 2023-2028 ($ billion)
      • Exhibit 76: Data Table on Europe - Market size and forecast 2023-2028 ($ billion)
      • Exhibit 77: Chart on Europe - Year-over-year growth 2023-2028 (%)
      • Exhibit 78: Data Table on Europe - Year-over-year growth 2023-2028 (%)
    • 9.5 North America - Market size and forecast 2023-2028
      • Exhibit 79: Chart on North America - Market size and forecast 2023-2028 ($ billion)
      • Exhibit 80: Data Table on North America - Market size and forecast 2023-2028 ($ billion)
      • Exhibit 81: Chart on North America - Year-over-year growth 2023-2028 (%)
      • Exhibit 82: Data Table on North America - Year-over-year growth 2023-2028 (%)
    • 9.6 Middle East and Africa - Market size and forecast 2023-2028
      • Exhibit 83: Chart on Middle East and Africa - Market size and forecast 2023-2028 ($ billion)
      • Exhibit 84: Data Table on Middle East and Africa - Market size and forecast 2023-2028 ($ billion)
      • Exhibit 85: Chart on Middle East and Africa - Year-over-year growth 2023-2028 (%)
      • Exhibit 86: Data Table on Middle East and Africa - Year-over-year growth 2023-2028 (%)
    • 9.7 South America - Market size and forecast 2023-2028
      • Exhibit 87: Chart on South America - Market size and forecast 2023-2028 ($ billion)
      • Exhibit 88: Data Table on South America - Market size and forecast 2023-2028 ($ billion)
      • Exhibit 89: Chart on South America - Year-over-year growth 2023-2028 (%)
      • Exhibit 90: Data Table on South America - Year-over-year growth 2023-2028 (%)
    • 9.8 US - Market size and forecast 2023-2028
      • Exhibit 91: Chart on US - Market size and forecast 2023-2028 ($ billion)
      • Exhibit 92: Data Table on US - Market size and forecast 2023-2028 ($ billion)
      • Exhibit 93: Chart on US - Year-over-year growth 2023-2028 (%)
      • Exhibit 94: Data Table on US - Year-over-year growth 2023-2028 (%)
    • 9.9 China - Market size and forecast 2023-2028
      • Exhibit 95: Chart on China - Market size and forecast 2023-2028 ($ billion)
      • Exhibit 96: Data Table on China - Market size and forecast 2023-2028 ($ billion)
      • Exhibit 97: Chart on China - Year-over-year growth 2023-2028 (%)
      • Exhibit 98: Data Table on China - Year-over-year growth 2023-2028 (%)
    • 9.10 Japan - Market size and forecast 2023-2028
      • Exhibit 99: Chart on Japan - Market size and forecast 2023-2028 ($ billion)
      • Exhibit 100: Data Table on Japan - Market size and forecast 2023-2028 ($ billion)
      • Exhibit 101: Chart on Japan - Year-over-year growth 2023-2028 (%)
      • Exhibit 102: Data Table on Japan - Year-over-year growth 2023-2028 (%)
    • 9.11 Germany - Market size and forecast 2023-2028
      • Exhibit 103: Chart on Germany - Market size and forecast 2023-2028 ($ billion)
      • Exhibit 104: Data Table on Germany - Market size and forecast 2023-2028 ($ billion)
      • Exhibit 105: Chart on Germany - Year-over-year growth 2023-2028 (%)
      • Exhibit 106: Data Table on Germany - Year-over-year growth 2023-2028 (%)
    • 9.12 France - Market size and forecast 2023-2028
      • Exhibit 107: Chart on France - Market size and forecast 2023-2028 ($ billion)
      • Exhibit 108: Data Table on France - Market size and forecast 2023-2028 ($ billion)
      • Exhibit 109: Chart on France - Year-over-year growth 2023-2028 (%)
      • Exhibit 110: Data Table on France - Year-over-year growth 2023-2028 (%)
    • 9.13 Market opportunity by geography
      • Exhibit 111: Market opportunity by geography ($ billion)
      • Exhibit 112: Data Tables on Market opportunity by geography ($ billion)

    10 Drivers, Challenges, and Trends

    • 10.1 Market drivers
      • 10.2 Market challenges
        • 10.3 Impact of drivers and challenges
          • Exhibit 113: Impact of drivers and challenges in 2023 and 2028
        • 10.4 Market trends

          11 Vendor Landscape

          • 11.1 Overview
            • 11.2 Vendor landscape
              • Exhibit 114: Overview on Criticality of inputs and Factors of differentiation
            • 11.3 Landscape disruption
              • Exhibit 115: Overview on factors of disruption
            • 11.4 Industry risks
              • Exhibit 116: Impact of key risks on business

            12 Vendor Analysis

            • 12.1 Vendors covered
              • Exhibit 117: Vendors covered
            • 12.2 Market positioning of vendors
              • Exhibit 118: Matrix on vendor position and classification
            • 12.3 APS Stevedoring LLC
              • Exhibit 119: APS Stevedoring LLC - Overview
              • Exhibit 120: APS Stevedoring LLC - Product / Service
              • Exhibit 121: APS Stevedoring LLC - Key offerings
            • 12.4 Blue Water Shipping AS
              • Exhibit 122: Blue Water Shipping AS - Overview
              • Exhibit 123: Blue Water Shipping AS - Key offerings
            • 12.5 Bothra Group
              • Exhibit 124: Bothra Group - Overview
              • Exhibit 125: Bothra Group - Product / Service
              • Exhibit 126: Bothra Group - Key offerings
            • 12.6 Carver Companies.
              • Exhibit 127: Carver Companies. - Overview
              • Exhibit 128: Carver Companies. - Product / Service
              • Exhibit 129: Carver Companies. - Key offerings
            • 12.7 CHARLESTON STEVEDORING COMPANY LLC
              • Exhibit 130: CHARLESTON STEVEDORING COMPANY LLC - Overview
              • Exhibit 131: CHARLESTON STEVEDORING COMPANY LLC - Product / Service
              • Exhibit 132: CHARLESTON STEVEDORING COMPANY LLC - Key offerings
            • 12.8 CJ Logistics Corp.
              • Exhibit 133: CJ Logistics Corp. - Overview
              • Exhibit 134: CJ Logistics Corp. - Product / Service
              • Exhibit 135: CJ Logistics Corp. - Key offerings
            • 12.9 CMA CGM SA Group
              • Exhibit 136: CMA CGM SA Group - Overview
              • Exhibit 137: CMA CGM SA Group - Business segments
              • Exhibit 138: CMA CGM SA Group - Key news
              • Exhibit 139: CMA CGM SA Group - Key offerings
              • Exhibit 140: CMA CGM SA Group - Segment focus
            • 12.10 Deutsche Post AG
              • Exhibit 141: Deutsche Post AG - Overview
              • Exhibit 142: Deutsche Post AG - Product / Service
              • Exhibit 143: Deutsche Post AG - Key news
              • Exhibit 144: Deutsche Post AG - Key offerings
            • 12.11 Enstructure
              • Exhibit 145: Enstructure - Overview
              • Exhibit 146: Enstructure - Product / Service
              • Exhibit 147: Enstructure - Key news
              • Exhibit 148: Enstructure - Key offerings
            • 12.12 Jones Stevedoring
              • Exhibit 149: Jones Stevedoring - Overview
              • Exhibit 150: Jones Stevedoring - Product / Service
              • Exhibit 151: Jones Stevedoring - Key offerings
            • 12.13 Newcastle Stevedores
              • Exhibit 152: Newcastle Stevedores - Overview
              • Exhibit 153: Newcastle Stevedores - Product / Service
              • Exhibit 154: Newcastle Stevedores - Key offerings
            • 12.14 Richardson Companies
              • Exhibit 155: Richardson Companies - Overview
              • Exhibit 156: Richardson Companies - Product / Service
              • Exhibit 157: Richardson Companies - Key offerings
            • 12.15 Shannon Foynes Port
              • Exhibit 158: Shannon Foynes Port - Overview
              • Exhibit 159: Shannon Foynes Port - Product / Service
              • Exhibit 160: Shannon Foynes Port - Key offerings
            • 12.16 Texas Stevedoring Services LLC
              • Exhibit 161: Texas Stevedoring Services LLC - Overview
              • Exhibit 162: Texas Stevedoring Services LLC - Product / Service
              • Exhibit 163: Texas Stevedoring Services LLC - Key offerings
            • 12.17 The Cooper Group

              13 Appendix

              • 13.1 Scope of the report
                • 13.2 Inclusions and exclusions checklist
                  • Exhibit 167: Inclusions checklist
                  • Exhibit 168: Exclusions checklist
                • 13.3 Currency conversion rates for US$
                  • Exhibit 169: Currency conversion rates for US$
                • 13.4 Research methodology
                  • Exhibit 170: Research methodology
                  • Exhibit 171: Validation techniques employed for market sizing
                  • Exhibit 172: Information sources
                • 13.5 List of abbreviations
                  • Exhibit 173: List of abbreviations

                  Research Methodology

                  Technavio presents a detailed picture of the market by way of study, synthesis, and summation of data from multiple sources. The analysts have presented the various facets of the market with a particular focus on identifying the key industry influencers. The data thus presented is comprehensive, reliable, and the result of extensive research, both primary and secondary.

                  INFORMATION SOURCES

                  Primary sources

                  • Manufacturers and suppliers
                  • Channel partners
                  • Industry experts
                  • Strategic decision makers

                  Secondary sources

                  • Industry journals and periodicals
                  • Government data
                  • Financial reports of key industry players
                  • Historical data
                  • Press releases

                  DATA ANALYSIS

                  Data Synthesis

                  • Collation of data
                  • Estimation of key figures
                  • Analysis of derived insights

                  Data Validation

                  • Triangulation with data models
                  • Reference against proprietary databases
                  • Corroboration with industry experts

                  REPORT WRITING

                  Qualitative

                  • Market drivers
                  • Market challenges
                  • Market trends
                  • Five forces analysis

                  Quantitative

                  • Market size and forecast
                  • Market segmentation
                  • Geographical insights
                  • Competitive landscape

                  Interested in this report?

                  Get your sample now to see our research methodology and insights!

                  Download Now

                  Frequently Asked Questions

                  Stevedoring and Marine Cargo Handling market growth will increase by $ 2.66 bn during 2024-2028 .

                  The Stevedoring and Marine Cargo Handling market is expected to grow at a CAGR of 4.45% during 2024-2028 .

                  Stevedoring and Marine Cargo Handling market is segmented by Type( Bulk Cargo, Containerized cargo, Others) Service( Stevedoring, Cargo handling and transportation, Others)

                  APS Stevedoring LLC, Blue Water Shipping AS, Bothra Group, Carver Companies., CHARLESTON STEVEDORING COMPANY LLC, CJ Logistics Corp., CMA CGM SA Group, Crowley Maritime Corp., Deutsche Post AG, Enstructure, Hapag Lloyd AG, Japan Transcity Corp., Jones Stevedoring, King Ocean Services Ltd., Newcastle Stevedores, Orissa Stevedores Ltd., Richardson Companies, Shannon Foynes Port, Texas Stevedoring Services LLC, The Cooper Group are a few of the key vendors in the Stevedoring and Marine Cargo Handling market.

                  APAC will register the highest growth rate of 42% among the other regions. Therefore, the Stevedoring and Marine Cargo Handling market in APAC is expected to garner significant business opportunities for the vendors during the forecast period.

                  US, China, Japan, Germany, France

                  • Growing adoption of containerizationThe adoption of containerization has led to a substantial increase in cargo volumes handled at ports worldwide. Containers allow for the efficient packing and transport of a wide range of goods is the driving factor this market.
                  • including manufactured products is the driving factor this market.
                  • raw materials is the driving factor this market.
                  • and consumer goods is the driving factor this market.
                  • driving demand for stevedoring and cargo handling services. Containerization streamlines cargo handling operations at ports by reducing the need for manual labor and optimizing space utilization. Containers can be easily loaded is the driving factor this market.
                  • unloaded is the driving factor this market.
                  • and transferred between ships is the driving factor this market.
                  • trucks is the driving factor this market.
                  • and trains using specialized equipment such as container cranes is the driving factor this market.
                  • reach stackers is the driving factor this market.
                  • and straddle carriers is the driving factor this market.
                  • enhancing efficiency in cargo handling processes. Moreover is the driving factor this market.
                  • the growing adoption of containerization has led to the development of specialized container terminals equipped with modern infrastructure is the driving factor this market.
                  • advanced handling equipment is the driving factor this market.
                  • and automated systems to handle containerized cargo efficiently. These container terminals require specialized stevedoring and cargo handling services to manage container operations effectively. Furthermore is the driving factor this market.
                  • containerization improves supply chain efficiency by reducing transit times is the driving factor this market.
                  • minimizing cargo damage is the driving factor this market.
                  • and enhancing cargo security. Standardized container sizes is the driving factor this market.
                  • tracking systems is the driving factor this market.
                  • and container security initiatives contribute to smoother cargo flows and require reliable stevedoring and cargo handling services to maintain operational efficiency. Thus is the driving factor this market.
                  • the growing adoption of containerization will boost the growth of the global stevedoring and marine cargo handling market during the forecast period. is the driving factor this market.

                  The Stevedoring and Marine Cargo Handling market vendors should focus on grabbing business opportunities from the Bulk Cargo segment as it accounted for the largest market share in the base year.