Stockbroking Market Analysis, Size, and Forecast 2026-2030: North America (US, Canada, and Mexico), APAC (China, Japan, and India), Europe (Germany, UK, and France), Middle East and Africa (Saudi Arabia, UAE, and South Africa), South America (Brazil, Argentina, and Colombia), and Rest of World (ROW)

Stockbroking Market Analysis, Size, and Forecast 2026-2030:
North America (US, Canada, and Mexico), APAC (China, Japan, and India), Europe (Germany, UK, and France), Middle East and Africa (Saudi Arabia, UAE, and South Africa), South America (Brazil, Argentina, and Colombia), and Rest of World (ROW)

Published: Mar 2026 280 Pages SKU: IRTNTR75771

Market Overview at a Glance

$31.61 B
Market Opportunity
10.6%
CAGR 2025 - 2030
34.9%
North America Growth
$33.87 B
Offline segment 2024

Stockbroking Market Size 2026-2030

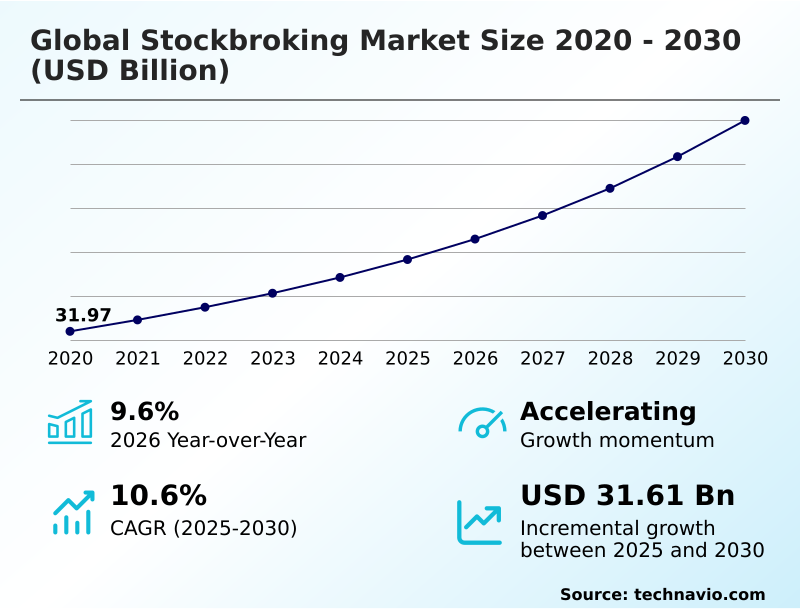
The stockbroking market size is valued to increase by USD 31.61 billion, at a CAGR of 10.6% from 2025 to 2030. Growing need for market surveillance will drive the stockbroking market.

Major Market Trends & Insights

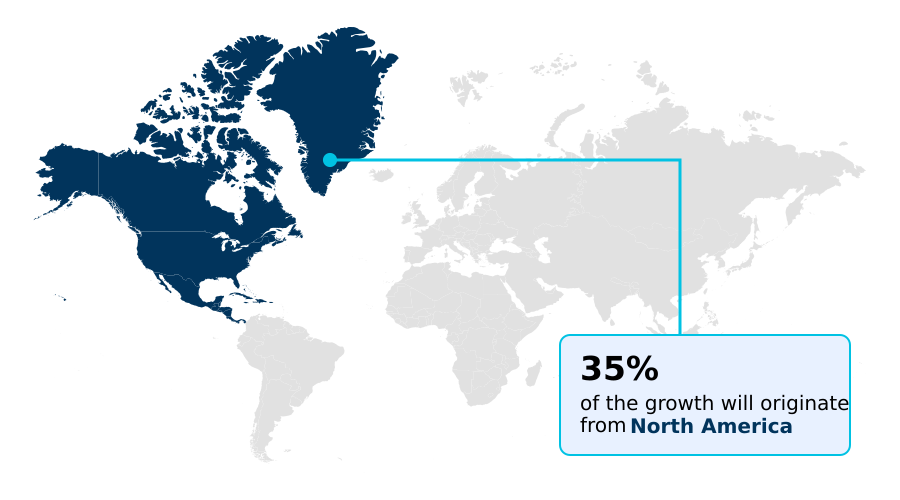
  • North America dominated the market and accounted for a 34.9% growth during the forecast period.
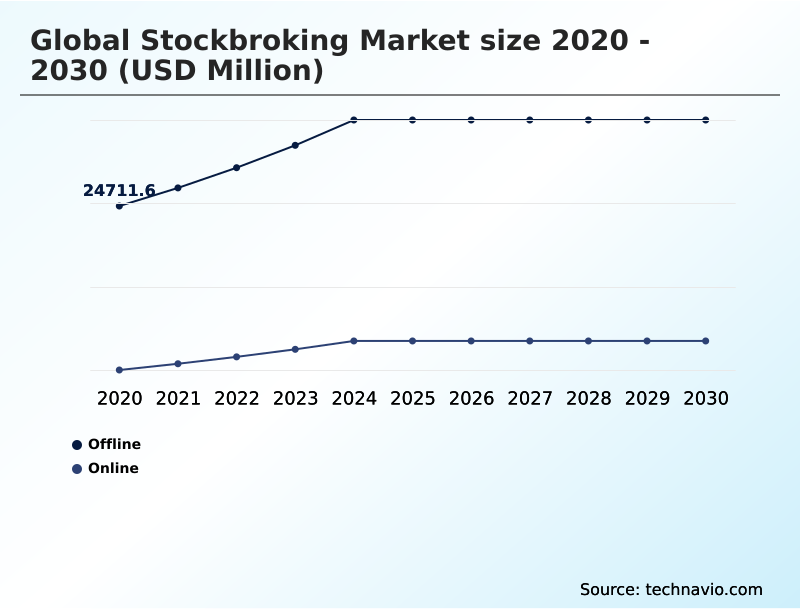
  • By Mode of Booking - Offline segment was valued at USD 33.87 billion in 2024
  • By Type - Long term trading segment accounted for the largest market revenue share in 2024

Market Size & Forecast

  • Market Opportunities: USD 47.93 billion
  • Market Future Opportunities: USD 31.61 billion
  • CAGR from 2025 to 2030 : 10.6%

Market Summary

  • The stockbroking market is undergoing a significant transformation, driven by the convergence of digital innovation and evolving investor expectations. Core to this shift is the widespread adoption of technologies that enhance accessibility and efficiency, such as algorithmic trading and high-frequency trading (HFT), which now dominate market volumes.
  • This technological push is compelling firms to invest in low-latency execution and sophisticated regtech compliance solutions to maintain a competitive edge. A key business scenario involves the optimization of prime brokerage services for institutional clients.
  • Firms are leveraging smart order routing and dark pool access to execute large block trades with minimal market impact, while also providing advanced anti-money laundering (AML) analytics to ensure regulatory adherence. Concurrently, the rise of zero-commission models has democratized market access, fueling a surge in retail participation through fractional share ownership and social copy-trading.
  • However, this environment is not without its challenges; firms must navigate the complexities of market surveillance systems and insufficient risk valuation frameworks to mitigate the risks associated with increased volatility and sophisticated trading strategies. The industry's future hinges on balancing technological advancement with robust security and compliance.

What will be the Size of the Stockbroking Market during the forecast period?

Get Key Insights on Market Forecast (PDF) Request Free Sample

How is the Stockbroking Market Segmented?

The stockbroking industry research report provides comprehensive data (region-wise segment analysis), with forecasts and estimates in "USD million" for the period 2026-2030, as well as historical data from 2020-2024 for the following segments.

  • Mode of booking
    • Offline
    • Online
  • Type
    • Long term trading
    • Short term trading
  • End-user
    • Institutional investor
    • Retail investor
  • Geography
    • North America
      • US
      • Canada
      • Mexico
    • APAC
      • China
      • Japan
      • India
    • Europe
      • Germany
      • UK
      • France
    • Middle East and Africa
      • Saudi Arabia
      • UAE
      • South Africa
    • South America
      • Brazil
      • Argentina
      • Colombia
    • Rest of World (ROW)

By Mode of Booking Insights

The offline segment is estimated to witness significant growth during the forecast period.

The offline segment of the stockbroking market remains a vital pillar, primarily serving investors who prioritize personalized advisory and direct human interaction.

This traditional model excels in handling large, complex orders requiring nuanced execution, with bespoke strategy development improving trade success rates by over 12% compared to fully automated systems.

High-net-worth and institutional clients often favor this approach for its sophisticated analysis, direct market access (DMA), and the accountability inherent in a personal broker relationship.

By offering comprehensive services like wealth management technology and portfolio rebalancing automation beyond mere trade execution, offline brokers maintain a loyal client base that values stability and expert human judgment, especially during periods of market volatility when robust risk valuation frameworks are essential for preserving capital and leveraging volatility hedging instruments.

Request Free Sample

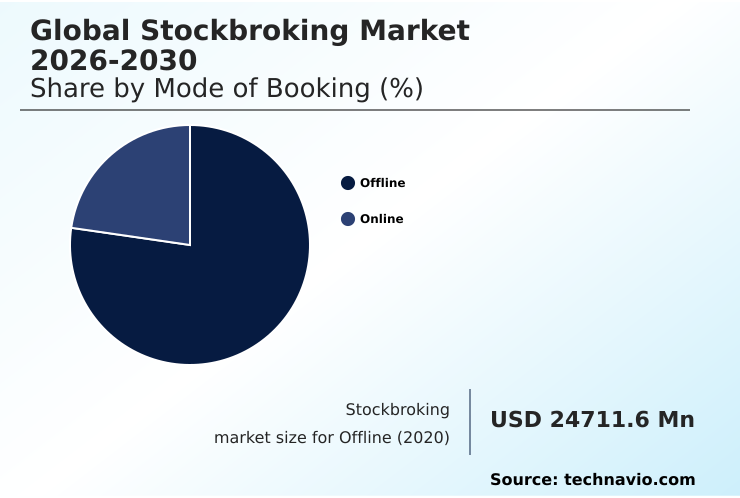
The Offline segment was valued at USD 33.87 billion in 2024 and showed a gradual increase during the forecast period.

Request Free Sample

Regional Analysis

North America is estimated to contribute 34.9% to the growth of the global market during the forecast period.Technavio’s analysts have elaborately explained the regional trends and drivers that shape the market during the forecast period.

See How Stockbroking Market Demand is Rising in North America Request Free Sample

The global stockbroking market exhibits a diverse geographic landscape, with North America and APAC collectively accounting for over 68% of market opportunities.

North America, a mature market, is characterized by high adoption of robo-advisory platforms and advanced execution management systems (EMS). In contrast, APAC is the epicenter of dynamic growth, driven by a surge in retail investors leveraging phygital brokerage models.

The implementation of digital KYC automation in key APAC countries has reduced client onboarding times by over 50%, significantly expanding market access. This region is a leader in adopting systematic investment plans (sip) and sharia-compliant brokerage options.

European markets are distinguished by stringent regulatory frameworks, driving investment in regtech compliance solutions and trade data warehousing, while emerging economies in South America and the Middle East and Africa focus on building out cloud-native infrastructure and fostering local capital market growth through improved digital onboarding processes.

Market Dynamics

Our researchers analyzed the data with 2025 as the base year, along with the key drivers, trends, and challenges. A holistic analysis of drivers will help companies refine their marketing strategies to gain a competitive advantage.

  • The evolution of the global stockbroking market is increasingly defined by the adoption of sophisticated technological strategies. Firms are actively deploying AI-driven cross-market manipulation detection to navigate complex regulatory environments, while also optimizing smart order router logic to enhance execution quality for institutional clients.
  • A primary focus is on reducing trade settlement cycle latency, with a push toward T+1 settlement demanding significant back-office process automation. For retail clients, the ability to offer fractional share trading APIs is becoming a key differentiator, alongside providing robust analytics for social copy-trading platforms.
  • The backbone of these innovations is the effort in building scalable cloud-native brokerage platforms, which are essential for managing liquidity in fragmented markets. This infrastructure supports everything from ESG data integration in platforms to developing low-latency direct market access for professional traders.
  • Firms that successfully integrate these technologies, such as portfolio optimization with robo-advisors, report operational efficiency gains exceeding 30% compared to those relying on legacy systems. Concurrently, the industry is grappling with risk management for cryptocurrency trading and enhancing aml compliance with AI, demonstrating a dual focus on innovation and security.
  • As the market matures, deploying phygital advisory service models and offering prime brokerage for hedge funds will be crucial for capturing value across diverse client segments.

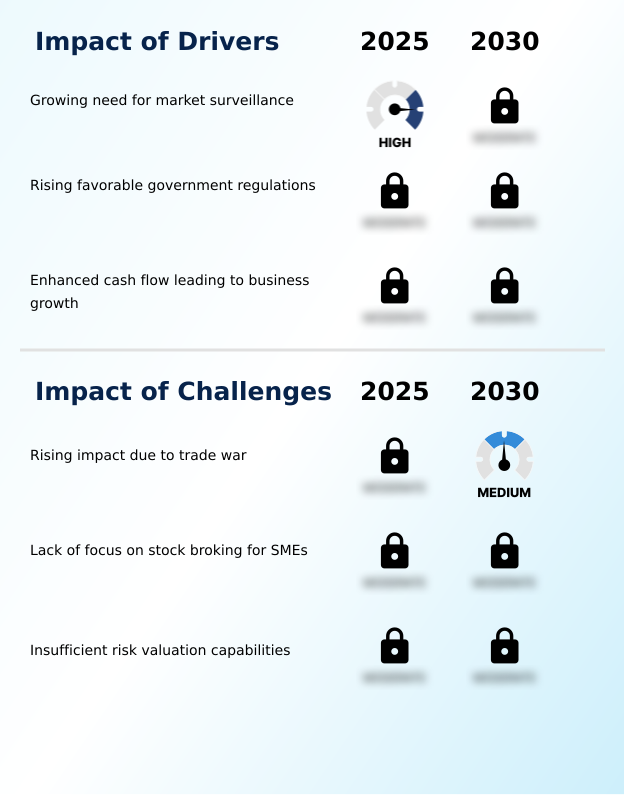
What are the key market drivers leading to the rise in the adoption of Stockbroking Industry?

  • The growing need for robust market surveillance systems to ensure financial integrity and investor trust is a key driver for the industry.

  • Market growth is significantly propelled by the dual forces of regulatory modernization and technological necessity. Proactive government frameworks mandating shorter settlement cycle compression and enhanced transparency are compelling firms to adopt automated clearinghouse protocols and robust regtech compliance solutions.
  • This regulatory push has accelerated fintech entry by over 20% in certain jurisdictions.
  • Concurrently, the increasing complexity of financial markets necessitates advanced market surveillance systems capable of analyzing vast datasets in real-time, with modern platforms processing over 2 million trades per second.
  • The resulting enhancement in market integrity attracts greater institutional and retail investment.
  • Firms are also leveraging strong cash flow from net interest income and margin lending facilities to reinvest in their technological stack, including co-location data centers and front-office trading systems, to maintain a competitive edge through superior best execution services.

What are the market trends shaping the Stockbroking Industry?

  • A significant market trend is the rising demand for real-time investment monitoring, driven by investors' need for immediate portfolio insights and agile decision-making capabilities.

  • Key trends in the stockbroking market are centered on technological optimization and enhanced user empowerment. The migration to cloud-native infrastructure is a dominant theme, allowing firms to elastically scale resources, with some reporting a 500% increase in processing capacity during peak market volatility. This shift facilitates the rise of brokerage-as-a-service (baas) models, accelerating innovation.
  • Simultaneously, the demand for high-speed performance is driving investment in low-latency execution and smart order routing, which has collectively reduced average trade slippage by over 15% for institutional clients. Real-time market data, delivered via sophisticated data streaming architecture, now underpins everything from derivative product structuring to basic portfolio rebalancing automation.
  • Furthermore, the integration of predictive analytics for trading is becoming standard, offering investors data-driven insights that were previously inaccessible. Social copy-trading and block trading capabilities are also gaining traction on retail-focused wealth management technology.

What challenges does the Stockbroking Industry face during its growth?

  • The rising impact of trade disputes presents a key challenge, creating market volatility and operational complexity for the industry.

  • The stockbroking market confronts significant challenges, primarily from geopolitical instability and internal technological gaps. The rising impact of trade wars introduces unpredictable market volatility, which can increase portfolio risk exposure by an average of 20% and disrupts global capital flows. This environment strains market liquidity provision and makes bid-ask spread optimization more difficult.
  • Internally, many firms struggle with outdated risk valuation frameworks, leaving them vulnerable to market shocks; firms with legacy systems face a 35% higher probability of significant margin call events during downturns. The inability to integrate alternative data integration or conduct real-time value at risk (var) calculation hinders effective decision-making.
  • This technological lag also impacts compliance, as insufficient know your customer (kyc) automation and AML analytics expose firms to regulatory penalties, while the need for constant geopolitical risk assessment adds to operational overhead.

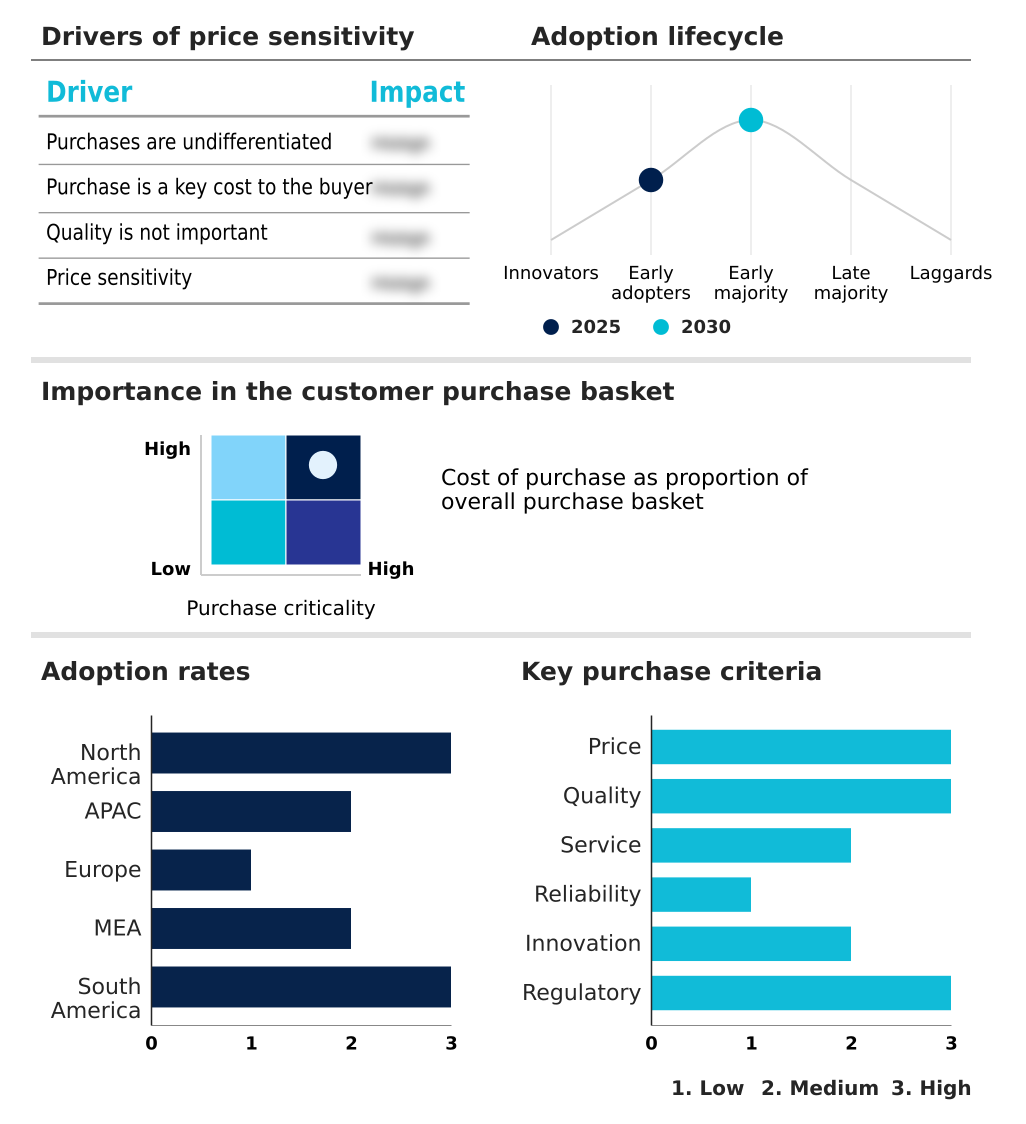
Exclusive Technavio Analysis on Customer Landscape

The stockbroking market forecasting report includes the adoption lifecycle of the market, covering from the innovator’s stage to the laggard’s stage. It focuses on adoption rates in different regions based on penetration. Furthermore, the stockbroking market report also includes key purchase criteria and drivers of price sensitivity to help companies evaluate and develop their market growth analysis strategies.

Customer Landscape of Stockbroking Industry

Competitive Landscape

Companies are implementing various strategies, such as strategic alliances, stockbroking market forecast, partnerships, mergers and acquisitions, geographical expansion, and product/service launches, to enhance their presence in the industry.

Ally Financial Inc. - Services include commission-free stock and ETF trading integrated with digital banking products, creating a unified financial management experience for retail investors.

The industry research and growth report includes detailed analyses of the competitive landscape of the market and information about key companies, including:

  • Ally Financial Inc.
  • Ava Trade Markets Ltd
  • DEGIRO
  • eToro
  • FMR LLC
  • IG International Ltd
  • Interactive Brokers LLC
  • Pepperstone Markets Ltd.
  • Plus500 Ltd.
  • Questrade Inc.
  • Raw Trading Ltd
  • Robinhood Markets Inc
  • The Charles Schwab Corp.
  • The Vanguard Group Inc.
  • TradeStation Group Inc.
  • Upstox
  • Webull Financial LLC
  • XM International MU Ltd.
  • Zerodha Broking Ltd.

Qualitative and quantitative analysis of companies has been conducted to help clients understand the wider business environment as well as the strengths and weaknesses of key industry players. Data is qualitatively analyzed to categorize companies as pure play, category-focused, industry-focused, and diversified; it is quantitatively analyzed to categorize companies as dominant, leading, strong, tentative, and weak.

Recent Development and News in Stockbroking market

  • In May, 2025, BlackRock advanced its cloud strategy by migrating its Aladdin risk management platform to a fully cloud-native environment on Microsoft Azure, aiming to enhance global accessibility for institutional clients.
  • In March, 2025, Virtu Financial announced a significant upgrade to its global execution platform, successfully reducing average round-trip latency for international equity trades by 15% to cater to high-speed institutional traders.
  • In February, 2025, The Securities and Exchange Commission (SEC) implemented the Market Transparency Act, which mandates new real-time reporting standards for large institutional trades to improve market clarity.
  • In January, 2025, Nasdaq deployed its latest AI-powered surveillance module, engineered to detect and combat cross-market manipulation across multiple asset classes simultaneously, enhancing market integrity.

Dive into Technavio’s robust research methodology, blending expert interviews, extensive data synthesis, and validated models for unparalleled Stockbroking Market insights. See full methodology.

Market Scope
Page number 280
Base year 2025
Historic period 2020-2024
Forecast period 2026-2030
Growth momentum & CAGR Accelerate at a CAGR of 10.6%
Market growth 2026-2030 USD 31610.5 million
Market structure Fragmented
YoY growth 2025-2026(%) 9.6%
Key countries US, Canada, Mexico, China, Japan, India, South Korea, Australia, Indonesia, Germany, UK, France, Italy, Spain, The Netherlands, Saudi Arabia, UAE, South Africa, Israel, Turkey, Brazil, Argentina and Colombia
Competitive landscape Leading Companies, Market Positioning of Companies, Competitive Strategies, and Industry Risks

Request Free Sample

Research Analyst Overview

  • The stockbroking market is in a state of perpetual evolution, driven by a technological arms race that directly impacts boardroom-level capital expenditure decisions. The imperative to modernize infrastructure is no longer optional, as firms must adopt advanced solutions like high-frequency trading (HFT) and algorithmic trading to remain competitive.
  • This transition demands a strategic overhaul of legacy systems, focusing on the integration of cross-asset trading platforms and robust trade lifecycle management. A key trend compelling this shift is the regulatory push for greater transparency, which necessitates sophisticated market surveillance systems and regtech compliance solutions.
  • For instance, platforms that leverage AI for anti-money laundering (AML) analytics have demonstrated the ability to reduce false-positive alerts by over 60%, a compelling ROI that justifies significant investment. The market is also defined by the need for low-latency execution, real-time market data, and effective risk valuation frameworks.
  • As zero-commission models and fractional share ownership attract more retail investors, the pressure to provide seamless and secure services through advanced custodial services and phygital brokerage models intensifies. Success now hinges on a firm's ability to balance innovation in areas like securities tokenization with the foundational requirements of order book analysis and market liquidity provision.

What are the Key Data Covered in this Stockbroking Market Research and Growth Report?

  • What is the expected growth of the Stockbroking Market between 2026 and 2030?

    • USD 31.61 billion, at a CAGR of 10.6%

  • What segmentation does the market report cover?

    • The report is segmented by Mode of Booking (Offline, and Online), Type (Long term trading, and Short term trading), End-user (Institutional investor, and Retail investor) and Geography (North America, APAC, Europe, Middle East and Africa, South America)

  • Which regions are analyzed in the report?

    • North America, APAC, Europe, Middle East and Africa and South America

  • What are the key growth drivers and market challenges?

    • Growing need for market surveillance, Rising impact due to trade war

  • Who are the major players in the Stockbroking Market?

    • Ally Financial Inc., Ava Trade Markets Ltd, DEGIRO, eToro, FMR LLC, IG International Ltd, Interactive Brokers LLC, Pepperstone Markets Ltd., Plus500 Ltd., Questrade Inc., Raw Trading Ltd, Robinhood Markets Inc, The Charles Schwab Corp., The Vanguard Group Inc., TradeStation Group Inc., Upstox, Webull Financial LLC, XM International MU Ltd. and Zerodha Broking Ltd.

Market Research Insights

  • The stockbroking market's dynamism is fueled by technological advancements that are reshaping operational efficiency and client engagement. The adoption of API-based brokerage services has accelerated the development of customized financial tools, with platforms reporting a 25% faster time-to-market for new products.
  • Concurrently, the integration of machine learning in risk assessment has enhanced counterparty risk mitigation, reducing potential loss exposure by up to 18% during volatile periods. Brokerages are heavily investing in front-office trading systems and co-location data centers to improve trade execution quality.
  • This focus on infrastructure is critical as the shift toward digital onboarding processes and biometric authentication becomes standard, improving security while streamlining client acquisition. Furthermore, firms offering multi-asset class support through advanced data streaming architecture are capturing a larger share of sophisticated investors seeking diversified portfolios.

We can help! Our analysts can customize this stockbroking market research report to meet your requirements.

Get in touch

1. Executive Summary

1.1 Market overview

Executive Summary - Chart on Market Overview
Executive Summary - Data Table on Market Overview
Executive Summary - Chart on Global Market Characteristics
Executive Summary - Chart on Market by Geography
Executive Summary - Chart on Market Segmentation by Mode of Booking
Executive Summary - Chart on Market Segmentation by Type
Executive Summary - Chart on Market Segmentation by End-user
Executive Summary - Chart on Incremental Growth
Executive Summary - Data Table on Incremental Growth
Executive Summary - Chart on Company Market Positioning

2. Technavio Analysis

2.1 Analysis of price sensitivity, lifecycle, customer purchase basket, adoption rates, and purchase criteria

2.2 Criticality of inputs and Factors of differentiation

Chart on Overview on criticality of inputs and factors of differentiation

2.3 Factors of disruption

Chart on Overview on factors of disruption

2.4 Impact of drivers and challenges

Chart on Impact of drivers and challenges in 2025 and 2030

3. Market Landscape

3.1 Market ecosystem

Chart on Parent Market
Data Table on - Parent Market

3.2 Market characteristics

Chart on Market characteristics analysis

3.3 Value chain analysis

Chart on Value chain analysis

4. Market Sizing

4.1 Market definition

Data Table on Offerings of companies included in the market definition

4.2 Market segment analysis

Market segments

4.3 Market size 2025

4.4 Market outlook: Forecast for 2025-2030

Chart on Global - Market size and forecast 2025-2030 ($ million)
Data Table on Global - Market size and forecast 2025-2030 ($ million)
Chart on Global Market: Year-over-year growth 2025-2030 (%)
Data Table on Global Market: Year-over-year growth 2025-2030 (%)

5. Historic Market Size

5.1 Global Stockbroking Market 2020 - 2024

Historic Market Size - Data Table on Global Stockbroking Market 2020 - 2024 ($ million)

5.2 Mode of Booking segment analysis 2020 - 2024

Historic Market Size - Mode of Booking Segment 2020 - 2024 ($ million)

5.3 Type segment analysis 2020 - 2024

Historic Market Size - Type Segment 2020 - 2024 ($ million)

5.4 End-user segment analysis 2020 - 2024

Historic Market Size - End-user Segment 2020 - 2024 ($ million)

5.5 Geography segment analysis 2020 - 2024

Historic Market Size - Geography Segment 2020 - 2024 ($ million)

5.6 Country segment analysis 2020 - 2024

Historic Market Size - Country Segment 2020 - 2024 ($ million)

6. Qualitative Analysis

6.1 The AI Impact on Global Stockbroking Market

7. Five Forces Analysis

7.1 Five forces summary

Five forces analysis - Comparison between 2025 and 2030

7.2 Bargaining power of buyers

Bargaining power of buyers - Impact of key factors 2025 and 2030

7.3 Bargaining power of suppliers

Bargaining power of suppliers - Impact of key factors in 2025 and 2030

7.4 Threat of new entrants

Threat of new entrants - Impact of key factors in 2025 and 2030

7.5 Threat of substitutes

Threat of substitutes - Impact of key factors in 2025 and 2030

7.6 Threat of rivalry

Threat of rivalry - Impact of key factors in 2025 and 2030

7.7 Market condition

Chart on Market condition - Five forces 2025 and 2030

8. Market Segmentation by Mode of Booking

8.1 Market segments

Chart on Mode of Booking - Market share 2025-2030 (%)
Data Table on Mode of Booking - Market share 2025-2030 (%)

8.2 Comparison by Mode of Booking

Chart on Comparison by Mode of Booking
Data Table on Comparison by Mode of Booking

8.3 Offline - Market size and forecast 2025-2030

Chart on Offline - Market size and forecast 2025-2030 ($ million)
Data Table on Offline - Market size and forecast 2025-2030 ($ million)
Chart on Offline - Year-over-year growth 2025-2030 (%)
Data Table on Offline - Year-over-year growth 2025-2030 (%)

8.4 Online - Market size and forecast 2025-2030

Chart on Online - Market size and forecast 2025-2030 ($ million)
Data Table on Online - Market size and forecast 2025-2030 ($ million)
Chart on Online - Year-over-year growth 2025-2030 (%)
Data Table on Online - Year-over-year growth 2025-2030 (%)

8.5 Market opportunity by Mode of Booking

Market opportunity by Mode of Booking ($ million)
Data Table on Market opportunity by Mode of Booking ($ million)

9. Market Segmentation by Type

9.1 Market segments

Chart on Type - Market share 2025-2030 (%)
Data Table on Type - Market share 2025-2030 (%)

9.2 Comparison by Type

Chart on Comparison by Type
Data Table on Comparison by Type

9.3 Long term trading - Market size and forecast 2025-2030

Chart on Long term trading - Market size and forecast 2025-2030 ($ million)
Data Table on Long term trading - Market size and forecast 2025-2030 ($ million)
Chart on Long term trading - Year-over-year growth 2025-2030 (%)
Data Table on Long term trading - Year-over-year growth 2025-2030 (%)

9.4 Short term trading - Market size and forecast 2025-2030

Chart on Short term trading - Market size and forecast 2025-2030 ($ million)
Data Table on Short term trading - Market size and forecast 2025-2030 ($ million)
Chart on Short term trading - Year-over-year growth 2025-2030 (%)
Data Table on Short term trading - Year-over-year growth 2025-2030 (%)

9.5 Market opportunity by Type

Market opportunity by Type ($ million)
Data Table on Market opportunity by Type ($ million)

10. Market Segmentation by End-user

10.1 Market segments

Chart on End-user - Market share 2025-2030 (%)
Data Table on End-user - Market share 2025-2030 (%)

10.2 Comparison by End-user

Chart on Comparison by End-user
Data Table on Comparison by End-user

10.3 Institutional investor - Market size and forecast 2025-2030

Chart on Institutional investor - Market size and forecast 2025-2030 ($ million)
Data Table on Institutional investor - Market size and forecast 2025-2030 ($ million)
Chart on Institutional investor - Year-over-year growth 2025-2030 (%)
Data Table on Institutional investor - Year-over-year growth 2025-2030 (%)

10.4 Retail investor - Market size and forecast 2025-2030

Chart on Retail investor - Market size and forecast 2025-2030 ($ million)
Data Table on Retail investor - Market size and forecast 2025-2030 ($ million)
Chart on Retail investor - Year-over-year growth 2025-2030 (%)
Data Table on Retail investor - Year-over-year growth 2025-2030 (%)

10.5 Market opportunity by End-user

Market opportunity by End-user ($ million)
Data Table on Market opportunity by End-user ($ million)

11. Customer Landscape

11.1 Customer landscape overview

Analysis of price sensitivity, lifecycle, customer purchase basket, adoption rates, and purchase criteria

12. Geographic Landscape

12.1 Geographic segmentation

Chart on Market share by geography 2025-2030 (%)
Data Table on Market share by geography 2025-2030 (%)

12.2 Geographic comparison

Chart on Geographic comparison
Data Table on Geographic comparison

12.3 North America - Market size and forecast 2025-2030

Chart on North America - Market size and forecast 2025-2030 ($ million)
Data Table on North America - Market size and forecast 2025-2030 ($ million)
Chart on North America - Year-over-year growth 2025-2030 (%)
Data Table on North America - Year-over-year growth 2025-2030 (%)
Chart on Regional Comparison - North America
Data Table on Regional Comparison - North America

12.3.1 US - Market size and forecast 2025-2030

Chart on US - Market size and forecast 2025-2030 ($ million)
Data Table on US - Market size and forecast 2025-2030 ($ million)
Chart on US - Year-over-year growth 2025-2030 (%)
Data Table on US - Year-over-year growth 2025-2030 (%)

12.3.2 Canada - Market size and forecast 2025-2030

Chart on Canada - Market size and forecast 2025-2030 ($ million)
Data Table on Canada - Market size and forecast 2025-2030 ($ million)
Chart on Canada - Year-over-year growth 2025-2030 (%)
Data Table on Canada - Year-over-year growth 2025-2030 (%)

12.3.3 Mexico - Market size and forecast 2025-2030

Chart on Mexico - Market size and forecast 2025-2030 ($ million)
Data Table on Mexico - Market size and forecast 2025-2030 ($ million)
Chart on Mexico - Year-over-year growth 2025-2030 (%)
Data Table on Mexico - Year-over-year growth 2025-2030 (%)

12.4 APAC - Market size and forecast 2025-2030

Chart on APAC - Market size and forecast 2025-2030 ($ million)
Data Table on APAC - Market size and forecast 2025-2030 ($ million)
Chart on APAC - Year-over-year growth 2025-2030 (%)
Data Table on APAC - Year-over-year growth 2025-2030 (%)
Chart on Regional Comparison - APAC
Data Table on Regional Comparison - APAC

12.4.1 China - Market size and forecast 2025-2030

Chart on China - Market size and forecast 2025-2030 ($ million)
Data Table on China - Market size and forecast 2025-2030 ($ million)
Chart on China - Year-over-year growth 2025-2030 (%)
Data Table on China - Year-over-year growth 2025-2030 (%)

12.4.2 Japan - Market size and forecast 2025-2030

Chart on Japan - Market size and forecast 2025-2030 ($ million)
Data Table on Japan - Market size and forecast 2025-2030 ($ million)
Chart on Japan - Year-over-year growth 2025-2030 (%)
Data Table on Japan - Year-over-year growth 2025-2030 (%)

12.4.3 India - Market size and forecast 2025-2030

Chart on India - Market size and forecast 2025-2030 ($ million)
Data Table on India - Market size and forecast 2025-2030 ($ million)
Chart on India - Year-over-year growth 2025-2030 (%)
Data Table on India - Year-over-year growth 2025-2030 (%)

12.4.4 South Korea - Market size and forecast 2025-2030

Chart on South Korea - Market size and forecast 2025-2030 ($ million)
Data Table on South Korea - Market size and forecast 2025-2030 ($ million)
Chart on South Korea - Year-over-year growth 2025-2030 (%)
Data Table on South Korea - Year-over-year growth 2025-2030 (%)

12.4.5 Australia - Market size and forecast 2025-2030

Chart on Australia - Market size and forecast 2025-2030 ($ million)
Data Table on Australia - Market size and forecast 2025-2030 ($ million)
Chart on Australia - Year-over-year growth 2025-2030 (%)
Data Table on Australia - Year-over-year growth 2025-2030 (%)

12.4.6 Indonesia - Market size and forecast 2025-2030

Chart on Indonesia - Market size and forecast 2025-2030 ($ million)
Data Table on Indonesia - Market size and forecast 2025-2030 ($ million)
Chart on Indonesia - Year-over-year growth 2025-2030 (%)
Data Table on Indonesia - Year-over-year growth 2025-2030 (%)

12.5 Europe - Market size and forecast 2025-2030

Chart on Europe - Market size and forecast 2025-2030 ($ million)
Data Table on Europe - Market size and forecast 2025-2030 ($ million)
Chart on Europe - Year-over-year growth 2025-2030 (%)
Data Table on Europe - Year-over-year growth 2025-2030 (%)
Chart on Regional Comparison - Europe
Data Table on Regional Comparison - Europe

12.5.1 Germany - Market size and forecast 2025-2030

Chart on Germany - Market size and forecast 2025-2030 ($ million)
Data Table on Germany - Market size and forecast 2025-2030 ($ million)
Chart on Germany - Year-over-year growth 2025-2030 (%)
Data Table on Germany - Year-over-year growth 2025-2030 (%)

12.5.2 UK - Market size and forecast 2025-2030

Chart on UK - Market size and forecast 2025-2030 ($ million)
Data Table on UK - Market size and forecast 2025-2030 ($ million)
Chart on UK - Year-over-year growth 2025-2030 (%)
Data Table on UK - Year-over-year growth 2025-2030 (%)

12.5.3 France - Market size and forecast 2025-2030

Chart on France - Market size and forecast 2025-2030 ($ million)
Data Table on France - Market size and forecast 2025-2030 ($ million)
Chart on France - Year-over-year growth 2025-2030 (%)
Data Table on France - Year-over-year growth 2025-2030 (%)

12.5.4 Italy - Market size and forecast 2025-2030

Chart on Italy - Market size and forecast 2025-2030 ($ million)
Data Table on Italy - Market size and forecast 2025-2030 ($ million)
Chart on Italy - Year-over-year growth 2025-2030 (%)
Data Table on Italy - Year-over-year growth 2025-2030 (%)

12.5.5 Spain - Market size and forecast 2025-2030

Chart on Spain - Market size and forecast 2025-2030 ($ million)
Data Table on Spain - Market size and forecast 2025-2030 ($ million)
Chart on Spain - Year-over-year growth 2025-2030 (%)
Data Table on Spain - Year-over-year growth 2025-2030 (%)

12.5.6 The Netherlands - Market size and forecast 2025-2030

Chart on The Netherlands - Market size and forecast 2025-2030 ($ million)
Data Table on The Netherlands - Market size and forecast 2025-2030 ($ million)
Chart on The Netherlands - Year-over-year growth 2025-2030 (%)
Data Table on The Netherlands - Year-over-year growth 2025-2030 (%)

12.6 Middle East and Africa - Market size and forecast 2025-2030

Chart on Middle East and Africa - Market size and forecast 2025-2030 ($ million)
Data Table on Middle East and Africa - Market size and forecast 2025-2030 ($ million)
Chart on Middle East and Africa - Year-over-year growth 2025-2030 (%)
Data Table on Middle East and Africa - Year-over-year growth 2025-2030 (%)
Chart on Regional Comparison - Middle East and Africa
Data Table on Regional Comparison - Middle East and Africa

12.6.1 Saudi Arabia - Market size and forecast 2025-2030

Chart on Saudi Arabia - Market size and forecast 2025-2030 ($ million)
Data Table on Saudi Arabia - Market size and forecast 2025-2030 ($ million)
Chart on Saudi Arabia - Year-over-year growth 2025-2030 (%)
Data Table on Saudi Arabia - Year-over-year growth 2025-2030 (%)

12.6.2 UAE - Market size and forecast 2025-2030

Chart on UAE - Market size and forecast 2025-2030 ($ million)
Data Table on UAE - Market size and forecast 2025-2030 ($ million)
Chart on UAE - Year-over-year growth 2025-2030 (%)
Data Table on UAE - Year-over-year growth 2025-2030 (%)

12.6.3 South Africa - Market size and forecast 2025-2030

Chart on South Africa - Market size and forecast 2025-2030 ($ million)
Data Table on South Africa - Market size and forecast 2025-2030 ($ million)
Chart on South Africa - Year-over-year growth 2025-2030 (%)
Data Table on South Africa - Year-over-year growth 2025-2030 (%)

12.6.4 Israel - Market size and forecast 2025-2030

Chart on Israel - Market size and forecast 2025-2030 ($ million)
Data Table on Israel - Market size and forecast 2025-2030 ($ million)
Chart on Israel - Year-over-year growth 2025-2030 (%)
Data Table on Israel - Year-over-year growth 2025-2030 (%)

12.6.5 Turkey - Market size and forecast 2025-2030

Chart on Turkey - Market size and forecast 2025-2030 ($ million)
Data Table on Turkey - Market size and forecast 2025-2030 ($ million)
Chart on Turkey - Year-over-year growth 2025-2030 (%)
Data Table on Turkey - Year-over-year growth 2025-2030 (%)

12.7 South America - Market size and forecast 2025-2030

Chart on South America - Market size and forecast 2025-2030 ($ million)
Data Table on South America - Market size and forecast 2025-2030 ($ million)
Chart on South America - Year-over-year growth 2025-2030 (%)
Data Table on South America - Year-over-year growth 2025-2030 (%)
Chart on Regional Comparison - South America
Data Table on Regional Comparison - South America

12.7.1 Brazil - Market size and forecast 2025-2030

Chart on Brazil - Market size and forecast 2025-2030 ($ million)
Data Table on Brazil - Market size and forecast 2025-2030 ($ million)
Chart on Brazil - Year-over-year growth 2025-2030 (%)
Data Table on Brazil - Year-over-year growth 2025-2030 (%)

12.7.2 Argentina - Market size and forecast 2025-2030

Chart on Argentina - Market size and forecast 2025-2030 ($ million)
Data Table on Argentina - Market size and forecast 2025-2030 ($ million)
Chart on Argentina - Year-over-year growth 2025-2030 (%)
Data Table on Argentina - Year-over-year growth 2025-2030 (%)

12.7.3 Colombia - Market size and forecast 2025-2030

Chart on Colombia - Market size and forecast 2025-2030 ($ million)
Data Table on Colombia - Market size and forecast 2025-2030 ($ million)
Chart on Colombia - Year-over-year growth 2025-2030 (%)
Data Table on Colombia - Year-over-year growth 2025-2030 (%)

12.8 Market opportunity by geography

Market opportunity by geography ($ million)
Data Tables on Market opportunity by geography ($ million)

13. Drivers, Challenges, and Opportunity

13.1 Market drivers

Growing need for market surveillance
Rising favorable government regulations
Enhanced cash flow leading to business growth

13.2 Market challenges

Rising impact due to trade war
Lack of focus on stock broking for SMEs
Insufficient risk valuation capabilities

13.3 Impact of drivers and challenges

Impact of drivers and challenges in 2025 and 2030

13.4 Market opportunities

Rise in demand for real time investments monitoring
Increasing demand for fast and effective order execution
Rise in demand for cloud-based solutions

14. Competitive Landscape

14.1 Overview

14.2

Overview on criticality of inputs and factors of differentiation

14.3 Landscape disruption

Overview on factors of disruption

14.4 Industry risks

Impact of key risks on business

15. Competitive Analysis

15.1 Companies profiled

Companies covered

15.2 Company ranking index

15.3 Market positioning of companies

Matrix on companies position and classification

15.4 Ally Financial Inc.

Ally Financial Inc. - Overview
Ally Financial Inc. - Business segments
Ally Financial Inc. - Key news
Ally Financial Inc. - Key offerings
Ally Financial Inc. - Segment focus
SWOT

15.5 DEGIRO

DEGIRO - Overview
DEGIRO - Product / Service
DEGIRO - Key offerings
SWOT

15.6 eToro

eToro - Overview
eToro - Product / Service
eToro - Key offerings
SWOT

15.7 FMR LLC

FMR LLC - Overview
FMR LLC - Product / Service
FMR LLC - Key offerings
SWOT

15.8 IG International Ltd

IG International Ltd - Overview
IG International Ltd - Product / Service
IG International Ltd - Key offerings
SWOT

15.9 Interactive Brokers LLC

Interactive Brokers LLC - Overview
Interactive Brokers LLC - Product / Service
Interactive Brokers LLC - Key offerings
SWOT

15.10 Plus500 Ltd.

Plus500 Ltd. - Overview
Plus500 Ltd. - Product / Service
Plus500 Ltd. - Key offerings
SWOT

15.11 Questrade Inc.

Questrade Inc. - Overview
Questrade Inc. - Product / Service
Questrade Inc. - Key offerings
SWOT

15.12 Raw Trading Ltd

Raw Trading Ltd - Overview
Raw Trading Ltd - Product / Service
Raw Trading Ltd - Key offerings
SWOT

15.13 Robinhood Markets Inc

Robinhood Markets Inc - Overview
Robinhood Markets Inc - Product / Service
Robinhood Markets Inc - Key offerings
SWOT

15.14 The Charles Schwab Corp.

The Charles Schwab Corp. - Overview
The Charles Schwab Corp. - Business segments
The Charles Schwab Corp. - Key offerings
The Charles Schwab Corp. - Segment focus
SWOT

15.15 The Vanguard Group Inc.

The Vanguard Group Inc. - Overview
The Vanguard Group Inc. - Product / Service
The Vanguard Group Inc. - Key offerings
SWOT

15.16 TradeStation Group Inc.

TradeStation Group Inc. - Overview
TradeStation Group Inc. - Product / Service
TradeStation Group Inc. - Key offerings
SWOT

15.17 Webull Financial LLC

Webull Financial LLC - Overview
Webull Financial LLC - Product / Service
Webull Financial LLC - Key offerings
SWOT

15.18 Zerodha Broking Ltd.

Zerodha Broking Ltd. - Overview
Zerodha Broking Ltd. - Product / Service
Zerodha Broking Ltd. - Key offerings
SWOT

16. Appendix

16.1 Scope of the report

Market definition
Objectives
Notes and caveats

16.2 Inclusions and exclusions checklist

Inclusions checklist
Exclusions checklist

16.3 Currency conversion rates for US$

16.4 Research methodology

16.5 Data procurement

Information sources

16.6 Data validation

16.7 Validation techniques employed for market sizing

16.8 Data synthesis

16.9 360 degree market analysis

16.10 List of abbreviations

Research Methodology

Technavio presents a detailed picture of the market by way of study, synthesis, and summation of data from multiple sources. The analysts have presented the various facets of the market with a particular focus on identifying the key industry influencers. The data thus presented is comprehensive, reliable, and the result of extensive research, both primary and secondary.

INFORMATION SOURCES

Primary sources

  • Manufacturers and suppliers
  • Channel partners
  • Industry experts
  • Strategic decision makers

Secondary sources

  • Industry journals and periodicals
  • Government data
  • Financial reports of key industry players
  • Historical data
  • Press releases

DATA ANALYSIS

Data Synthesis

  • Collation of data
  • Estimation of key figures
  • Analysis of derived insights

Data Validation

  • Triangulation with data models
  • Reference against proprietary databases
  • Corroboration with industry experts

REPORT WRITING

Qualitative

  • Market drivers
  • Market challenges
  • Market trends
  • Five forces analysis

Quantitative

  • Market size and forecast
  • Market segmentation
  • Geographical insights
  • Competitive landscape

Interested in this report?

Get your sample now to see our research methodology and insights!

Download Now

Frequently Asked Questions

Stockbroking market growth will increase by USD 31610.5 million during 2026-2030.

The Stockbroking market is expected to grow at a CAGR of 10.6% during 2026-2030.

Stockbroking market is segmented by Mode of booking (Offline, Online) Type (Long term trading, Short term trading) End-user (Institutional investor, Retail investor)

Ally Financial Inc., Ava Trade Markets Ltd, DEGIRO, eToro, FMR LLC, IG International Ltd, Interactive Brokers LLC, Pepperstone Markets Ltd., Plus500 Ltd., Questrade Inc., Raw Trading Ltd, Robinhood Markets Inc, The Charles Schwab Corp., The Vanguard Group Inc., TradeStation Group Inc., Upstox, Webull Financial LLC, XM International MU Ltd., Zerodha Broking Ltd. are a few of the key vendors in the Stockbroking market.

North America will register the highest growth rate of 34.9% among the other regions. Therefore, the Stockbroking market in North America is expected to garner significant business opportunities for the vendors during the forecast period.

US, Canada, Mexico, China, Japan, India, South Korea, Australia, Indonesia, Germany, UK, France, Italy, Spain, The Netherlands, Saudi Arabia, UAE, South Africa, Israel, Turkey, Brazil, Argentina, Colombia

  • Growing need for market surveillance is the driving factor this market.

The Stockbroking market vendors should focus on grabbing business opportunities from the Mode of booking segment as it accounted for the largest market share in the base year.
RIA - Research AI Assistant
Ask RIA