Sanitary Pumps Market Analysis, Size, and Forecast 2026-2030: APAC (China, Japan, and India), Europe (Germany, France, and UK), North America (US, Canada, and Mexico), South America (Brazil and Argentina), Middle East and Africa (Saudi Arabia, South Africa, and UAE), and Rest of World (ROW)

Sanitary Pumps Market Analysis, Size, and Forecast 2026-2030:
APAC (China, Japan, and India), Europe (Germany, France, and UK), North America (US, Canada, and Mexico), South America (Brazil and Argentina), Middle East and Africa (Saudi Arabia, South Africa, and UAE), and Rest of World (ROW)

Published: May 2026 314 Pages SKU: IRTNTR41160

Market Overview at a Glance

$611.4 Mn
Market Opportunity
4.2%
CAGR 2025 - 2030
57.1%
APAC Growth
$1.57 B
Kinetic sanitary pumps segment 2024

Sanitary Pumps Market Size 2026-2030

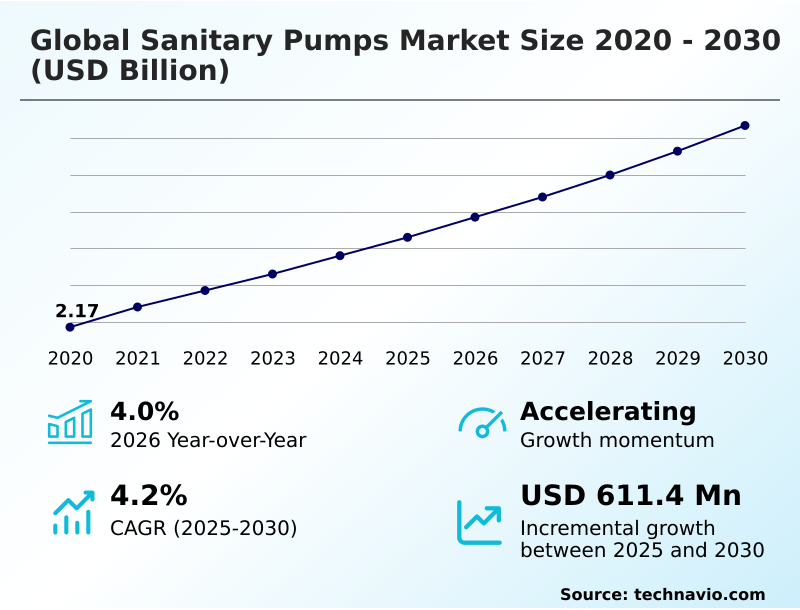
The Sanitary Pumps Market size was valued at USD 2.66 billion in 2025, growing at a CAGR of 4.2% during the forecast period 2026-2030.

Major Market Trends & Insights

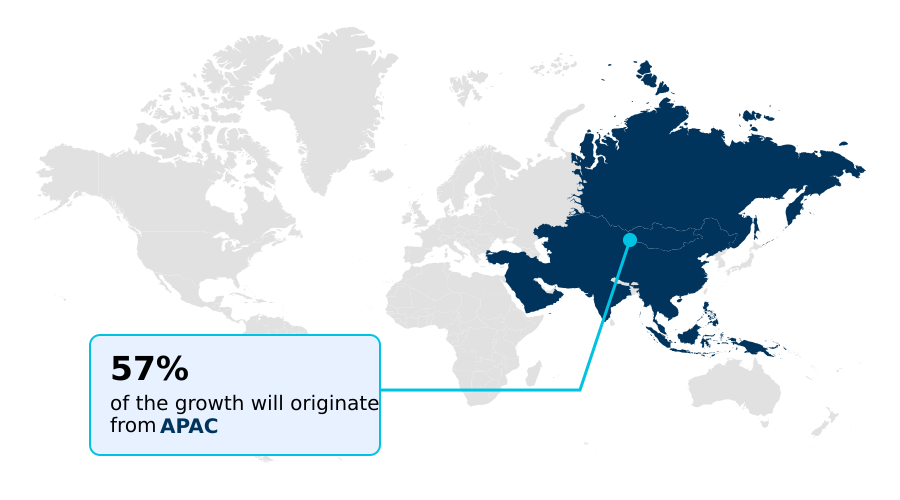
  • APAC dominated the market and accounted for a 57.1% growth during the forecast period.
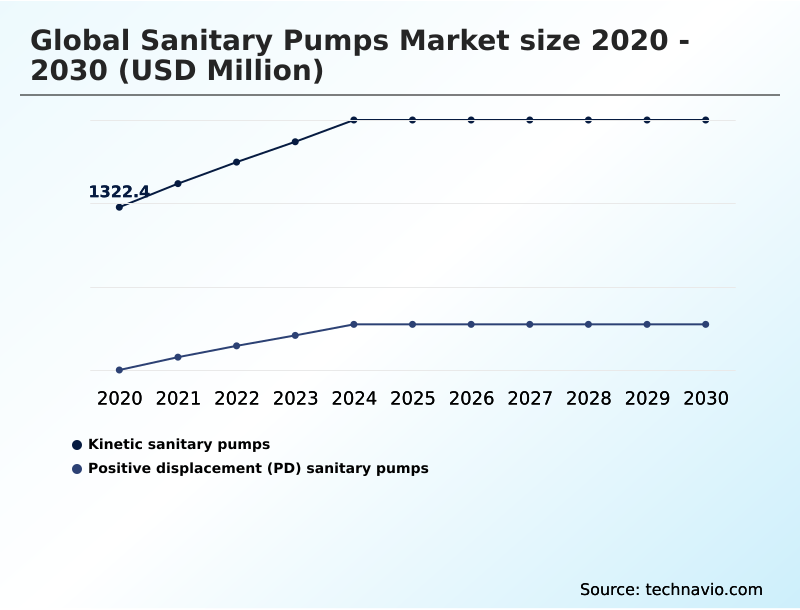
  • By Type - Kinetic sanitary pumps segment was valued at USD 1.57 billion in 2024
  • By End-user - Food and beverage segment accounted for the largest market revenue share in 2024

Market Size & Forecast

  • Historic Market Opportunities 2020-2024: USD 1.10 billion
  • Market Future Opportunities 2025-2030: USD 611.4 million
  • CAGR from 2025 to 2030 : 4.2%

Market Summary

  • The sanitary pumps market is fundamentally shaped by regulatory pressures, with over 75% of procurement decisions in the biopharmaceutical sector prioritizing compliance certifications over initial equipment cost. This emphasis on risk mitigation drives continuous innovation in hygienic design and material science.
  • A primary driver is the sustained expansion of end-use industries, where the demand for processed foods in emerging economies fuels capital investment in new production facilities. For example, a dairy processor needs pumps that support rapid, validated cleaning cycles to switch from milk to yogurt production, minimizing downtime, which can be improved by up to 30% with modern pump designs.
  • Conversely, a major challenge is the high total cost of ownership, which includes not only the initial purchase but also energy consumption and maintenance. This high barrier particularly affects smaller enterprises, forcing them to balance upfront costs against long-term operational benefits and compliance risks.

What will be the Size of the Sanitary Pumps Market during the forecast period?

Get Key Insights on Market Forecast (PDF) Request Free Sample

How is the Sanitary Pumps Market Segmented?

The sanitary pumps industry research report provides comprehensive data (region-wise segment analysis), with forecasts and analysis for the period 2026-2030, as well as historical data from 2020-2024 for the following segments.

  • Type
    • Kinetic sanitary pumps
    • Positive displacement (PD) sanitary pumps
  • End-user
    • Food and beverage
    • Pharmaceutical and biotechnology applications
    • Others
  • Material
    • Stainless steel
    • Plastic
    • Hastelloy
    • Others
  • Geography
    • APAC
      • China
      • Japan
      • India
    • Europe
      • Germany
      • France
      • UK
    • North America
      • US
      • Canada
      • Mexico
    • South America
      • Brazil
      • Argentina
    • Middle East and Africa
      • Saudi Arabia
      • South Africa
      • UAE
    • Rest of World (ROW)

How is the Sanitary Pumps Market Segmented by Type?

The kinetic sanitary pumps segment is estimated to witness significant growth during the forecast period.

Kinetic sanitary pumps, which include centrifugal pumps, represent over 60% of installations in high-volume beverage processing and are favored for their operational efficiency in low-viscosity applications.

Their design simplicity translates to lower initial costs and reduced maintenance compared to positive displacement counterparts, making them ideal for bulk fluid transfer and clean-in-place (CIP) systems.

However, their performance diminishes with increasing fluid viscosity, and the high shear from the impeller design can damage delicate products.

Innovations in hydraulic efficiency and impeller design now allow certain models to reduce energy consumption by up to 15% compared to legacy equipment, addressing a key operational cost for processors while maintaining a hygienic design suitable for non-sensitive product streams.

Request Free Sample

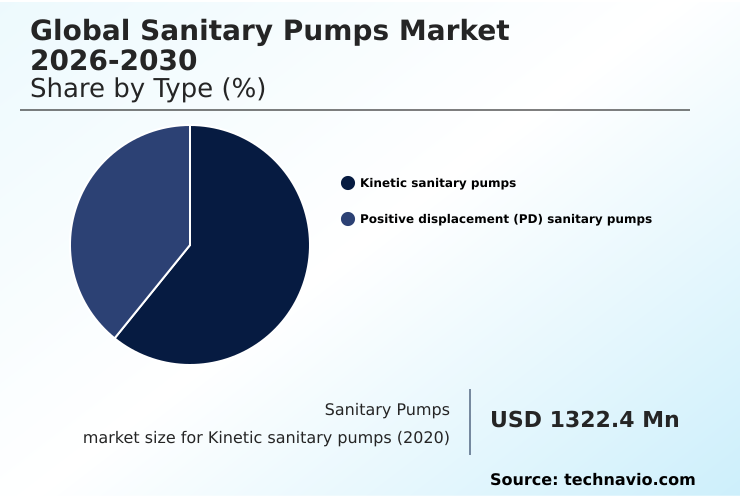
The Kinetic sanitary pumps segment was valued at USD 1.57 billion in 2024 and showed a gradual increase during the forecast period.

Request Free Sample

How demand for the Sanitary Pumps market is rising in the leading region?

APAC is estimated to contribute 57.1% to the growth of the global market during the forecast period.Technavio’s analysts have elaborately explained the regional trends and drivers that shape the market during the forecast period.

See How Sanitary Pumps Market demand is rising in APAC Request Free Sample

The geographic landscape of the sanitary pumps market shows a distinct divergence between regions, with APAC accounting for 57.1% of the market's incremental growth, significantly outpacing North America's 17.5% contribution.

This disparity is driven by different market dynamics; APAC's growth is fueled by new facility construction in countries like China and India, where the food and beverage processing sector is rapidly expanding.

In contrast, growth in mature markets like North America and Europe is primarily driven by the need to upgrade existing infrastructure for improved operational efficiency and stricter regulatory compliance (FDA, EHEDG).

This leads to differing adoption patterns, with many buyers in APAC prioritizing initial cost, while European and North American customers focus more on total cost of ownership (TCO) and advanced features like smart pump integration, which can improve energy consumption reduction.

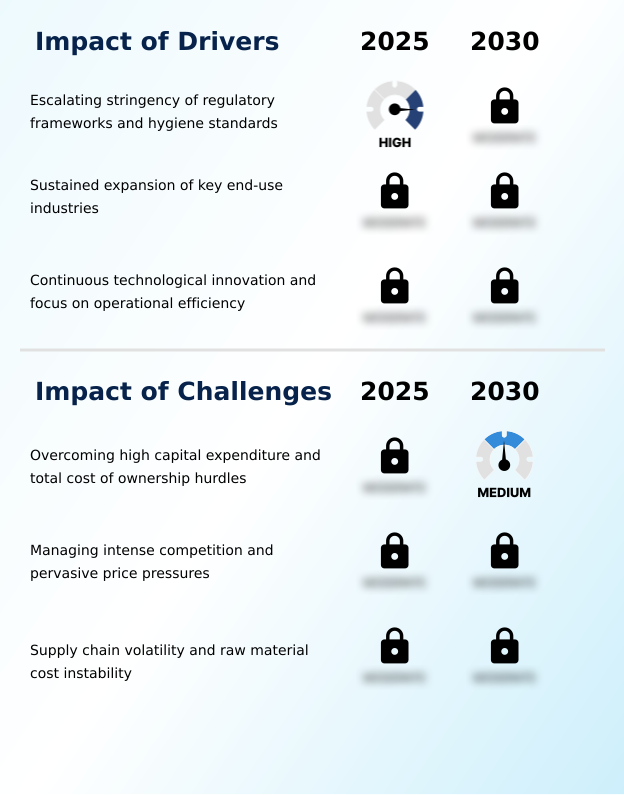
What are the key Drivers, Trends, and Challenges in the Sanitary Pumps Market?

Our researchers analyzed the data with 2025 as the base year, along with the key drivers, trends, and challenges. A holistic analysis of drivers will help companies refine their marketing strategies to gain a competitive advantage.

  • Selecting the optimal fluid handling solution is a complex process, where a single pump type rarely meets more than 70% of all processing needs within a modern facility. For manufacturers, the decision hinges on balancing performance, cost, and compliance across diverse applications.
  • A critical consideration is finding the right sanitary pump for high viscosity fluids, which typically requires positive displacement technologies like lobe or twin-screw pumps to ensure consistent flow without damaging the product. For the biopharmaceutical sector, identifying the best pumps for shear-sensitive biologics is paramount, often leading to the adoption of peristaltic or quaternary diaphragm designs that provide gentle handling.
  • Furthermore, understanding the distinct cip vs sip pump requirements is essential for ensuring process sterility and material longevity under high temperatures. An equally important aspect is reducing energy costs with sanitary pumps, where implementing variable frequency drives can lower electricity usage by up to 30% in variable-flow applications.
  • The strategic choice between a single-use pump vs stainless steel system presents another trade-off; disposable technologies can reduce initial capital outlay by 40% and eliminate cleaning validation, but introduce recurring consumable costs and new supply chain considerations. This highlights the need for a comprehensive evaluation of lifecycle costs and operational flexibility.

What are the key market drivers leading to the rise in the adoption of Sanitary Pumps Industry?

  • The escalating stringency of regulatory frameworks and hygiene standards across key end-use industries serves as a primary driver for market growth.

  • The primary market driver is the escalating stringency of regulatory frameworks, where a single non-compliance event can result in product recalls and a brand reputation drop of over 20% in consumer trust.
  • This forces processors to invest in equipment featuring certified hygienic design and complete material traceability to mitigate risks. This need is compounded by the sustained growth of end-use industries.
  • For example, the pharmaceutical and food and beverage processing sectors are expanding at a rate 1.5 times faster in emerging economies than in mature markets.
  • This rapid industrialization creates consistent demand for compliant fluid handling solutions like aseptic filling systems to equip new and upgraded production facilities.

What are the market trends shaping the Sanitary Pumps Industry?

  • A key market trend is the proliferation of intelligent pumping solutions. This includes the increasing digitalization of fluid handling systems to enhance process control and operational efficiency.

  • A dominant trend is the integration of smart technologies, with IIoT-enabled pumps capable of reducing unplanned downtime by over 60% through predictive maintenance sensors. This digitalization facilitates enhanced process validation and is often a key component of process analytical technology (PAT) strategies, providing real-time data for improved consistency and quality control.
  • Concurrently, the rapid adoption of single-use pump technology in bioprocessing is reshaping capital expenditure models. This shift is driven by the need to eliminate cross-contamination risk in aseptic fluid transfer and can reduce changeover times by more than 50% compared to traditional, reusable stainless steel systems, boosting manufacturing agility for contract manufacturers handling multiple high-value products.

What challenges does the Sanitary Pumps Industry face during its growth?

  • A key challenge affecting industry growth involves overcoming the high capital expenditure and total cost of ownership associated with sanitary pump systems.

  • A significant market challenge is the high capital expenditure, with a certified sanitary pump costing up to 3 times more than its industrial-grade counterpart, creating a substantial barrier for smaller enterprises. This upfront cost forces a difficult trade-off, as a focus on total cost of ownership (TCO) often justifies the higher initial investment through long-term operational efficiency.
  • The challenge is amplified by persistent supply chain volatility. For instance, fluctuations in the price of raw material sourcing for 316L stainless steel have varied by as much as 40% in recent cycles, directly compressing manufacturer margins and extending equipment lead times for end-users.

Exclusive Technavio Analysis on Customer Landscape

The sanitary pumps market forecasting report includes the adoption lifecycle of the market, covering from the innovator’s stage to the laggard’s stage. It focuses on adoption rates in different regions based on penetration. Furthermore, the sanitary pumps market report also includes key purchase criteria and drivers of price sensitivity to help companies evaluate and develop their market growth analysis strategies.

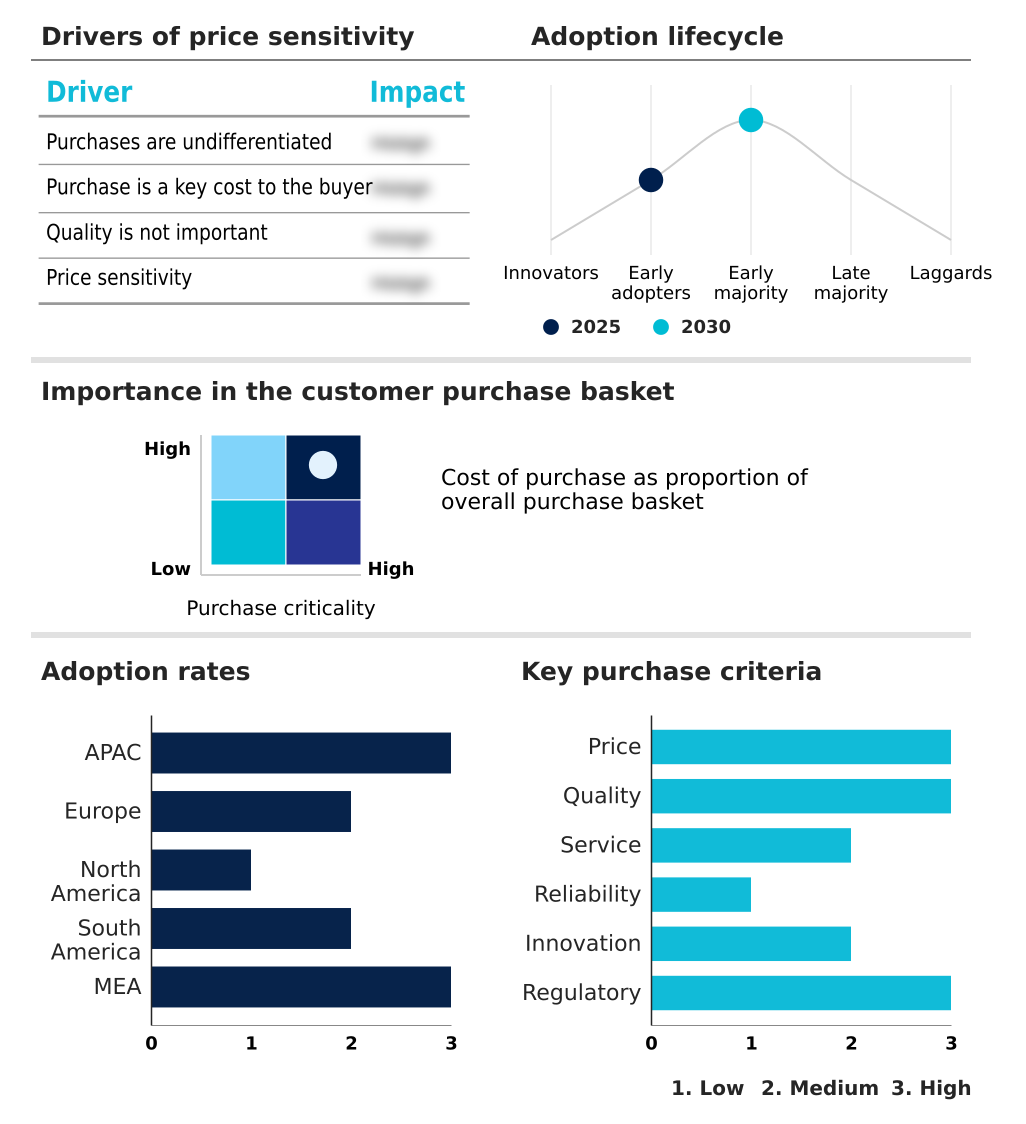
Customer Landscape of Sanitary Pumps Industry

Competitive Landscape

Companies are implementing various strategies, such as strategic alliances, sanitary pumps market forecast, partnerships, mergers and acquisitions, geographical expansion, and product/service launches, to enhance their presence in the industry.

Alfa Laval AB - Vendors provide a diverse portfolio of specialized fluid handling technologies, including kinetic and positive displacement pumps, engineered for stringent hygienic and aseptic processing applications.

The industry research and growth report includes detailed analyses of the competitive landscape of the market and information about key companies, including:

  • Alfa Laval AB
  • Ampco Pumps Co.
  • Axiflow Technologies Inc.
  • Erich NETZSCH BV and Co.
  • Fristam
  • GEA Group AG
  • Goulds Pumps
  • IDEX Corp.
  • INOXPA USA Inc.
  • KSB SE and Co. KGaA
  • LEWA GmbH
  • NOV Inc.
  • Pentair Plc
  • PSG Dover
  • Q Pumps
  • Spirax Group
  • SPX FLOW Inc.
  • Sulzer Ltd.
  • Verder Liquids
  • Xylem Inc.

Qualitative and quantitative analysis of companies has been conducted to help clients understand the wider business environment as well as the strengths and weaknesses of key industry players. Data is qualitatively analyzed to categorize companies as pure play, category-focused, industry-focused, and diversified; it is quantitatively analyzed to categorize companies as dominant, leading, strong, tentative, and weak.

Market Intelligence Radar: High-Impact Developments & Growth Signals

  • In the Industrial Machinery and Supplies and Components industry, the integration of Industrial Internet of Things (IIoT) capabilities and digital twin technology has become a key differentiator, directly increasing demand for smart pump integration in the global sanitary pumps market 2026-2030 to enhance predictive maintenance and operational efficiency.
  • A heightened focus on safety standards and risk mitigation in manufacturing setups has compelled end-users to prioritize equipment with certified hygienic design, boosting the adoption of sanitary pumps that ensure microbial contamination control and simplify process validation.
  • The expansion of industrial output in key end-use sectors, particularly food and beverage processing and pharmaceutical manufacturing, creates sustained capital expenditure cycles, driving foundational demand for new and replacement sanitary pumps to equip additional production lines.
  • A persistent drive to improve plant-wide operational efficiency and reduce energy consumption has accelerated the adoption of machinery with advanced HMI and variable frequency drives (VFDs), favoring sanitary pumps that deliver measurable energy savings and a lower total cost of ownership (TCO).

Dive into Technavio’s robust research methodology, blending expert interviews, extensive data synthesis, and validated models for unparalleled Sanitary Pumps Market insights. See full methodology.

Market Scope
Page number 314
Base year 2025
Historic period 2020-2024
Forecast period 2026-2030
Growth momentum & CAGR Accelerate at a CAGR of 4.2%
Market growth 2026-2030 USD 611.4 million
Market structure Fragmented
YoY growth 2025-2026(%) 4.0%
Key countries China, Japan, India, South Korea, Australia, Indonesia, Germany, France, UK, Italy, Spain, The Netherlands, US, Canada, Mexico, Brazil, Argentina, Chile, Saudi Arabia, South Africa, UAE, Turkey and Egypt
Competitive landscape Leading Companies, Market Positioning of Companies, Competitive Strategies, and Industry Risks

Request Free Sample

Research Analyst Overview

  • The sanitary pumps market ecosystem is a tightly integrated network where end-user segments, particularly food and beverage processing, which accounts for over 60% of demand, dictate stringent product specifications. This value chain begins with suppliers of high-grade raw materials like 316L stainless steel and biocompatible polymers, which are crucial for manufacturers to meet regulatory compliance.
  • These manufacturers, in turn, rely on distribution channels to provide local sales and technical support. Regulatory bodies such as 3-A and EHEDG play a pivotal role, as their certifications are often a prerequisite for market access.
  • Certified hygienic design can reduce cleaning times by up to 25%, directly impacting the operational efficiency and total cost of ownership (TCO) for end-users in the pharmaceutical and dairy sectors. This interconnectedness ensures that innovation is driven by both compliance needs and the pursuit of operational excellence.

What are the Key Data Covered in this Sanitary Pumps Market Research and Growth Report?

  • What is the expected growth of the Sanitary Pumps Market between 2026 and 2030?

    • The Sanitary Pumps Market is expected to grow by USD 611.4 million during 2026-2030, registering a CAGR of 4.2%. Year-over-year growth in 2026 is estimated at 4.0%%. This acceleration is shaped by escalating stringency of regulatory frameworks and hygiene standards, which is intensifying demand across multiple end-use verticals covered in the report.

  • What segmentation does the market report cover?

    • The report is segmented by Type (Kinetic sanitary pumps, and Positive displacement (PD) sanitary pumps), End-user (Food and beverage, Pharmaceutical and biotechnology applications, and Others), Material (Stainless steel, Plastic, Hastelloy, and Others) and Geography (APAC, Europe, North America, South America, Middle East and Africa). Among these, the Kinetic sanitary pumps segment is estimated to witness significant growth during the forecast period, driven by rising adoption across key application areas. Each segment includes detailed qualitative and quantitative analysis, along with historical data from 2020-2024 and forecasts through 2030 with year-over-year growth rates.

  • Which regions are analyzed in the report?

    • The report covers APAC, Europe, North America, South America and Middle East and Africa. APAC is estimated to contribute 57.1% to market growth during the forecast period. Country-level analysis includes China, Japan, India, South Korea, Australia, Indonesia, Germany, France, UK, Italy, Spain, The Netherlands, US, Canada, Mexico, Brazil, Argentina, Chile, Saudi Arabia, South Africa, UAE, Turkey and Egypt, with dedicated market size tables and year-over-year growth for each.

  • What are the key growth drivers and market challenges?

    • The primary driver is escalating stringency of regulatory frameworks and hygiene standards, which is accelerating investment and industry demand. The main challenge is overcoming high capital expenditure and total cost of ownership hurdles, creating operational barriers for key market participants. The report quantifies the impact of each driver and challenge across 2026 and 2030 with comparative analysis.

  • Who are the major players in the Sanitary Pumps Market?

    • Key vendors include Alfa Laval AB, Ampco Pumps Co., Axiflow Technologies Inc., Erich NETZSCH BV and Co., Fristam, GEA Group AG, Goulds Pumps, IDEX Corp., INOXPA USA Inc., KSB SE and Co. KGaA, LEWA GmbH, NOV Inc., Pentair Plc, PSG Dover, Q Pumps, Spirax Group, SPX FLOW Inc., Sulzer Ltd., Verder Liquids and Xylem Inc.. The report provides qualitative and quantitative analysis categorizing companies as dominant, leading, strong, tentative, and weak based on their market positioning. Company profiles include business segment analysis, SWOT assessment, key offerings, and recent strategic developments.

Market Research Insights

  • The competitive landscape in the sanitary pumps market is intensely fragmented, with the top five players commanding less than 40% of the total market share, leading to significant price pressure. In response, established leaders like Alfa Laval and SPX FLOW are differentiating through technological innovation and strategic market expansion.
  • For instance, the focus on smart pump integration is critical, as IIoT-enabled features can improve process uptime by over 20% by enabling predictive maintenance. This shift toward intelligent solutions directly addresses end-user demands for greater operational efficiency and simplified regulatory compliance.
  • At the same time, the introduction of pre-assembled, modular systems by various players signifies a strategy to reduce installation complexity and cost for end-users, tackling the challenge of high capital expenditure.

We can help! Our analysts can customize this sanitary pumps market research report to meet your requirements.

Get in touch

1. Executive Summary

1.1 Market overview

Executive Summary - Chart on Market Overview
Executive Summary - Data Table on Market Overview
Executive Summary - Chart on Global Market Characteristics
Executive Summary - Chart on Market by Geography
Executive Summary - Chart on Market Segmentation by Type
Executive Summary - Chart on Market Segmentation by End-user
Executive Summary - Chart on Market Segmentation by Material
Executive Summary - Chart on Incremental Growth
Executive Summary - Data Table on Incremental Growth
Executive Summary - Chart on Company Market Positioning

2. Technavio Analysis

2.1 Analysis of price sensitivity, lifecycle, customer purchase basket, adoption rates, and purchase criteria

2.2 Criticality of inputs and Factors of differentiation

Chart on Overview on criticality of inputs and factors of differentiation

2.3 Factors of disruption

Chart on Overview on factors of disruption

2.4 Impact of drivers and challenges

Chart on Impact of drivers and challenges in 2025 and 2030

3. Market Landscape

3.1 Market ecosystem

Chart on Parent Market
Data Table on - Parent Market

3.2 Market characteristics

Chart on Market characteristics analysis

3.3 Value chain analysis

Chart on Value chain analysis

4. Market Sizing

4.1 Market definition

Data Table on Offerings of companies included in the market definition

4.2 Market segment analysis

Market segments

4.3 Market size 2025

4.4 Market outlook: Forecast for 2025-2030

Chart on Global - Market size and forecast 2025-2030 ($ million)
Data Table on Global - Market size and forecast 2025-2030 ($ million)
Chart on Global Market: Year-over-year growth 2025-2030 (%)
Data Table on Global Market: Year-over-year growth 2025-2030 (%)

5. Historic Market Size

5.1 Global Sanitary Pumps Market 2020 - 2024

Historic Market Size - Data Table on Global Sanitary Pumps Market 2020 - 2024 ($ million)

5.2 Type segment analysis 2020 - 2024

Historic Market Size - Type Segment 2020 - 2024 ($ million)

5.3 End-user segment analysis 2020 - 2024

Historic Market Size - End-user Segment 2020 - 2024 ($ million)

5.4 Material segment analysis 2020 - 2024

Historic Market Size - Material Segment 2020 - 2024 ($ million)

5.5 Geography segment analysis 2020 - 2024

Historic Market Size - Geography Segment 2020 - 2024 ($ million)

5.6 Country segment analysis 2020 - 2024

Historic Market Size - Country Segment 2020 - 2024 ($ million)

6. Qualitative Analysis

6.1 The impact of AI on global sanitary pumps market

7. Five Forces Analysis

7.1 Five forces summary

Five forces analysis - Comparison between 2025 and 2030

7.2 Bargaining power of buyers

Bargaining power of buyers - Impact of key factors 2025 and 2030

7.3 Bargaining power of suppliers

Bargaining power of suppliers - Impact of key factors in 2025 and 2030

7.4 Threat of new entrants

Threat of new entrants - Impact of key factors in 2025 and 2030

7.5 Threat of substitutes

Threat of substitutes - Impact of key factors in 2025 and 2030

7.6 Threat of rivalry

Threat of rivalry - Impact of key factors in 2025 and 2030

7.7 Market condition

Chart on Market condition - Five forces 2025 and 2030

8. Market Segmentation by Type

8.1 Market segments

Chart on Type - Market share 2025-2030 (%)
Data Table on Type - Market share 2025-2030 (%)

8.2 Comparison by Type

Chart on Comparison by Type
Data Table on Comparison by Type

8.3 Kinetic sanitary pumps - Market size and forecast 2025-2030

Chart on Kinetic sanitary pumps - Market size and forecast 2025-2030 ($ million)
Data Table on Kinetic sanitary pumps - Market size and forecast 2025-2030 ($ million)
Chart on Kinetic sanitary pumps - Year-over-year growth 2025-2030 (%)
Data Table on Kinetic sanitary pumps - Year-over-year growth 2025-2030 (%)

8.4 Positive displacement (PD) sanitary pumps - Market size and forecast 2025-2030

Chart on Positive displacement (PD) sanitary pumps - Market size and forecast 2025-2030 ($ million)
Data Table on Positive displacement (PD) sanitary pumps - Market size and forecast 2025-2030 ($ million)
Chart on Positive displacement (PD) sanitary pumps - Year-over-year growth 2025-2030 (%)
Data Table on Positive displacement (PD) sanitary pumps - Year-over-year growth 2025-2030 (%)

8.5 Market opportunity by Type

Market opportunity by Type ($ million)
Data Table on Market opportunity by Type ($ million)

9. Market Segmentation by End-user

9.1 Market segments

Chart on End-user - Market share 2025-2030 (%)
Data Table on End-user - Market share 2025-2030 (%)

9.2 Comparison by End-user

Chart on Comparison by End-user
Data Table on Comparison by End-user

9.3 Food and beverage - Market size and forecast 2025-2030

Chart on Food and beverage - Market size and forecast 2025-2030 ($ million)
Data Table on Food and beverage - Market size and forecast 2025-2030 ($ million)
Chart on Food and beverage - Year-over-year growth 2025-2030 (%)
Data Table on Food and beverage - Year-over-year growth 2025-2030 (%)

9.4 Pharmaceutical and biotechnology applications - Market size and forecast 2025-2030

Chart on Pharmaceutical and biotechnology applications - Market size and forecast 2025-2030 ($ million)
Data Table on Pharmaceutical and biotechnology applications - Market size and forecast 2025-2030 ($ million)
Chart on Pharmaceutical and biotechnology applications - Year-over-year growth 2025-2030 (%)
Data Table on Pharmaceutical and biotechnology applications - Year-over-year growth 2025-2030 (%)

9.5 Others - Market size and forecast 2025-2030

Chart on Others - Market size and forecast 2025-2030 ($ million)
Data Table on Others - Market size and forecast 2025-2030 ($ million)
Chart on Others - Year-over-year growth 2025-2030 (%)
Data Table on Others - Year-over-year growth 2025-2030 (%)

9.6 Market opportunity by End-user

Market opportunity by End-user ($ million)
Data Table on Market opportunity by End-user ($ million)

10. Market Segmentation by Material

10.1 Market segments

Chart on Material - Market share 2025-2030 (%)
Data Table on Material - Market share 2025-2030 (%)

10.2 Comparison by Material

Chart on Comparison by Material
Data Table on Comparison by Material

10.3 Stainless steel - Market size and forecast 2025-2030

Chart on Stainless steel - Market size and forecast 2025-2030 ($ million)
Data Table on Stainless steel - Market size and forecast 2025-2030 ($ million)
Chart on Stainless steel - Year-over-year growth 2025-2030 (%)
Data Table on Stainless steel - Year-over-year growth 2025-2030 (%)

10.4 Plastic - Market size and forecast 2025-2030

Chart on Plastic - Market size and forecast 2025-2030 ($ million)
Data Table on Plastic - Market size and forecast 2025-2030 ($ million)
Chart on Plastic - Year-over-year growth 2025-2030 (%)
Data Table on Plastic - Year-over-year growth 2025-2030 (%)

10.5 Hastelloy - Market size and forecast 2025-2030

Chart on Hastelloy - Market size and forecast 2025-2030 ($ million)
Data Table on Hastelloy - Market size and forecast 2025-2030 ($ million)
Chart on Hastelloy - Year-over-year growth 2025-2030 (%)
Data Table on Hastelloy - Year-over-year growth 2025-2030 (%)

10.6 Others - Market size and forecast 2025-2030

Chart on Others - Market size and forecast 2025-2030 ($ million)
Data Table on Others - Market size and forecast 2025-2030 ($ million)
Chart on Others - Year-over-year growth 2025-2030 (%)
Data Table on Others - Year-over-year growth 2025-2030 (%)

10.7 Market opportunity by Material

Market opportunity by Material ($ million)
Data Table on Market opportunity by Material ($ million)

11. Customer Landscape

11.1 Customer landscape overview

Analysis of price sensitivity, lifecycle, customer purchase basket, adoption rates, and purchase criteria

12. Geographic Landscape

12.1 Geographic segmentation

Chart on Market share by geography 2025-2030 (%)
Data Table on Market share by geography 2025-2030 (%)

12.2 Geographic comparison

Chart on Geographic comparison
Data Table on Geographic comparison

12.3 APAC - Market size and forecast 2025-2030

Chart on APAC - Market size and forecast 2025-2030 ($ million)
Data Table on APAC - Market size and forecast 2025-2030 ($ million)
Chart on APAC - Year-over-year growth 2025-2030 (%)
Data Table on APAC - Year-over-year growth 2025-2030 (%)
Chart on Regional Comparison - APAC
Data Table on Regional Comparison - APAC

12.3.1 China - Market size and forecast 2025-2030

Chart on China - Market size and forecast 2025-2030 ($ million)
Data Table on China - Market size and forecast 2025-2030 ($ million)
Chart on China - Year-over-year growth 2025-2030 (%)
Data Table on China - Year-over-year growth 2025-2030 (%)

12.3.2 Japan - Market size and forecast 2025-2030

Chart on Japan - Market size and forecast 2025-2030 ($ million)
Data Table on Japan - Market size and forecast 2025-2030 ($ million)
Chart on Japan - Year-over-year growth 2025-2030 (%)
Data Table on Japan - Year-over-year growth 2025-2030 (%)

12.3.3 India - Market size and forecast 2025-2030

Chart on India - Market size and forecast 2025-2030 ($ million)
Data Table on India - Market size and forecast 2025-2030 ($ million)
Chart on India - Year-over-year growth 2025-2030 (%)
Data Table on India - Year-over-year growth 2025-2030 (%)

12.3.4 South Korea - Market size and forecast 2025-2030

Chart on South Korea - Market size and forecast 2025-2030 ($ million)
Data Table on South Korea - Market size and forecast 2025-2030 ($ million)
Chart on South Korea - Year-over-year growth 2025-2030 (%)
Data Table on South Korea - Year-over-year growth 2025-2030 (%)

12.3.5 Australia - Market size and forecast 2025-2030

Chart on Australia - Market size and forecast 2025-2030 ($ million)
Data Table on Australia - Market size and forecast 2025-2030 ($ million)
Chart on Australia - Year-over-year growth 2025-2030 (%)
Data Table on Australia - Year-over-year growth 2025-2030 (%)

12.3.6 Indonesia - Market size and forecast 2025-2030

Chart on Indonesia - Market size and forecast 2025-2030 ($ million)
Data Table on Indonesia - Market size and forecast 2025-2030 ($ million)
Chart on Indonesia - Year-over-year growth 2025-2030 (%)
Data Table on Indonesia - Year-over-year growth 2025-2030 (%)

12.4 Europe - Market size and forecast 2025-2030

Chart on Europe - Market size and forecast 2025-2030 ($ million)
Data Table on Europe - Market size and forecast 2025-2030 ($ million)
Chart on Europe - Year-over-year growth 2025-2030 (%)
Data Table on Europe - Year-over-year growth 2025-2030 (%)
Chart on Regional Comparison - Europe
Data Table on Regional Comparison - Europe

12.4.1 Germany - Market size and forecast 2025-2030

Chart on Germany - Market size and forecast 2025-2030 ($ million)
Data Table on Germany - Market size and forecast 2025-2030 ($ million)
Chart on Germany - Year-over-year growth 2025-2030 (%)
Data Table on Germany - Year-over-year growth 2025-2030 (%)

12.4.2 France - Market size and forecast 2025-2030

Chart on France - Market size and forecast 2025-2030 ($ million)
Data Table on France - Market size and forecast 2025-2030 ($ million)
Chart on France - Year-over-year growth 2025-2030 (%)
Data Table on France - Year-over-year growth 2025-2030 (%)

12.4.3 UK - Market size and forecast 2025-2030

Chart on UK - Market size and forecast 2025-2030 ($ million)
Data Table on UK - Market size and forecast 2025-2030 ($ million)
Chart on UK - Year-over-year growth 2025-2030 (%)
Data Table on UK - Year-over-year growth 2025-2030 (%)

12.4.4 Italy - Market size and forecast 2025-2030

Chart on Italy - Market size and forecast 2025-2030 ($ million)
Data Table on Italy - Market size and forecast 2025-2030 ($ million)
Chart on Italy - Year-over-year growth 2025-2030 (%)
Data Table on Italy - Year-over-year growth 2025-2030 (%)

12.4.5 Spain - Market size and forecast 2025-2030

Chart on Spain - Market size and forecast 2025-2030 ($ million)
Data Table on Spain - Market size and forecast 2025-2030 ($ million)
Chart on Spain - Year-over-year growth 2025-2030 (%)
Data Table on Spain - Year-over-year growth 2025-2030 (%)

12.4.6 The Netherlands - Market size and forecast 2025-2030

Chart on The Netherlands - Market size and forecast 2025-2030 ($ million)
Data Table on The Netherlands - Market size and forecast 2025-2030 ($ million)
Chart on The Netherlands - Year-over-year growth 2025-2030 (%)
Data Table on The Netherlands - Year-over-year growth 2025-2030 (%)

12.5 North America - Market size and forecast 2025-2030

Chart on North America - Market size and forecast 2025-2030 ($ million)
Data Table on North America - Market size and forecast 2025-2030 ($ million)
Chart on North America - Year-over-year growth 2025-2030 (%)
Data Table on North America - Year-over-year growth 2025-2030 (%)
Chart on Regional Comparison - North America
Data Table on Regional Comparison - North America

12.5.1 US - Market size and forecast 2025-2030

Chart on US - Market size and forecast 2025-2030 ($ million)
Data Table on US - Market size and forecast 2025-2030 ($ million)
Chart on US - Year-over-year growth 2025-2030 (%)
Data Table on US - Year-over-year growth 2025-2030 (%)

12.5.2 Canada - Market size and forecast 2025-2030

Chart on Canada - Market size and forecast 2025-2030 ($ million)
Data Table on Canada - Market size and forecast 2025-2030 ($ million)
Chart on Canada - Year-over-year growth 2025-2030 (%)
Data Table on Canada - Year-over-year growth 2025-2030 (%)

12.5.3 Mexico - Market size and forecast 2025-2030

Chart on Mexico - Market size and forecast 2025-2030 ($ million)
Data Table on Mexico - Market size and forecast 2025-2030 ($ million)
Chart on Mexico - Year-over-year growth 2025-2030 (%)
Data Table on Mexico - Year-over-year growth 2025-2030 (%)

12.6 South America - Market size and forecast 2025-2030

Chart on South America - Market size and forecast 2025-2030 ($ million)
Data Table on South America - Market size and forecast 2025-2030 ($ million)
Chart on South America - Year-over-year growth 2025-2030 (%)
Data Table on South America - Year-over-year growth 2025-2030 (%)
Chart on Regional Comparison - South America
Data Table on Regional Comparison - South America

12.6.1 Brazil - Market size and forecast 2025-2030

Chart on Brazil - Market size and forecast 2025-2030 ($ million)
Data Table on Brazil - Market size and forecast 2025-2030 ($ million)
Chart on Brazil - Year-over-year growth 2025-2030 (%)
Data Table on Brazil - Year-over-year growth 2025-2030 (%)

12.6.2 Argentina - Market size and forecast 2025-2030

Chart on Argentina - Market size and forecast 2025-2030 ($ million)
Data Table on Argentina - Market size and forecast 2025-2030 ($ million)
Chart on Argentina - Year-over-year growth 2025-2030 (%)
Data Table on Argentina - Year-over-year growth 2025-2030 (%)

12.6.3 Chile - Market size and forecast 2025-2030

Chart on Chile - Market size and forecast 2025-2030 ($ million)
Data Table on Chile - Market size and forecast 2025-2030 ($ million)
Chart on Chile - Year-over-year growth 2025-2030 (%)
Data Table on Chile - Year-over-year growth 2025-2030 (%)

12.7 Middle East and Africa - Market size and forecast 2025-2030

Chart on Middle East and Africa - Market size and forecast 2025-2030 ($ million)
Data Table on Middle East and Africa - Market size and forecast 2025-2030 ($ million)
Chart on Middle East and Africa - Year-over-year growth 2025-2030 (%)
Data Table on Middle East and Africa - Year-over-year growth 2025-2030 (%)
Chart on Regional Comparison - Middle East and Africa
Data Table on Regional Comparison - Middle East and Africa

12.7.1 Saudi Arabia - Market size and forecast 2025-2030

Chart on Saudi Arabia - Market size and forecast 2025-2030 ($ million)
Data Table on Saudi Arabia - Market size and forecast 2025-2030 ($ million)
Chart on Saudi Arabia - Year-over-year growth 2025-2030 (%)
Data Table on Saudi Arabia - Year-over-year growth 2025-2030 (%)

12.7.2 South Africa - Market size and forecast 2025-2030

Chart on South Africa - Market size and forecast 2025-2030 ($ million)
Data Table on South Africa - Market size and forecast 2025-2030 ($ million)
Chart on South Africa - Year-over-year growth 2025-2030 (%)
Data Table on South Africa - Year-over-year growth 2025-2030 (%)

12.7.3 UAE - Market size and forecast 2025-2030

Chart on UAE - Market size and forecast 2025-2030 ($ million)
Data Table on UAE - Market size and forecast 2025-2030 ($ million)
Chart on UAE - Year-over-year growth 2025-2030 (%)
Data Table on UAE - Year-over-year growth 2025-2030 (%)

12.7.4 Turkey - Market size and forecast 2025-2030

Chart on Turkey - Market size and forecast 2025-2030 ($ million)
Data Table on Turkey - Market size and forecast 2025-2030 ($ million)
Chart on Turkey - Year-over-year growth 2025-2030 (%)
Data Table on Turkey - Year-over-year growth 2025-2030 (%)

12.7.5 Egypt - Market size and forecast 2025-2030

Chart on Egypt - Market size and forecast 2025-2030 ($ million)
Data Table on Egypt - Market size and forecast 2025-2030 ($ million)
Chart on Egypt - Year-over-year growth 2025-2030 (%)
Data Table on Egypt - Year-over-year growth 2025-2030 (%)

12.8 Market opportunity by geography

Market opportunity by geography ($ million)
Data Tables on Market opportunity by geography ($ million)

13. Drivers, Challenges, and Opportunity

13.1 Market drivers

Escalating stringency of regulatory frameworks and hygiene standards
Sustained expansion of key end-use industries
Continuous technological innovation and focus on operational efficiency

13.2 Market challenges

Overcoming high capital expenditure and total cost of ownership hurdles
Managing intense competition and pervasive price pressures
Supply chain volatility and raw material cost instability

13.3 Impact of drivers and challenges

Impact of drivers and challenges in 2025 and 2030

13.4 Market opportunities

Proliferation of intelligent pumping solutions and digitalization
Ascendancy of single-use technologies in biopharmaceutical applications
Intensified focus on energy efficiency and sustainable operations

14. Competitive Landscape

14.1 Overview

14.2

Overview on criticality of inputs and factors of differentiation

14.3 Landscape disruption

Overview on factors of disruption

14.4 Industry risks

Impact of key risks on business

15. Competitive Analysis

15.1 Companies profiled

Companies covered

15.2 Company ranking index

15.3 Market positioning of companies

Matrix on companies position and classification

15.4 Alfa Laval AB

Alfa Laval AB - Overview
Alfa Laval AB - Business segments
Alfa Laval AB - Key offerings
Alfa Laval AB - Segment focus
SWOT

15.5 Ampco Pumps Co.

Ampco Pumps Co. - Overview
Ampco Pumps Co. - Product / Service
Ampco Pumps Co. - Key offerings
SWOT

15.6 Erich NETZSCH BV and Co.

Erich NETZSCH BV and Co. - Overview
Erich NETZSCH BV and Co. - Product / Service
Erich NETZSCH BV and Co. - Key offerings
SWOT

15.7 GEA Group AG

GEA Group AG - Overview
GEA Group AG - Business segments
GEA Group AG - Key offerings
GEA Group AG - Segment focus
SWOT

15.8 Goulds Pumps

Goulds Pumps - Overview
Goulds Pumps - Product / Service
Goulds Pumps - Key offerings
SWOT

15.9 IDEX Corp.

IDEX Corp. - Overview
IDEX Corp. - Business segments
IDEX Corp. - Key offerings
IDEX Corp. - Segment focus
SWOT

15.10 INOXPA USA Inc.

INOXPA USA Inc. - Overview
INOXPA USA Inc. - Product / Service
INOXPA USA Inc. - Key offerings
SWOT

15.11 KSB SE and Co. KGaA

KSB SE and Co. KGaA - Overview
KSB SE and Co. KGaA - Business segments
KSB SE and Co. KGaA - Key offerings
KSB SE and Co. KGaA - Segment focus
SWOT

15.12 LEWA GmbH

LEWA GmbH - Overview
LEWA GmbH - Product / Service
LEWA GmbH - Key offerings
SWOT

15.13 NOV Inc.

NOV Inc. - Overview
NOV Inc. - Business segments
NOV Inc. - Key offerings
NOV Inc. - Segment focus
SWOT

15.14 Pentair Plc

Pentair Plc - Overview
Pentair Plc - Business segments
Pentair Plc - Key offerings
Pentair Plc - Segment focus
SWOT

15.15 Q Pumps

Q Pumps - Overview
Q Pumps - Product / Service
Q Pumps - Key offerings
SWOT

15.16 Spirax Group

Spirax Group - Overview
Spirax Group - Business segments
Spirax Group - Key offerings
Spirax Group - Segment focus
SWOT

15.17 SPX FLOW Inc.

SPX FLOW Inc. - Overview
SPX FLOW Inc. - Product / Service
SPX FLOW Inc. - Key news
SPX FLOW Inc. - Key offerings
SWOT

15.18 Verder Liquids

Verder Liquids - Overview
Verder Liquids - Product / Service
Verder Liquids - Key offerings
SWOT

16. Appendix

16.1 Scope of the report

Market definition
Objectives
Notes and caveats

16.2 Inclusions and exclusions checklist

Inclusions checklist
Exclusions checklist

16.3 Currency conversion rates for US$

16.4 Research methodology

16.5 Data procurement

Information sources

16.6 Data validation

16.7 Validation techniques employed for market sizing

16.8 Data synthesis

16.9 360 degree market analysis

16.10 List of abbreviations

Research Methodology

Technavio presents a detailed picture of the market by way of study, synthesis, and summation of data from multiple sources. The analysts have presented the various facets of the market with a particular focus on identifying the key industry influencers. The data thus presented is comprehensive, reliable, and the result of extensive research, both primary and secondary.

INFORMATION SOURCES

Primary sources

  • Manufacturers and suppliers
  • Channel partners
  • Industry experts
  • Strategic decision makers

Secondary sources

  • Industry journals and periodicals
  • Government data
  • Financial reports of key industry players
  • Historical data
  • Press releases

DATA ANALYSIS

Data Synthesis

  • Collation of data
  • Estimation of key figures
  • Analysis of derived insights

Data Validation

  • Triangulation with data models
  • Reference against proprietary databases
  • Corroboration with industry experts

REPORT WRITING

Qualitative

  • Market drivers
  • Market challenges
  • Market trends
  • Five forces analysis

Quantitative

  • Market size and forecast
  • Market segmentation
  • Geographical insights
  • Competitive landscape

Interested in this report?

Get your sample now to see our research methodology and insights!

Download Now

Frequently Asked Questions

Sanitary Pumps market growth will increase by USD 611.4 million during 2026-2030.

The Sanitary Pumps market is expected to grow at a CAGR of 4.2% during 2026-2030.

Sanitary Pumps market is segmented by Type (Kinetic sanitary pumps, Positive displacement (PD) sanitary pumps) End-user (Food and beverage, Pharmaceutical and biotechnology applications, Others) Material (Stainless steel, Plastic, Hastelloy, Others)

Alfa Laval AB, Ampco Pumps Co., Axiflow Technologies Inc., Erich NETZSCH BV and Co., Fristam, GEA Group AG, Goulds Pumps, IDEX Corp., INOXPA USA Inc., KSB SE and Co. KGaA, LEWA GmbH, NOV Inc., Pentair Plc, PSG Dover, Q Pumps, Spirax Group, SPX FLOW Inc., Sulzer Ltd., Verder Liquids, Xylem Inc. are a few of the key vendors in the Sanitary Pumps market.

APAC will register the highest growth rate of 57.1% among the other regions. Therefore, the Sanitary Pumps market in APAC is expected to garner significant business opportunities for the vendors during the forecast period.

China, Japan, India, South Korea, Australia, Indonesia, Germany, France, UK, Italy, Spain, The Netherlands, US, Canada, Mexico, Brazil, Argentina, Chile, Saudi Arabia, South Africa, UAE, Turkey, Egypt

  • Escalating stringency of regulatory frameworks and hygiene standards is the driving factor this market.

The Sanitary Pumps market vendors should focus on grabbing business opportunities from the Type segment as it accounted for the largest market share in the base year.
RIA - Research AI Assistant
Ask RIA