Super Absorbent Polymer Market Size 2025-2029
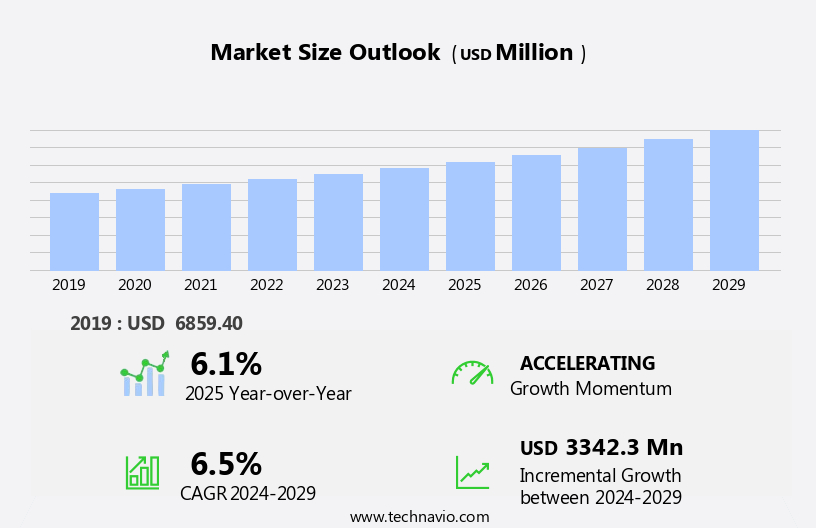
The super absorbent polymer market size is forecast to increase by USD 3.34 billion, at a CAGR of 6.5% between 2024 and 2029.
- The Super Absorbent Polymer (SAP) market is driven by the surging demand for hygiene products, particularly in developing regions. This trend is particularly prominent in sectors such as diapers, sanitary napkins, and wipes, where SAPs are essential components. Furthermore, there is a growing shift toward sustainability and eco-friendliness in consumer goods, which is positively impacting the market as SAPs offer water-saving and waste reduction benefits. However, market growth is not without challenges. Fluctuating raw material prices, primarily acrylic acid and sodium acrylate, pose significant risks to market participants.
- Navigating these challenges and capitalizing on the market's growth opportunities requires strategic planning and a deep understanding of the evolving consumer landscape. Companies must stay agile and responsive to market trends while maintaining a focus on cost efficiency and sustainability to remain competitive.
What will be the Size of the Super Absorbent Polymer Market during the forecast period?
Explore in-depth regional segment analysis with market size data - historical 2019-2023 and forecasts 2025-2029 - in the full report.
Request Free Sample
The super absorbent polymer (SAP) market continues to evolve, driven by the dynamic interplay of various market forces and applications. These polymers, renowned for their impressive fluid control capabilities, exhibit swelling capacity that far surpasses their dry weight. Cross-linked polymers, such as sodium polyacrylate and potassium polyacrylate, are at the forefront of this market, offering superior water management and water retention properties. In the realm of personal care, SAPs find extensive use in hygiene products like sanitary napkins and incontinence products, where their ability to absorb and retain large volumes of fluid is paramount. In the medical sector, they are indispensable in medical devices and wound dressings, enhancing quality control and ensuring leakage prevention.
SAPs' environmental impact and disposal methods are increasingly under scrutiny, necessitating ongoing research and development in processing techniques. Particle size distribution, chemical resistance, and non-ionic polymers are crucial considerations in this regard. Regulatory compliance is another critical factor shaping the market. Absorbent pads and construction materials, including concrete additives, incorporate SAPs to improve performance and meet various industry standards. Injection molding and other processing techniques enable the production of composite materials, expanding the potential applications of these polymers. SAPs' versatility extends to sectors like food packaging, where they enhance water absorption and provide thermal stability and UV resistance. Amphoteric polymers and polymer blends offer additional benefits, such as improved tensile strength and gel strength, further expanding their applications.
The continuous unfolding of market activities and evolving patterns in the SAP market underscore the importance of staying informed about the latest developments in this dynamic field.
How is this Super Absorbent Polymer Industry segmented?
The super absorbent polymer industry research report provides comprehensive data (region-wise segment analysis), with forecasts and estimates in "USD million" for the period 2025-2029, as well as historical data from 2019-2023 for the following segments.
- Type
- Sodium polyacrylate
- Polyacrylamide
- Others
- Application
- Personal hygiene
- Medical
- Agriculture
- Others
- Production Method
- Suspension Polymerization
- Solution Polymerization
- Gel Polymerization
- Geography
- North America
- US
- Canada
- Europe
- France
- Germany
- Italy
- UK
- Middle East and Africa
- Egypt
- KSA
- Oman
- UAE
- APAC
- China
- India
- Japan
- South America
- Argentina
- Brazil
- Rest of World (ROW)
- North America
By Type Insights
The sodium polyacrylate segment is estimated to witness significant growth during the forecast period.
Super Absorbent Polymers (SAPs) are a type of cross-linked polymer renowned for their impressive water management properties. SAPs, particularly sodium polyacrylate, exhibit an extraordinary swelling capacity, capable of absorbing up to 300 times their weight in water. This characteristic is essential in various industries, including hygiene and healthcare. In the hygiene sector, sodium polyacrylate is extensively used in the production of sanitary napkins, diapers, and incontinence products. Its superior water retention abilities ensure user comfort and effectiveness. In medical devices, SAPs play a crucial role in wound dressings, enhancing their absorbency and promoting healing. Surface modification techniques are employed to optimize the SAPs' particle size distribution and chemical resistance, catering to diverse applications.
Anionic and non-ionic polymers are used in SAP production, with each offering unique advantages. Anionic polymers, such as sodium polyacrylate, provide excellent water absorption, while non-ionic polymers, like potassium polyacrylate, offer superior thermal stability and UV resistance. Regulatory compliance is a significant factor in the SAP market, with stringent quality control measures in place to ensure product safety and efficacy. Injection molding and other processing techniques are employed to manufacture absorbent pads, composite materials, and concrete additives. SAPs are also used in food packaging to maintain moisture levels and extend shelf life. Environmental concerns have led to research into SAP disposal methods and their impact on soil improvement.
Testing standards and gel strength are crucial factors in evaluating SAP performance and ensuring consistency in manufacturing processes. Overall, the SAP market continues to evolve, with ongoing research and development focusing on enhancing absorbency rates, leakage prevention, and improving the sustainability of these essential materials.
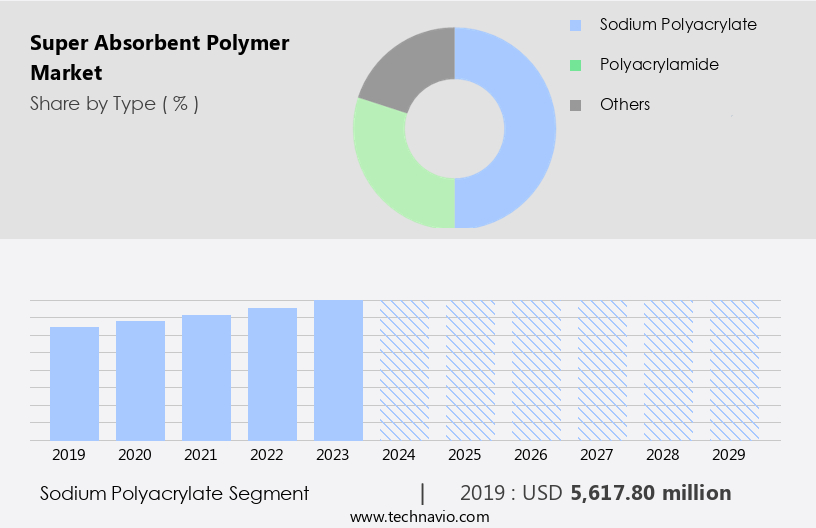
The Sodium polyacrylate segment was valued at USD 5.62 billion in 2019 and showed a gradual increase during the forecast period.
Regional Analysis
APAC is estimated to contribute 39% to the growth of the global market during the forecast period.Technavio's analysts have elaborately explained the regional trends and drivers that shape the market during the forecast period.
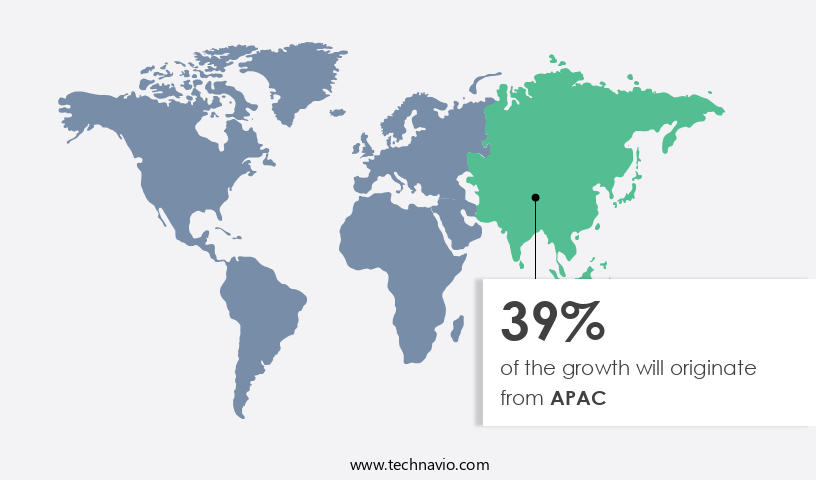
The Asia-Pacific (APAC) region is a significant contributor to The market, fueled by demographic shifts, economic growth, and technological advancements. With an aging population, particularly in China and Japan, the demand for super absorbent polymers (SAP) is on the rise, particularly in applications such as adult incontinence products and healthcare. In 2023, 14% of China's population and 30% of Japan's population were aged 65 and above, according to World Bank data. This demographic trend, coupled with the increasing per capita disposable income in countries like China, is driving the market for high-quality SAP products. In 2023, China's per capita disposable income reached approximately USD5,511, reflecting a 6.3% year-on-year increase, as reported by the National Bureau of Statistics of China.
This economic growth is enhancing consumer purchasing power, further boosting the demand for SAP products in various industries, including personal care, construction materials, and medical devices. The production and application of SAP involve several processes, including cross-linking, surface modification, and particle size distribution control. These polymers, which can be anionic, cationic, or non-ionic, exhibit excellent water absorption and retention capabilities, making them ideal for use in fluid control and water management applications. In addition to their use in hygiene products and healthcare applications, SAP is also utilized in industries such as food packaging, concrete additives, and composite materials. The production techniques used to manufacture SAP, such as injection molding and solution casting, require stringent quality control measures to ensure the final product's absorbency rate, tensile strength, and thermal stability meet regulatory compliance standards.
The environmental impact of SAP disposal methods and the development of sustainable disposal methods are also key areas of focus for market participants. In the production of SAP, various polymers, such as sodium polyacrylate, potassium polyacrylate, and acrylic polymers, are used. These polymers exhibit varying molecular weights and chemical resistances, which impact their applications and performance characteristics. For instance, sodium polyacrylate is commonly used in absorbent pads due to its high absorbency rate and swelling capacity, while potassium polyacrylate is preferred in applications requiring leakage prevention due to its thermal stability and UV resistance. In conclusion, the market in the APAC region is experiencing significant growth due to demographic shifts, economic growth, and industrial advancements.
The demand for SAP is driven by its use in various industries, including personal care, healthcare, and construction materials, due to its excellent water absorption and retention capabilities. The production and application of SAP involve various processes and polymers, each with unique characteristics that impact their performance and applications. Market participants must focus on stringent quality control measures, sustainable disposal methods, and the development of innovative applications to remain competitive in this evolving market.
Market Dynamics
Our researchers analyzed the data with 2024 as the base year, along with the key drivers, trends, and challenges. A holistic analysis of drivers will help companies refine their marketing strategies to gain a competitive advantage.
The market is a dynamic and growing industry, driven by the increasing demand for water management solutions in various sectors. These polymers, also known as hydrogel beads, exhibit remarkable water absorption capabilities, making them essential in applications such as diapers, agricultural, and oil recovery. Super absorbent polymers are typically made from acrylate or starch-based materials, with cross-linked structures that enable them to absorb up to 500 times their weight in water. Their unique properties make them indispensable in water treatment, wastewater management, and civil engineering projects. Furthermore, advancements in nanotechnology have led to the development of super absorbent nanoparticles, opening new opportunities in biomedical applications. The market is expected to grow significantly due to the rising awareness of water scarcity and the need for sustainable water management solutions. Super absorbent polymers offer a cost-effective and eco-friendly alternative to traditional methods, making them a preferred choice for numerous industries.
What are the key market drivers leading to the rise in the adoption of Super Absorbent Polymer Industry?
- The increasing necessity for maintaining personal hygiene is the primary factor fueling the market growth for hygiene products.
- The global super absorbent polymer (SAP) market experiences significant growth due to the increasing demand for hygiene products. With a growing population, particularly in developing regions, there is a heightened need for essential hygiene items such as diapers, adult incontinence products, and sanitary napkins. SAPs, which have the unique ability to absorb large quantities of liquid, are integral to these products, ensuring comfort and dryness for extended periods. In developed markets, there is a rising preference for premium hygiene products with enhanced performance. Consumers are increasingly aware of the importance of high-quality, comfortable, and efficient products.
- As a result, there is a demand for diapers and incontinence pads with superior absorbency. Cross-linked polymers, including anionic polymers, are commonly used in the production of SAPs. These polymers undergo surface modification to increase their swelling capacity, making them ideal for fluid control and water management applications. The use of SAPs in medical devices is also expanding, as they offer excellent water retention properties and contribute to improved patient care. Quality control is a crucial factor in the production of SAPs. Ensuring consistency in the polymer's properties is essential to maintain the performance and reliability of the final product.
- By addressing the need for high-quality, efficient, and comfortable hygiene products, the market continues to thrive.
What are the market trends shaping the Super Absorbent Polymer Industry?
- The trend in the market is moving towards sustainability. As a professional, it is essential to recognize and adapt to this shift in consumer preferences.
- The super absorbent polymer (SAP) market is witnessing a significant trend towards sustainability in response to growing environmental concerns. With increasing pressure from consumers and regulatory bodies, SAP manufacturers are focusing on developing eco-friendly alternatives, reducing carbon footprints, and incorporating renewable resources in their production processes. Traditional SAPs, often derived from petrochemicals, have a substantial environmental impact and can take centuries to decompose. An illustration of this shift is BASF's launch of HySorb B 6610 ZeroPCF on February 6, 2025. This product, which does not contain any polyethylene (PE) or polypropylene (PP) microplastics, is a prime example of the industry's commitment to sustainability.
- Processing techniques, such as injection molding, are being optimized to improve particle size distribution and chemical resistance. Non-ionic polymers are gaining popularity due to their compatibility with various liquids and their ability to swell without releasing ions. In the construction materials sector, SAPs are being used in absorbent pads for waterproofing and insulation. In the healthcare industry, they are used in incontinence products. Regulatory compliance is crucial in both sectors, ensuring the safety and effectiveness of these products. In conclusion, the market is evolving to meet the demands of a more sustainable future.
- Manufacturers are focusing on developing eco-friendly alternatives, optimizing processing techniques, and ensuring regulatory compliance to meet the needs of various industries.
What challenges does the Super Absorbent Polymer Industry face during its growth?
- The volatility of raw material prices poses a significant challenge to the industry's growth trajectory.
- The market faces significant challenges due to the volatility of raw material prices, particularly crude oil. Super absorbent polymers, or SAPs, are primarily derived from petroleum-based chemicals, making their production costs sensitive to oil price fluctuations. In April 2025, crude oil prices experienced a sharp decline, with Brent crude falling over 20% in a week to a four-year low of USD66 per barrel. This drop was attributed to new U.S. Tariffs and a reduced global oil demand outlook. Although this price decrease benefits oil-importing countries by lowering import costs, it also indicates underlying economic challenges that can impact the overall demand for SAPs in various sectors, including concrete additives, personal care, composite materials, acrylic polymers, and food packaging.
- SAPs are essential in these industries due to their high water absorption capacity and tensile strength. As such, any significant changes in the price of crude oil can have a ripple effect on the production costs and demand for SAPs.
Exclusive Customer Landscape
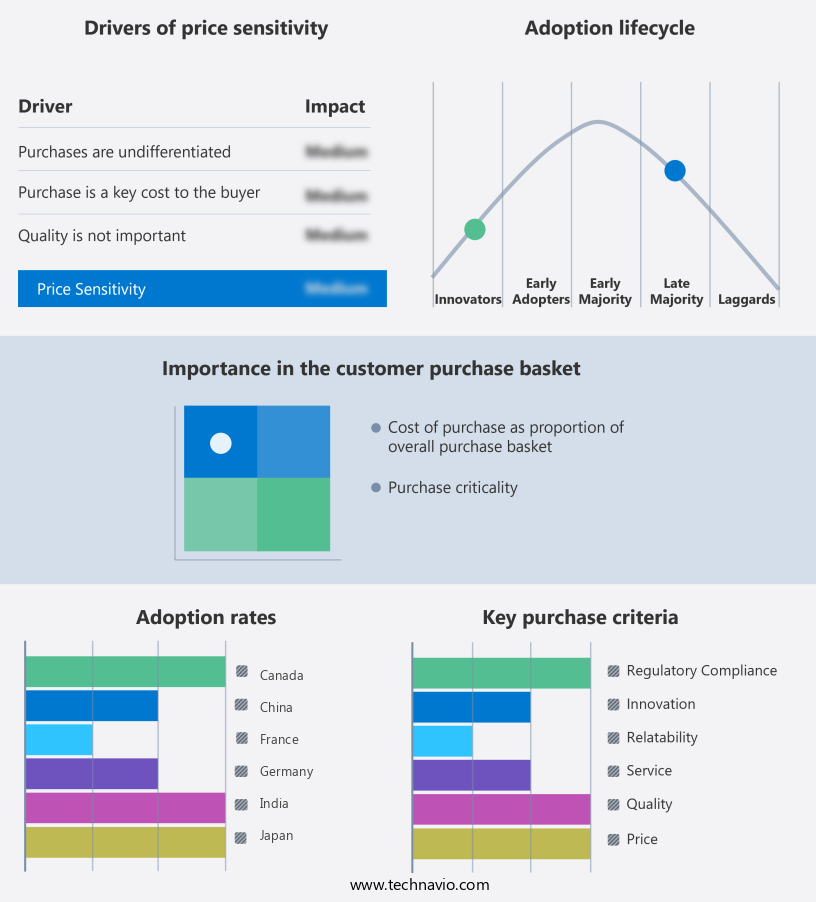
The super absorbent polymer market forecasting report includes the adoption lifecycle of the market, covering from the innovator's stage to the laggard's stage. It focuses on adoption rates in different regions based on penetration. Furthermore, the super absorbent polymer market report also includes key purchase criteria and drivers of price sensitivity to help companies evaluate and develop their market growth analysis strategies.
Customer Landscape
Key Companies & Market Insights
Companies are implementing various strategies, such as strategic alliances, super absorbent polymer market forecast, partnerships, mergers and acquisitions, geographical expansion, and product/service launches, to enhance their presence in the industry.
Arkema Group - This company specializes in the production and supply of advanced super absorbent polymers, including HySorb and SAPs from SAVIVA. These innovative materials have the unique ability to absorb and retain substantial amounts of liquid.
The industry research and growth report includes detailed analyses of the competitive landscape of the market and information about key companies, including:
- Arkema Group
- BASF SE
- Chase Corporation
- Chemtex Speciality Limited
- Evonik Industries AG
- Formosa Plastics Corporation
- Kao Corporation
- LG Chem
- Maple Biotech Private Limited
- Nippon Shokubai Co. Ltd.
- Qingdao Soco New Material Co., Ltd.
- San-Dia Polymers Ltd.
- Sanyo Chemical Industries Ltd.
- Satellite Science & Technology Co., Ltd.
- SDP Global
- SNF (Société Nationale des Poudres et Explosifs)
- Songwon Industrial Co. Ltd.
- Sumitomo Seika Chemicals Co. Ltd.
- Wanhua Chemical Group Co., Ltd.
- Yixing Danson Technology
Qualitative and quantitative analysis of companies has been conducted to help clients understand the wider business environment as well as the strengths and weaknesses of key industry players. Data is qualitatively analyzed to categorize companies as pure play, category-focused, industry-focused, and diversified; it is quantitatively analyzed to categorize companies as dominant, leading, strong, tentative, and weak.
Recent Development and News in Super Absorbent Polymer Market
- In January 2024, BASF SE, a leading chemical producer, announced the expansion of its super absorbent polymer (SAP) production capacity at its site in Ludwigshafen, Germany. This expansion aimed to meet the growing demand for SAPs in various applications, including agriculture, construction, and personal care (BASF press release, 2024).
- In March 2024, LG Chem and LG Energy Solution, South Korean chemical and battery manufacturers, entered into a strategic partnership to develop and commercialize SAPs for use in lithium-ion batteries. This collaboration aimed to improve battery performance and enhance sustainability by reducing the amount of water used in battery manufacturing (LG Chem press release, 2024).
- In May 2025, Clariant International AG, a Swiss specialty chemicals company, completed the acquisition of the SAP business of Huntsman Corporation. This acquisition strengthened Clariant's position in the SAP market and expanded its product portfolio, enabling the company to cater to a broader customer base (Clariant press release, 2025).
- In the same month, the European Commission approved the use of SAPs in agricultural applications to reduce water usage. This approval marked a significant milestone in the adoption of SAPs in sustainable agriculture practices and is expected to boost market growth in Europe (European Commission press release, 2025).
Research Analyst Overview
- The super absorbent polymer (SAP) market is driven by various factors, including consumer behavior and brand loyalty, technological trends, and innovation in manufacturing. Green chemistry and material science are key areas of focus, with an increasing emphasis on sustainable practices such as recycling technologies and bio-based polymers. Product lifecycle management and safety regulations are critical considerations, as are manufacturing technology and performance testing to ensure durability and industry standards. Health and safety concerns, as well as government regulations, are shaping the market landscape. Consumer preferences for eco-friendly and sustainable products are leading to the adoption of carbon footprint reduction strategies and the integration of automation in manufacturing.
- Pricing strategies and raw material sourcing are also important factors, with intellectual property and competitive advantages playing a significant role in market penetration. Economic factors, such as energy consumption and global supply chains, are influencing the industry. The circular economy and waste management are becoming increasingly important, with a focus on life cycle assessment and product certifications to ensure sustainability and transparency. Durability assessment and manufacturing technology are also crucial for ensuring product quality and meeting consumer expectations. Innovation in manufacturing, including additive manufacturing and polymer chemistry, is driving advancements in the SAP market. The integration of these technologies is enabling the development of new applications and improving the overall efficiency and sustainability of the industry.
- The future of the market is bright, with a focus on meeting evolving consumer demands and staying ahead of regulatory requirements.
Dive into Technavio's robust research methodology, blending expert interviews, extensive data synthesis, and validated models for unparalleled Super Absorbent Polymer Market insights. See full methodology.
|
Market Scope |
|
|
Report Coverage |
Details |
|
Page number |
212 |
|
Base year |
2024 |
|
Historic period |
2019-2023 |
|
Forecast period |
2025-2029 |
|
Growth momentum & CAGR |
Accelerate at a CAGR of 6.5% |
|
Market growth 2025-2029 |
USD 3342.3 million |
|
Market structure |
Fragmented |
|
YoY growth 2024-2025(%) |
6.1 |
|
Key countries |
US, Canada, Germany, UK, Italy, France, China, India, Japan, Brazil, Egypt, UAE, Oman, Argentina, KSA, UAE, Brazil, and Rest of World (ROW) |
|
Competitive landscape |
Leading Companies, Market Positioning of Companies, Competitive Strategies, and Industry Risks |
What are the Key Data Covered in this Super Absorbent Polymer Market Research and Growth Report?
- CAGR of the Super Absorbent Polymer industry during the forecast period
- Detailed information on factors that will drive the growth and forecasting between 2025 and 2029
- Precise estimation of the size of the market and its contribution of the industry in focus to the parent market
- Accurate predictions about upcoming growth and trends and changes in consumer behaviour
- Growth of the market across APAC, North America, Europe, Middle East and Africa, and South America
- Thorough analysis of the market's competitive landscape and detailed information about companies
- Comprehensive analysis of factors that will challenge the super absorbent polymer market growth of industry companies
We can help! Our analysts can customize this super absorbent polymer market research report to meet your requirements.
 RIA -
RIA - 
