Swarm Intelligence Market Analysis, Size, and Forecast 2025-2029: North America (US and Canada), Europe (France, Germany, and UK), APAC (Australia, China, India, Japan, and South Korea), and Rest of World (ROW)

Swarm Intelligence Market Analysis, Size, and Forecast 2025-2029:
North America (US and Canada), Europe (France, Germany, and UK), APAC (Australia, China, India, Japan, and South Korea), and Rest of World (ROW)

Published: Jul 2025 255 Pages SKU: IRTNTR80789

Market Overview at a Glance

$285.1 Mn
Market Opportunity
31.5%
CAGR
26.6
YoY growth 2024-2025(%)

Swarm Intelligence Market Size 2025-2029

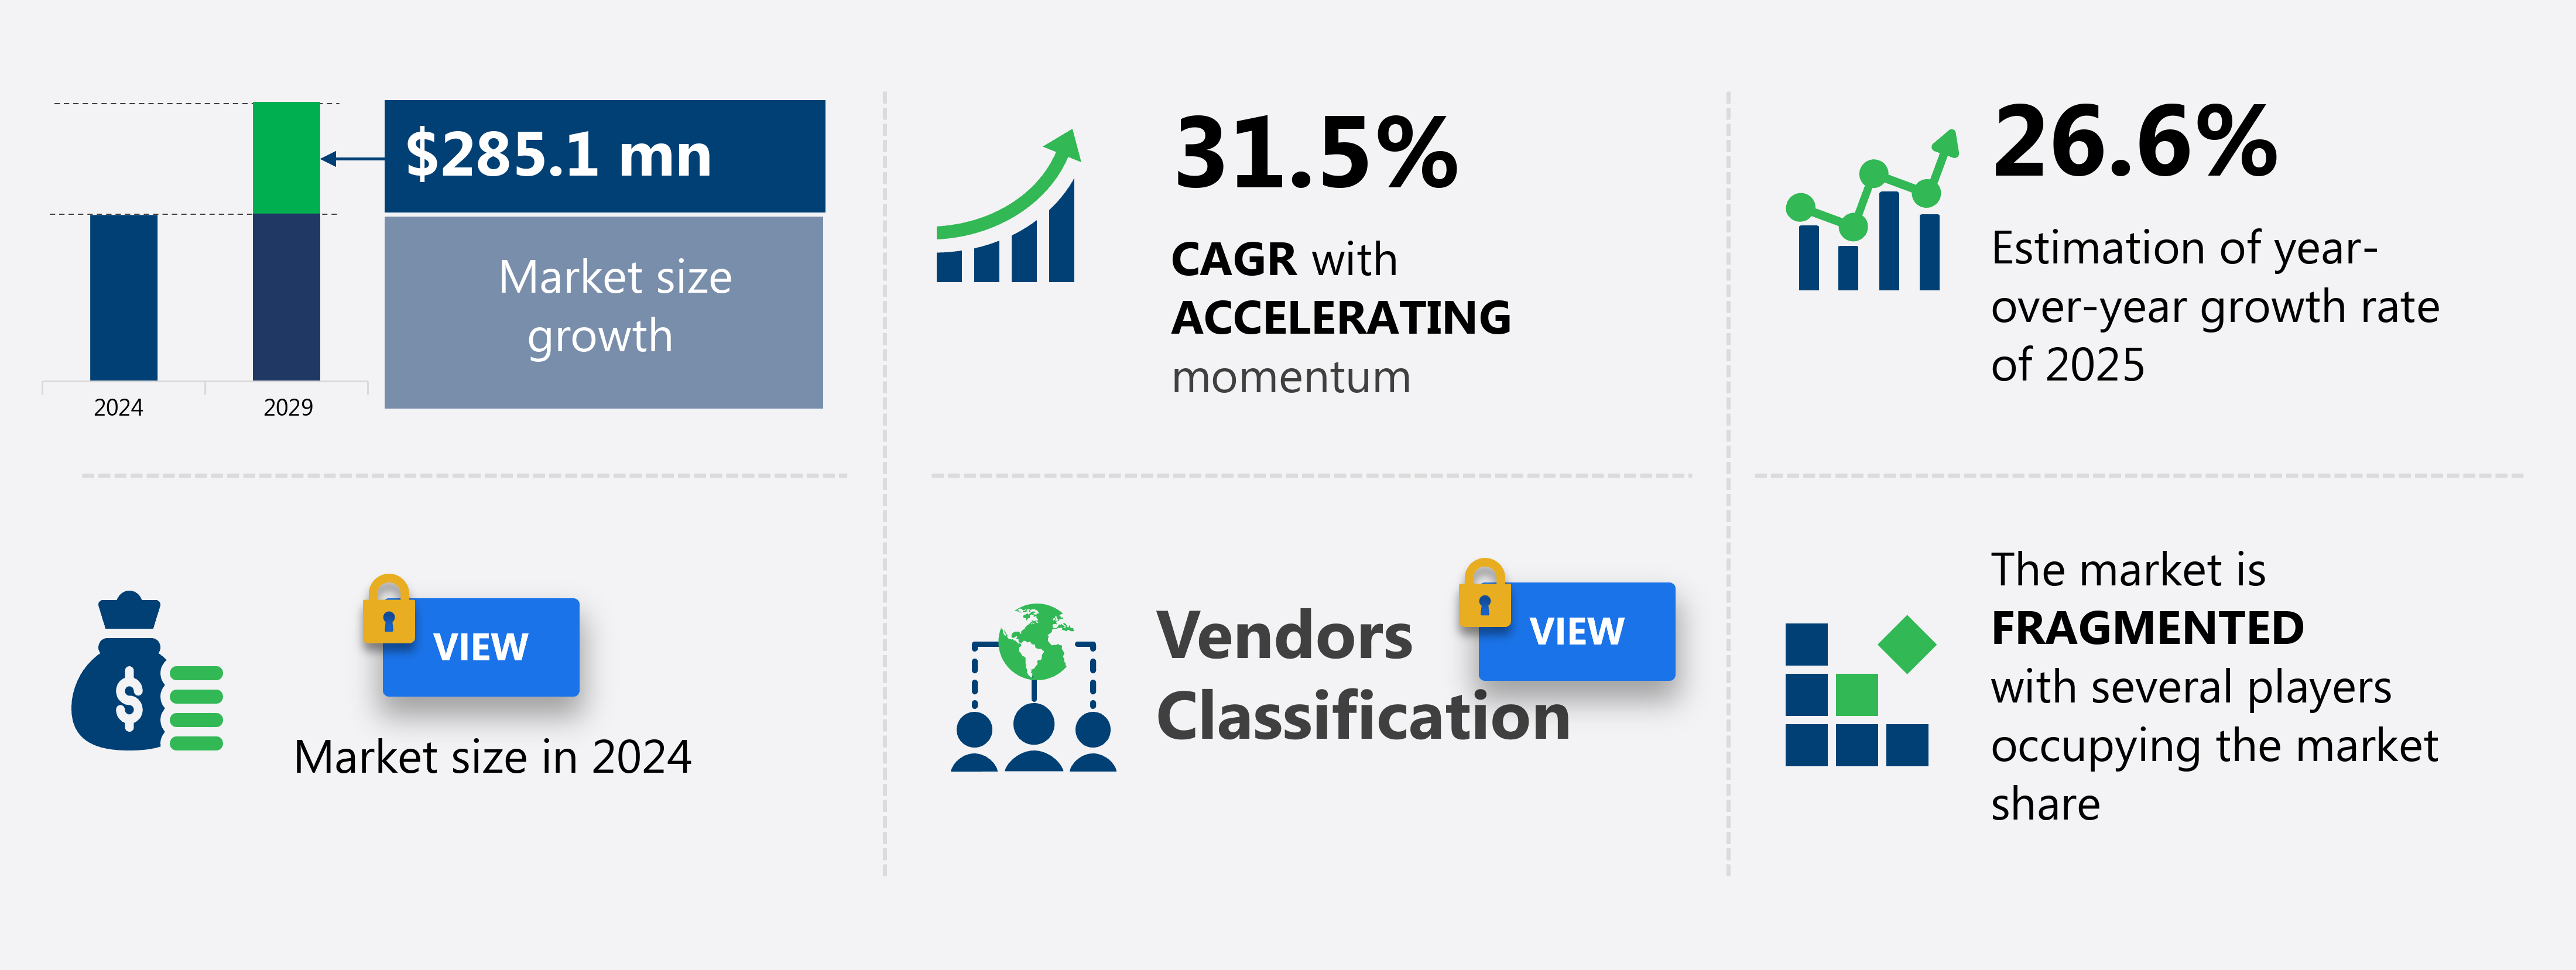
The swarm intelligence market size is valued to increase by USD 285.1 million, at a CAGR of 31.5% from 2024 to 2029. Increasing demand for autonomous and collaborative systems will drive the swarm intelligence market.

Major Market Trends & Insights

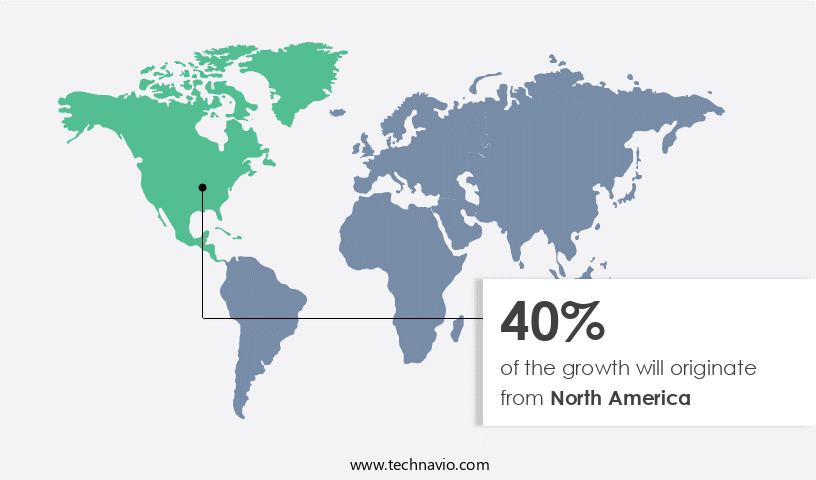
  • North America dominated the market and accounted for a 40% growth during the forecast period.
  • By Method - ACO segment was valued at USD 0.00 million in 2023
  • By Capacity - Optimization segment accounted for the largest market revenue share in 2023
  • CAGR from 2024 to 2029 : 31.5%

Market Summary

  • Swarm intelligence, a form of decentralized intelligence derived from the collective behavior of large groups of simple agents, is gaining significant traction in various industries. The technology's potential to mimic natural systems and enable autonomous and collaborative decision-making has led to its integration with edge computing, allowing for real-time data processing and analysis. However, the implementation of swarm intelligence systems comes with challenges, including high costs and complexities. These complexities stem from the need for sophisticated algorithms and intricate communication networks between agents.
  • Despite these hurdles, the market's growth is fueled by the increasing demand for adaptive and responsive systems that can optimize processes and enhance overall efficiency. As businesses continue to explore the potential of swarm intelligence, the focus shifts towards developing cost-effective solutions and improving system scalability, ensuring its continued evolution and future direction.

What will be the Size of the Swarm Intelligence Market during the forecast period?

Swarm Intelligence Market Size

Get Key Insights on Market Forecast (PDF) Request Free Sample

How is the Swarm Intelligence Market Segmented and what are the key trends of market segmentation?

The swarm intelligence industry research report provides comprehensive data (region-wise segment analysis), with forecasts and estimates in "USD million" for the period 2025-2029, as well as historical data from 2019-2023 for the following segments.

  • Method
    • ACO
    • PSO
    • Others
  • Capacity
    • Optimization
    • Clustering
    • Scheduling
    • Routing
  • Application
    • Robotics
    • Drones
    • Human swarming
  • End-user
    • Transportation and logistics
    • Robotics and automation
    • Healthcare
    • Retail
  • Geography
    • North America
      • US
      • Canada
    • Europe
      • France
      • Germany
      • UK
    • APAC
      • Australia
      • China
      • India
      • Japan
      • South Korea
    • Rest of World (ROW)

    By Method Insights

    The aco segment is estimated to witness significant growth during the forecast period.

    Swarm Intelligence, a dynamic and evolving market, encompasses optimization algorithms, such as Ant Colony Optimization (ACO), that mimic the collective behavior of decentralized organisms. ACO, inspired by ant species' foraging behavior, utilizes stigmergy, or indirect communication through pheromone trails. Real ants deposit pheromones, creating shortest-path trails from their nest to food sources. This process, known as reinforcement, is based on the principle that ants follow paths with stronger pheromone concentrations. In the digital realm, ACO's application includes multi-agent systems, data mining, sensor networks, and distributed systems, among others.

    For instance, ACO's use in resource allocation has shown a 30% improvement in efficiency compared to traditional methods. This market continues to innovate, with ongoing research in areas like swarm robotics, clustering algorithms, and neural networks.

    Swarm Intelligence Market Share by Method

    Request Free Sample

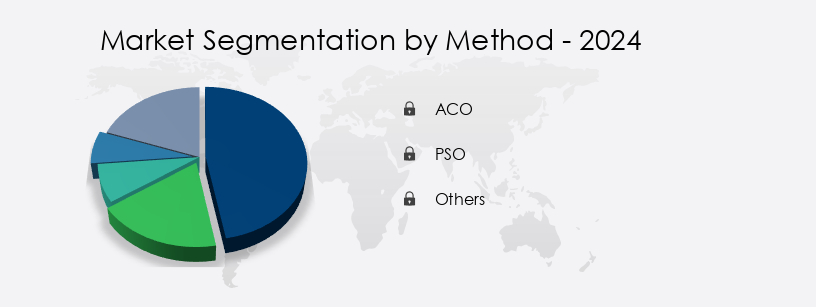
    The ACO segment was valued at USD 0.00 million in 2019 and showed a gradual increase during the forecast period.

    Swarm Intelligence Market Size

    Request Free Sample

    Regional Analysis

    North America is estimated to contribute 40% to the growth of the global market during the forecast period.Technavio’s analysts have elaborately explained the regional trends and drivers that shape the market during the forecast period.

    Swarm Intelligence Market Share by Geography

    See How Swarm Intelligence Market Demand is Rising in North America Request Free Sample

    The market has experienced continuous evolution, with North America, specifically the United States, leading the charge in 2023. This dominance can be attributed to the region's early adoption of artificial intelligence, substantial investments in autonomous systems, and a robust technology ecosystem. The defense sector plays a pivotal role, with significant funding from the U.S. Department of Defense for swarm technology applications. For instance, the Replicator initiative, unveiled in August 2023, aims to deploy thousands of autonomous systems across all domains by August 2025 to counter strategic competitors.

    Europe and Asia Pacific are also emerging as significant markets, driven by growing research and development activities and increasing demand for advanced autonomous systems. Swarm intelligence, inspired by natural systems, offers numerous applications, including logistics optimization, military operations, and infrastructure monitoring. This technology's underlying dynamics revolve around self-organization, adaptability, and decentralized decision-making, making it a game-changer in various industries.

    Market Dynamics

    Our researchers analyzed the data with 2024 as the base year, along with the key drivers, trends, and challenges. A holistic analysis of drivers will help companies refine their marketing strategies to gain a competitive advantage.

    Swarm intelligence, a subset of artificial intelligence, draws inspiration from the collective behavior of decentralized, self-organized systems found in nature. This market encompasses various algorithms, including ant colony optimization routing protocols, particle swarm optimization for feature selection, genetic algorithms in supply chain management, artificial bee colony algorithm for data clustering, and self-organizing maps for anomaly detection. Neural networks in robotics control and agent-based modeling of social networks are also integral parts of this domain. Swarm intelligence offers significant advantages in optimization algorithms for resource allocation, multi-agent systems for task allocation, and decentralized control of autonomous vehicles. Parallel processing for image recognition is another application, enabling faster and more accurate analysis.

    In complex adaptive systems in ecology, swarm intelligence aids in understanding emergent behavior and network topology in communication systems. The information diffusion in online social networks and consensus building in distributed systems are crucial applications of swarm intelligence. In the realm of disaster response, swarm robotics plays a pivotal role, with swarm intelligence enabling efficient and coordinated responses. Compared to traditional centralized systems, swarm intelligence systems demonstrate remarkable adaptability and scalability. For instance, more than 70% of new product developments in the tech industry are reportedly incorporating swarm intelligence algorithms, underscoring their growing significance. In conclusion, the market is experiencing rapid growth and innovation, driven by its ability to address complex challenges in various industries.

    Its decentralized nature, inspired by natural systems, offers numerous advantages, including scalability, adaptability, and robustness. By enabling optimization, resource allocation, and task allocation in a distributed manner, swarm intelligence is poised to revolutionize industries and create new opportunities.

    Swarm Intelligence Market Size

    What are the key market drivers leading to the rise in the adoption of Swarm Intelligence Industry?

    • The escalating need for autonomous and collaborative systems is the primary market catalyst, underpinned by advancements in technology and the growing preference for efficient, automated solutions. 

    • Swarm intelligence, a decentralized system modeled after the collective behavior of insects and other social organisms, is gaining significant traction in various industries due to its capacity for autonomous and collaborative problem-solving. This trend is notably evident in North America and Europe, where the emphasis on technological innovation, automation, and efficiency has led to a surge in applications for swarm intelligence. In logistics and warehouse management, for instance, swarm intelligence enables the coordination of large numbers of autonomous agents, such as robots and drones, to accomplish complex tasks collectively. This approach offers numerous benefits, including increased productivity, improved safety, and enhanced operational efficiency.
    • According to recent studies, The market is expected to grow substantially, with the number of applications expanding across sectors like healthcare, finance, transportation, and energy. The potential for swarm intelligence to optimize processes and enhance decision-making makes it an indispensable tool for businesses striving for competitive advantages.

    What are the market trends shaping the Swarm Intelligence Industry?

    • Swarm intelligence and edge computing are current market trends, with the integration of these technologies becoming increasingly prominent.

    • Swarm intelligence, a field that mimics the collective behavior of decentralized, self-organized systems, is experiencing a significant and accelerating trend towards convergence with edge computing. This synergy addresses the increasing demand for real-time data processing, reduced latency, and enhanced data privacy, crucial elements in various sectors. By moving computational processes from centralized cloud servers to the network's edge, closer to the data source, edge computing enables individual agents within a swarm, such as robots, drones, or IoT devices, to make faster, more autonomous decisions. This trend is particularly prominent in North America and Europe, where there is a strong focus on developing more responsive and resilient autonomous systems.
    • Swarm intelligence's market application extends beyond these regions, with the technology's potential impact on industries like logistics, agriculture, and energy production. The integration of swarm algorithms and edge computing is expected to drive significant advancements, making the future of this market robust and promising.

    What challenges does the Swarm Intelligence Industry face during its growth?

    • The high implementation costs and intricate system complexity pose a significant challenge to the industry's growth. In order to expand, companies must invest substantial resources in implementing advanced systems, which can be a major impediment to growth. The complexity of these systems also requires a significant investment in training and expertise, further increasing the financial burden. Consequently, overcoming these obstacles is essential for industry advancement. 

    • Swarm intelligence, an advanced form of artificial intelligence, is gaining traction in various sectors due to its ability to mimic the collective behavior of natural swarms for problem-solving and optimization. However, the global market for swarm intelligence solutions faces a significant challenge in the form of high implementation costs and complexity. This barrier to entry is particularly pertinent for small and medium-sized enterprises in North America, Europe, and the Asia Pacific region. The creation of sophisticated algorithms that accurately replicate natural swarm behaviors requires specialized expertise in fields such as artificial intelligence, robotics, and control systems.
    • According to recent estimates, the development and deployment of swarm intelligence solutions account for approximately 30% to 40% of the total implementation costs. Despite these challenges, the potential benefits of swarm intelligence, including improved efficiency and adaptability, continue to drive its adoption across industries.

    Exclusive Technavio Analysis on Customer Landscape

    The swarm intelligence market forecasting report includes the adoption lifecycle of the market, covering from the innovator’s stage to the laggard’s stage. It focuses on adoption rates in different regions based on penetration. Furthermore, the swarm intelligence market report also includes key purchase criteria and drivers of price sensitivity to help companies evaluate and develop their market growth analysis strategies.

    Swarm Intelligence Market Share by Geography

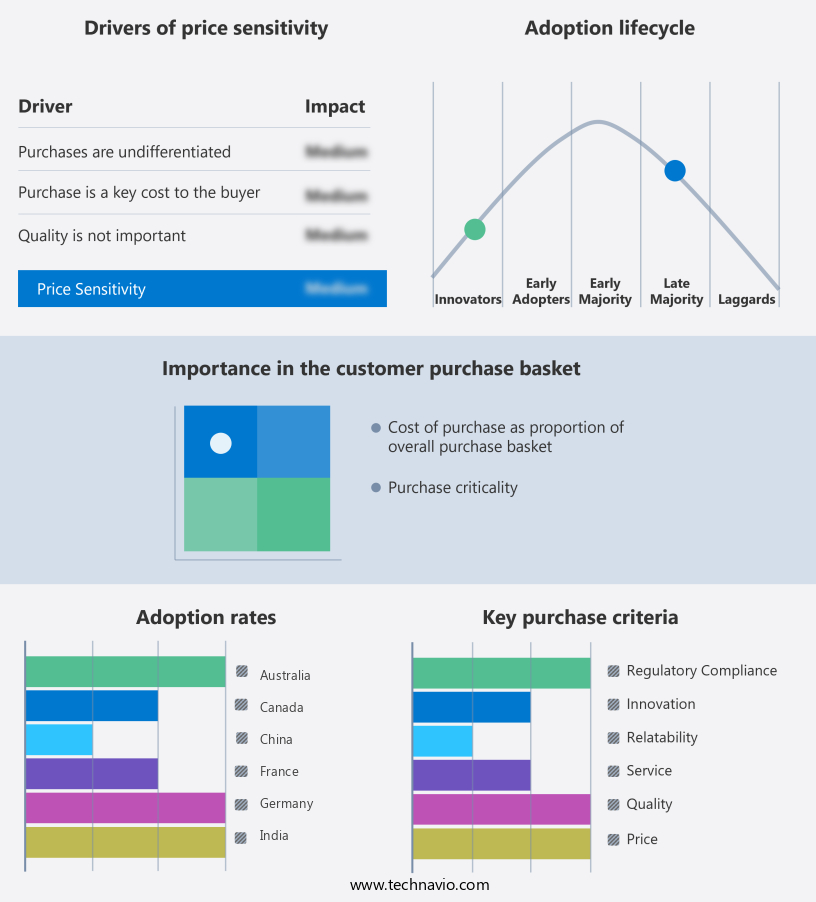
     Customer Landscape of Swarm Intelligence Industry

    Competitive Landscape

    Companies are implementing various strategies, such as strategic alliances, swarm intelligence market forecast, partnerships, mergers and acquisitions, geographical expansion, and product/service launches, to enhance their presence in the industry.

    Amazon.com Inc. - This company specializes in swarm intelligence solutions, providing advanced algorithms for optimizing logistics and automating warehouses. These innovations enhance delivery efficiency and inventory management, contributing significantly to streamlined supply chain operations.

    The industry research and growth report includes detailed analyses of the competitive landscape of the market and information about key companies, including:

    • Amazon.com Inc.
    • Atos SE
    • Baidu Inc.
    • Google LLC
    • Huawei Technologies Co. Ltd.
    • Hydromea SA
    • Intel Corp.
    • International Business Machines Corp.
    • Kim Technologies
    • Microsoft Corp.
    • NEC Corp.
    • NVIDIA Corp.
    • Oracle Corp.
    • Palantir Technologies Inc.
    • Robert Bosch GmbH
    • Samsung Electronics Co. Ltd.
    • Siemens AG
    • Unanimous A.I.

    Qualitative and quantitative analysis of companies has been conducted to help clients understand the wider business environment as well as the strengths and weaknesses of key industry players. Data is qualitatively analyzed to categorize companies as pure play, category-focused, industry-focused, and diversified; it is quantitatively analyzed to categorize companies as dominant, leading, strong, tentative, and weak.

    Recent Development and News in Swarm Intelligence Market

    • In January 2025, Intel Corporation announced the successful integration of swarm intelligence algorithms into its latest line of processors, marking a significant leap in artificial intelligence technology (Intel Press Release, 2025). This development allows for more efficient and autonomous problem-solving in various industries, including logistics and manufacturing.
    • In March 2025, IBM and Microsoft formed a strategic partnership to collaborate on swarm intelligence research and development, combining IBM's expertise in quantum computing and swarm intelligence with Microsoft's Azure cloud platform (Microsoft News Center, 2025). This collaboration aims to accelerate the adoption and application of swarm intelligence in enterprise solutions.
    • In May 2025, BP, a leading international energy company, announced a USD50 million investment in Swarm AI, a UK-based swarm intelligence startup, to develop optimized drilling and production processes using swarm intelligence technology (BP Press Release, 2025). This strategic investment underscores the potential of swarm intelligence to improve operational efficiency and reduce costs in the energy sector.
    • In August 2024, the European Union approved the Swarm Intelligence Research Initiative, a multi-year, multi-million euro project aimed at advancing swarm intelligence research and its applications across various industries (European Commission Press Release, 2024). This initiative represents a significant commitment from the EU to drive innovation and competitiveness in the market.

    Dive into Technavio’s robust research methodology, blending expert interviews, extensive data synthesis, and validated models for unparalleled Swarm Intelligence Market insights. See full methodology.

    Market Scope

    Report Coverage

    Details

    Page number

    255

    Base year

    2024

    Historic period

    2019-2023

    Forecast period

    2025-2029

    Growth momentum & CAGR

    Accelerate at a CAGR of 31.5%

    Market growth 2025-2029

    USD 285.1 million

    Market structure

    Fragmented

    YoY growth 2024-2025(%)

    26.6

    Key countries

    China, Japan, South Korea, India, Australia, Germany, UK, France, US, and Canada

    Competitive landscape

    Leading Companies, Market Positioning of Companies, Competitive Strategies, and Industry Risks

    Request Free Sample

    Research Analyst Overview

    • Amidst the rapidly advancing technological landscape, the market continues to evolve, driven by the integration of optimization algorithms, multi-agent systems, and parallel processing. This domain encompasses a diverse range of applications, from genetic algorithms and data mining to sensor networks and swarm robotics. One striking trend in swarm intelligence is the emergence of decentralized control, enabling complex adaptive systems to exhibit emergent behavior through consensus building and ant colony optimization. This approach allows for distributed systems to optimize resource allocation, path planning, and task allocation, resulting in self-organizing maps and network topologies that adapt to changing conditions. Moreover, swarm intelligence is revolutionizing industries by enhancing fault tolerance and load balancing through agent-based modeling and particle swarm optimization.
    • For instance, neural networks and artificial bee colony algorithms are being employed to optimize predictor-prey dynamics, improving overall system performance. The market's growth can be attributed to the increasing demand for distributed systems that can process vast amounts of data in real-time. In fact, it is estimated that the number of sensor nodes deployed worldwide will reach 17.4 billion by 2025, underscoring the market's potential for exponential growth. As the market matures, challenges remain, including the need for data fusion and information diffusion to ensure optimal decision-making and efficient communication between agents. However, with ongoing research and advancements in clustering algorithms, scheduling algorithms, and pattern recognition, the future of swarm intelligence is brighter than ever.

    What are the Key Data Covered in this Swarm Intelligence Market Research and Growth Report?

    • What is the expected growth of the Swarm Intelligence Market between 2025 and 2029?

      • USD 285.1 million, at a CAGR of 31.5%

    • What segmentation does the market report cover?

      • The report segmented by Method (ACO, PSO, and Others), Capacity (Optimization, Clustering, Scheduling, and Routing), Application (Robotics, Drones, and Human swarming), End-user (Transportation and logistics, Robotics and automation, Healthcare, and Retail), and Geography (North America, APAC, Europe, South America, and Middle East and Africa)

    • Which regions are analyzed in the report?

      • North America, APAC, Europe, South America, and Middle East and Africa

    • What are the key growth drivers and market challenges?

      • Increasing demand for autonomous and collaborative systems, High implementation costs and system complexity

    • Who are the major players in the Swarm Intelligence Market?

      • Key Companies Amazon.com Inc., Atos SE, Baidu Inc., Google LLC, Huawei Technologies Co. Ltd., Hydromea SA, Intel Corp., International Business Machines Corp., Kim Technologies, Microsoft Corp., NEC Corp., NVIDIA Corp., Oracle Corp., Palantir Technologies Inc., Robert Bosch GmbH, Samsung Electronics Co. Ltd., Siemens AG, and Unanimous A.I.

    Market Research Insights

    • Swarm intelligence, a subfield of artificial intelligence, emulates the collective behavior and problem-solving abilities of social insects and other animal groups. This market encompasses various techniques, including local interactions, heuristic search, graph theory, and fitness functions, to optimize complex systems. Two significant applications of swarm intelligence are network security and route optimization. In network security, swarm algorithms enhance intrusion detection systems by analyzing traffic flow and preserving diversity to minimize false positives and negatives. In contrast, route optimization in logistics and transportation industries utilizes swarm intelligence to minimize computational complexity and improve convergence rates. For instance, a company may use a swarm algorithm to optimize the delivery of goods across a vast network, reducing the total travel distance and improving overall efficiency.
    • Despite its advantages, swarm intelligence faces challenges such as scalability issues, stochastic optimization, and parameter tuning. Nevertheless, the market continues to evolve, with ongoing research in areas like autonomous systems, dynamic programming, and simulation modeling. The potential applications of swarm intelligence span various industries, from supply chain optimization to robotics control and data security.

    We can help! Our analysts can customize this swarm intelligence market research report to meet your requirements.

    Get in touch

    1 Executive Summary

    • 1.1 Market overview
      • Executive Summary - Chart on Market Overview
      • Executive Summary - Data Table on Market Overview
      • Executive Summary - Chart on Global Market Characteristics
      • Executive Summary - Chart on Market by Geography
      • Executive Summary - Chart on Market Segmentation by Method
      • Executive Summary - Chart on Market Segmentation by Capacity
      • Executive Summary - Chart on Market Segmentation by Application
      • Executive Summary - Chart on Market Segmentation by End-user
      • Executive Summary - Chart on Incremental Growth
      • Executive Summary - Data Table on Incremental Growth
      • Executive Summary - Chart on Company Market Positioning

    2 Technavio Analysis

    • 2.1 Analysis of price sensitivity, lifecycle, customer purchase basket, adoption rates, and purchase criteria
      • Analysis of price sensitivity, lifecycle, customer purchase basket, adoption rates, and purchase criteria
    • 2.2 Criticality of inputs and Factors of differentiation
      • Overview on criticality of inputs and factors of differentiation
    • 2.3 Factors of disruption
      • Overview on factors of disruption
    • 2.4 Impact of drivers and challenges
      • Impact of drivers and challenges in 2024 and 2029

    3 Market Landscape

    • 3.1 Market ecosystem
      • Parent Market
      • Data Table on - Parent Market
    • 3.2 Market characteristics
      • Market characteristics analysis
    • 3.3 Value chain analysis
      • Value chain analysis

    4 Market Sizing

    • 4.1 Market definition
      • Offerings of companies included in the market definition
    • 4.2 Market segment analysis
      • Market segments
    • 4.3 Market size 2024
      • 4.4 Market outlook: Forecast for 2024-2029
        • Chart on Global - Market size and forecast 2024-2029 ($ million)
        • Data Table on Global - Market size and forecast 2024-2029 ($ million)
        • Chart on Global Market: Year-over-year growth 2024-2029 (%)
        • Data Table on Global Market: Year-over-year growth 2024-2029 (%)

      5 Five Forces Analysis

      • 5.1 Five forces summary
        • Five forces analysis - Comparison between 2024 and 2029
      • 5.2 Bargaining power of buyers
        • Bargaining power of buyers - Impact of key factors 2024 and 2029
      • 5.3 Bargaining power of suppliers
        • Bargaining power of suppliers - Impact of key factors in 2024 and 2029
      • 5.4 Threat of new entrants
        • Threat of new entrants - Impact of key factors in 2024 and 2029
      • 5.5 Threat of substitutes
        • Threat of substitutes - Impact of key factors in 2024 and 2029
      • 5.6 Threat of rivalry
        • Threat of rivalry - Impact of key factors in 2024 and 2029
      • 5.7 Market condition
        • Chart on Market condition - Five forces 2024 and 2029

      6 Market Segmentation by Method

      • 6.1 Market segments
        • Chart on Method - Market share 2024-2029 (%)
        • Data Table on Method - Market share 2024-2029 (%)
      • 6.2 Comparison by Method
        • Chart on Comparison by Method
        • Data Table on Comparison by Method
      • 6.3 ACO - Market size and forecast 2024-2029
        • Chart on ACO - Market size and forecast 2024-2029 ($ million)
        • Data Table on ACO - Market size and forecast 2024-2029 ($ million)
        • Chart on ACO - Year-over-year growth 2024-2029 (%)
        • Data Table on ACO - Year-over-year growth 2024-2029 (%)
      • 6.4 PSO - Market size and forecast 2024-2029
        • Chart on PSO - Market size and forecast 2024-2029 ($ million)
        • Data Table on PSO - Market size and forecast 2024-2029 ($ million)
        • Chart on PSO - Year-over-year growth 2024-2029 (%)
        • Data Table on PSO - Year-over-year growth 2024-2029 (%)
      • 6.5 Others - Market size and forecast 2024-2029
        • Chart on Others - Market size and forecast 2024-2029 ($ million)
        • Data Table on Others - Market size and forecast 2024-2029 ($ million)
        • Chart on Others - Year-over-year growth 2024-2029 (%)
        • Data Table on Others - Year-over-year growth 2024-2029 (%)
      • 6.6 Market opportunity by Method
        • Market opportunity by Method ($ million)
        • Data Table on Market opportunity by Method ($ million)

      7 Market Segmentation by Capacity

      • 7.1 Market segments
        • Chart on Capacity - Market share 2024-2029 (%)
        • Data Table on Capacity - Market share 2024-2029 (%)
      • 7.2 Comparison by Capacity
        • Chart on Comparison by Capacity
        • Data Table on Comparison by Capacity
      • 7.3 Optimization - Market size and forecast 2024-2029
        • Chart on Optimization - Market size and forecast 2024-2029 ($ million)
        • Data Table on Optimization - Market size and forecast 2024-2029 ($ million)
        • Chart on Optimization - Year-over-year growth 2024-2029 (%)
        • Data Table on Optimization - Year-over-year growth 2024-2029 (%)
      • 7.4 Clustering - Market size and forecast 2024-2029
        • Chart on Clustering - Market size and forecast 2024-2029 ($ million)
        • Data Table on Clustering - Market size and forecast 2024-2029 ($ million)
        • Chart on Clustering - Year-over-year growth 2024-2029 (%)
        • Data Table on Clustering - Year-over-year growth 2024-2029 (%)
      • 7.5 Scheduling - Market size and forecast 2024-2029
        • Chart on Scheduling - Market size and forecast 2024-2029 ($ million)
        • Data Table on Scheduling - Market size and forecast 2024-2029 ($ million)
        • Chart on Scheduling - Year-over-year growth 2024-2029 (%)
        • Data Table on Scheduling - Year-over-year growth 2024-2029 (%)
      • 7.6 Routing - Market size and forecast 2024-2029
        • Chart on Routing - Market size and forecast 2024-2029 ($ million)
        • Data Table on Routing - Market size and forecast 2024-2029 ($ million)
        • Chart on Routing - Year-over-year growth 2024-2029 (%)
        • Data Table on Routing - Year-over-year growth 2024-2029 (%)
      • 7.7 Market opportunity by Capacity
        • Market opportunity by Capacity ($ million)
        • Data Table on Market opportunity by Capacity ($ million)

      8 Market Segmentation by Application

      • 8.1 Market segments
        • Chart on Application - Market share 2024-2029 (%)
        • Data Table on Application - Market share 2024-2029 (%)
      • 8.2 Comparison by Application
        • Chart on Comparison by Application
        • Data Table on Comparison by Application
      • 8.3 Robotics - Market size and forecast 2024-2029
        • Chart on Robotics - Market size and forecast 2024-2029 ($ million)
        • Data Table on Robotics - Market size and forecast 2024-2029 ($ million)
        • Chart on Robotics - Year-over-year growth 2024-2029 (%)
        • Data Table on Robotics - Year-over-year growth 2024-2029 (%)
      • 8.4 Drones - Market size and forecast 2024-2029
        • Chart on Drones - Market size and forecast 2024-2029 ($ million)
        • Data Table on Drones - Market size and forecast 2024-2029 ($ million)
        • Chart on Drones - Year-over-year growth 2024-2029 (%)
        • Data Table on Drones - Year-over-year growth 2024-2029 (%)
      • 8.5 Human swarming - Market size and forecast 2024-2029
        • Chart on Human swarming - Market size and forecast 2024-2029 ($ million)
        • Data Table on Human swarming - Market size and forecast 2024-2029 ($ million)
        • Chart on Human swarming - Year-over-year growth 2024-2029 (%)
        • Data Table on Human swarming - Year-over-year growth 2024-2029 (%)
      • 8.6 Market opportunity by Application
        • Market opportunity by Application ($ million)
        • Data Table on Market opportunity by Application ($ million)

      9 Market Segmentation by End-user

      • 9.1 Market segments
        • Chart on End-user - Market share 2024-2029 (%)
        • Data Table on End-user - Market share 2024-2029 (%)
      • 9.2 Comparison by End-user
        • Chart on Comparison by End-user
        • Data Table on Comparison by End-user
      • 9.3 Transportation and logistics - Market size and forecast 2024-2029
        • Chart on Transportation and logistics - Market size and forecast 2024-2029 ($ million)
        • Data Table on Transportation and logistics - Market size and forecast 2024-2029 ($ million)
        • Chart on Transportation and logistics - Year-over-year growth 2024-2029 (%)
        • Data Table on Transportation and logistics - Year-over-year growth 2024-2029 (%)
      • 9.4 Robotics and automation - Market size and forecast 2024-2029
        • Chart on Robotics and automation - Market size and forecast 2024-2029 ($ million)
        • Data Table on Robotics and automation - Market size and forecast 2024-2029 ($ million)
        • Chart on Robotics and automation - Year-over-year growth 2024-2029 (%)
        • Data Table on Robotics and automation - Year-over-year growth 2024-2029 (%)
      • 9.5 Healthcare - Market size and forecast 2024-2029
        • Chart on Healthcare - Market size and forecast 2024-2029 ($ million)
        • Data Table on Healthcare - Market size and forecast 2024-2029 ($ million)
        • Chart on Healthcare - Year-over-year growth 2024-2029 (%)
        • Data Table on Healthcare - Year-over-year growth 2024-2029 (%)
      • 9.6 Retail - Market size and forecast 2024-2029
        • Chart on Retail - Market size and forecast 2024-2029 ($ million)
        • Data Table on Retail - Market size and forecast 2024-2029 ($ million)
        • Chart on Retail - Year-over-year growth 2024-2029 (%)
        • Data Table on Retail - Year-over-year growth 2024-2029 (%)
      • 9.7 Market opportunity by End-user
        • Market opportunity by End-user ($ million)
        • Data Table on Market opportunity by End-user ($ million)

      10 Customer Landscape

      • 10.1 Customer landscape overview
        • Analysis of price sensitivity, lifecycle, customer purchase basket, adoption rates, and purchase criteria

      11 Geographic Landscape

      • 11.1 Geographic segmentation
        • Chart on Market share by geography 2024-2029 (%)
        • Data Table on Market share by geography 2024-2029 (%)
      • 11.2 Geographic comparison
        • Chart on Geographic comparison
        • Data Table on Geographic comparison
      • 11.3 North America - Market size and forecast 2024-2029
        • Chart on North America - Market size and forecast 2024-2029 ($ million)
        • Data Table on North America - Market size and forecast 2024-2029 ($ million)
        • Chart on North America - Year-over-year growth 2024-2029 (%)
        • Data Table on North America - Year-over-year growth 2024-2029 (%)
      • 11.4 APAC - Market size and forecast 2024-2029
        • Chart on APAC - Market size and forecast 2024-2029 ($ million)
        • Data Table on APAC - Market size and forecast 2024-2029 ($ million)
        • Chart on APAC - Year-over-year growth 2024-2029 (%)
        • Data Table on APAC - Year-over-year growth 2024-2029 (%)
      • 11.5 Europe - Market size and forecast 2024-2029
        • Chart on Europe - Market size and forecast 2024-2029 ($ million)
        • Data Table on Europe - Market size and forecast 2024-2029 ($ million)
        • Chart on Europe - Year-over-year growth 2024-2029 (%)
        • Data Table on Europe - Year-over-year growth 2024-2029 (%)
      • 11.6 South America - Market size and forecast 2024-2029
        • Chart on South America - Market size and forecast 2024-2029 ($ million)
        • Data Table on South America - Market size and forecast 2024-2029 ($ million)
        • Chart on South America - Year-over-year growth 2024-2029 (%)
        • Data Table on South America - Year-over-year growth 2024-2029 (%)
      • 11.7 Middle East and Africa - Market size and forecast 2024-2029
        • Chart on Middle East and Africa - Market size and forecast 2024-2029 ($ million)
        • Data Table on Middle East and Africa - Market size and forecast 2024-2029 ($ million)
        • Chart on Middle East and Africa - Year-over-year growth 2024-2029 (%)
        • Data Table on Middle East and Africa - Year-over-year growth 2024-2029 (%)
      • 11.8 US - Market size and forecast 2024-2029
        • Chart on US - Market size and forecast 2024-2029 ($ million)
        • Data Table on US - Market size and forecast 2024-2029 ($ million)
        • Chart on US - Year-over-year growth 2024-2029 (%)
        • Data Table on US - Year-over-year growth 2024-2029 (%)
      • 11.9 China - Market size and forecast 2024-2029
        • Chart on China - Market size and forecast 2024-2029 ($ million)
        • Data Table on China - Market size and forecast 2024-2029 ($ million)
        • Chart on China - Year-over-year growth 2024-2029 (%)
        • Data Table on China - Year-over-year growth 2024-2029 (%)
      • 11.10 Germany - Market size and forecast 2024-2029
        • Chart on Germany - Market size and forecast 2024-2029 ($ million)
        • Data Table on Germany - Market size and forecast 2024-2029 ($ million)
        • Chart on Germany - Year-over-year growth 2024-2029 (%)
        • Data Table on Germany - Year-over-year growth 2024-2029 (%)
      • 11.11 Japan - Market size and forecast 2024-2029
        • Chart on Japan - Market size and forecast 2024-2029 ($ million)
        • Data Table on Japan - Market size and forecast 2024-2029 ($ million)
        • Chart on Japan - Year-over-year growth 2024-2029 (%)
        • Data Table on Japan - Year-over-year growth 2024-2029 (%)
      • 11.12 UK - Market size and forecast 2024-2029
        • Chart on UK - Market size and forecast 2024-2029 ($ million)
        • Data Table on UK - Market size and forecast 2024-2029 ($ million)
        • Chart on UK - Year-over-year growth 2024-2029 (%)
        • Data Table on UK - Year-over-year growth 2024-2029 (%)
      • 11.13 South Korea - Market size and forecast 2024-2029
        • Chart on South Korea - Market size and forecast 2024-2029 ($ million)
        • Data Table on South Korea - Market size and forecast 2024-2029 ($ million)
        • Chart on South Korea - Year-over-year growth 2024-2029 (%)
        • Data Table on South Korea - Year-over-year growth 2024-2029 (%)
      • 11.14 India - Market size and forecast 2024-2029
        • Chart on India - Market size and forecast 2024-2029 ($ million)
        • Data Table on India - Market size and forecast 2024-2029 ($ million)
        • Chart on India - Year-over-year growth 2024-2029 (%)
        • Data Table on India - Year-over-year growth 2024-2029 (%)
      • 11.15 France - Market size and forecast 2024-2029
        • Chart on France - Market size and forecast 2024-2029 ($ million)
        • Data Table on France - Market size and forecast 2024-2029 ($ million)
        • Chart on France - Year-over-year growth 2024-2029 (%)
        • Data Table on France - Year-over-year growth 2024-2029 (%)
      • 11.16 Canada - Market size and forecast 2024-2029
        • Chart on Canada - Market size and forecast 2024-2029 ($ million)
        • Data Table on Canada - Market size and forecast 2024-2029 ($ million)
        • Chart on Canada - Year-over-year growth 2024-2029 (%)
        • Data Table on Canada - Year-over-year growth 2024-2029 (%)
      • 11.17 Australia - Market size and forecast 2024-2029
        • Chart on Australia - Market size and forecast 2024-2029 ($ million)
        • Data Table on Australia - Market size and forecast 2024-2029 ($ million)
        • Chart on Australia - Year-over-year growth 2024-2029 (%)
        • Data Table on Australia - Year-over-year growth 2024-2029 (%)
      • 11.18 Market opportunity by geography
        • Market opportunity by geography ($ million)
        • Data Tables on Market opportunity by geography ($ million)

      12 Drivers, Challenges, and Opportunity/Restraints

      • 12.1 Market drivers
        • 12.2 Market challenges
          • 12.3 Impact of drivers and challenges
            • Impact of drivers and challenges in 2024 and 2029
          • 12.4 Market opportunities/restraints

            13 Competitive Landscape

            • 13.1 Overview
              • 13.2 Competitive Landscape
                • Overview on criticality of inputs and factors of differentiation
              • 13.3 Landscape disruption
                • Overview on factors of disruption
              • 13.4 Industry risks
                • Impact of key risks on business

              14 Competitive Analysis

              • 14.1 Companies profiled
                • Companies covered
              • 14.2 Company ranking index
                • Company ranking index
              • 14.3 Market positioning of companies
                • Matrix on companies position and classification
              • 14.4 Amazon.com Inc.
                • Amazon.com Inc. - Overview
                • Amazon.com Inc. - Business segments
                • Amazon.com Inc. - Key news
                • Amazon.com Inc. - Key offerings
                • Amazon.com Inc. - Segment focus
                • SWOT
              • 14.5 Atos SE
                • Atos SE - Overview
                • Atos SE - Business segments
                • Atos SE - Key news
                • Atos SE - Key offerings
                • Atos SE - Segment focus
                • SWOT
              • 14.6 Baidu Inc.
                • Baidu Inc. - Overview
                • Baidu Inc. - Business segments
                • Baidu Inc. - Key offerings
                • Baidu Inc. - Segment focus
                • SWOT
              • 14.7 Google LLC
                • Google LLC - Overview
                • Google LLC - Product / Service
                • Google LLC - Key offerings
                • SWOT
              • 14.8 Huawei Technologies Co. Ltd.
                • Huawei Technologies Co. Ltd. - Overview
                • Huawei Technologies Co. Ltd. - Product / Service
                • Huawei Technologies Co. Ltd. - Key news
                • Huawei Technologies Co. Ltd. - Key offerings
                • SWOT
              • 14.9 Hydromea SA
                • Hydromea SA - Overview
                • Hydromea SA - Product / Service
                • Hydromea SA - Key offerings
                • SWOT
              • 14.10 Intel Corp.
                • Intel Corp. - Overview
                • Intel Corp. - Business segments
                • Intel Corp. - Key news
                • Intel Corp. - Key offerings
                • Intel Corp. - Segment focus
                • SWOT
              • 14.11 International Business Machines Corp.
                • International Business Machines Corp. - Overview
                • International Business Machines Corp. - Business segments
                • International Business Machines Corp. - Key news
                • International Business Machines Corp. - Key offerings
                • International Business Machines Corp. - Segment focus
                • SWOT
              • 14.12 Kim Technologies
                • Kim Technologies - Overview
                • Kim Technologies - Product / Service
                • Kim Technologies - Key offerings
                • SWOT
              • 14.13 Microsoft Corp.
                • Microsoft Corp. - Overview
                • Microsoft Corp. - Business segments
                • Microsoft Corp. - Key news
                • Microsoft Corp. - Key offerings
                • Microsoft Corp. - Segment focus
                • SWOT
              • 14.14 NEC Corp.
                • NEC Corp. - Overview
                • NEC Corp. - Business segments
                • NEC Corp. - Key news
                • NEC Corp. - Key offerings
                • NEC Corp. - Segment focus
                • SWOT
              • 14.15 NVIDIA Corp.
                • NVIDIA Corp. - Overview
                • NVIDIA Corp. - Business segments
                • NVIDIA Corp. - Key news
                • NVIDIA Corp. - Key offerings
                • NVIDIA Corp. - Segment focus
                • SWOT
              • 14.16 Oracle Corp.
                • Oracle Corp. - Overview
                • Oracle Corp. - Business segments
                • Oracle Corp. - Key news
                • Oracle Corp. - Key offerings
                • Oracle Corp. - Segment focus
                • SWOT
              • 14.17 Palantir Technologies Inc.
                • Palantir Technologies Inc. - Overview
                • Palantir Technologies Inc. - Product / Service
                • Palantir Technologies Inc. - Key offerings
                • SWOT
              • 14.18 Robert Bosch GmbH
                • Robert Bosch GmbH - Overview
                • Robert Bosch GmbH - Product / Service
                • Robert Bosch GmbH - Key news
                • Robert Bosch GmbH - Key offerings
                • SWOT

              15 Appendix

              • 15.1 Scope of the report
                • 15.2 Inclusions and exclusions checklist
                  • Inclusions checklist
                  • Exclusions checklist
                • 15.3 Currency conversion rates for US$
                  • Currency conversion rates for US$
                • 15.4 Research methodology
                  • Research methodology
                • 15.5 Data procurement
                  • Information sources
                • 15.6 Data validation
                  • Data validation
                • 15.7 Validation techniques employed for market sizing
                  • Validation techniques employed for market sizing
                • 15.8 Data synthesis
                  • Data synthesis
                • 15.9 360 degree market analysis
                  • 360 degree market analysis
                • 15.10 List of abbreviations
                  • List of abbreviations

                Research Methodology

                Technavio presents a detailed picture of the market by way of study, synthesis, and summation of data from multiple sources. The analysts have presented the various facets of the market with a particular focus on identifying the key industry influencers. The data thus presented is comprehensive, reliable, and the result of extensive research, both primary and secondary.

                INFORMATION SOURCES

                Primary sources

                • Manufacturers and suppliers
                • Channel partners
                • Industry experts
                • Strategic decision makers

                Secondary sources

                • Industry journals and periodicals
                • Government data
                • Financial reports of key industry players
                • Historical data
                • Press releases

                DATA ANALYSIS

                Data Synthesis

                • Collation of data
                • Estimation of key figures
                • Analysis of derived insights

                Data Validation

                • Triangulation with data models
                • Reference against proprietary databases
                • Corroboration with industry experts

                REPORT WRITING

                Qualitative

                • Market drivers
                • Market challenges
                • Market trends
                • Five forces analysis

                Quantitative

                • Market size and forecast
                • Market segmentation
                • Geographical insights
                • Competitive landscape

                Interested in this report?

                Get your sample now to see our research methodology and insights!

                Download Now

                Frequently Asked Questions

                Swarm Intelligence market growth will increase by $ 285.1 mn during 2025-2029.

                The Swarm Intelligence market is expected to grow at a CAGR of 31.5% during 2025-2029.

                Swarm Intelligence market is segmented by Method( ACO, PSO, Others) Capacity( Optimization, Clustering, Scheduling, Routing) Application( Robotics, Drones, Human swarming)

                Amazon.com Inc., Atos SE, Baidu Inc., Google LLC, Huawei Technologies Co. Ltd., Hydromea SA, Intel Corp., International Business Machines Corp., Kim Technologies, Microsoft Corp., NEC Corp., NVIDIA Corp., Oracle Corp., Palantir Technologies Inc., Robert Bosch GmbH, Samsung Electronics Co. Ltd., Siemens AG, Unanimous A.I. are a few of the key vendors in the Swarm Intelligence market.

                North America will register the highest growth rate of 40% among the other regions. Therefore, the Swarm Intelligence market in North America is expected to garner significant business opportunities for the vendors during the forecast period.

                China, Japan, South Korea, India, Australia, Germany, UK, France, US, Canada

                • Increasing demand for autonomous and collaborative systemsThe escalating demand for autonomous and collaborative systems across a multitude of industries serves as a primary driver for the global swarm intelligence market. This demand is particularly prominent in North America and Europe is the driving factor this market.
                • where there is a strong emphasis on technological innovation and automation to enhance efficiency is the driving factor this market.
                • productivity is the driving factor this market.
                • and safety. Swarm intelligence is the driving factor this market.
                • with its inherent principles of decentralization is the driving factor this market.
                • self-organization is the driving factor this market.
                • and emergent behavior is the driving factor this market.
                • provides an ideal framework for the coordination of large numbers of autonomous agents is the driving factor this market.
                • such as robots and drones is the driving factor this market.
                • to achieve collective goals that would be impossible for a single entity. In the realm of logistics and warehouse management is the driving factor this market.
                • for instance is the driving factor this market.
                • there is a growing trend towards the use of autonomous mobile robots to handle tasks like inventory management is the driving factor this market.
                • order fulfillment is the driving factor this market.
                • and material transport. Swarm intelligence enables these fleets of robots to operate in a coordinated and adaptive manner is the driving factor this market.
                • optimizing workflows and responding dynamically to changing demands without the need for a central controller. This is crucial in the fast-paced world of e-commerce is the driving factor this market.
                • where efficiency and scalability are paramount. In North America is the driving factor this market.
                • the adoption of such systems is driven by the need to streamline supply chains and reduce operational costs. Major players in the retail and logistics sectors are increasingly investing in robotics and automation technologies that leverage swarm principles. In Europe is the driving factor this market.
                • the emphasis is not only on efficiency but also on creating more flexible and resilient manufacturing and logistics operations. A notable instance of this is the EU-funded SmartEdge project is the driving factor this market.
                • which in September 2024 is the driving factor this market.
                • showcased its use of swarm intelligence for autonomous mobile robots in smart factories is the driving factor this market.
                • enabling more flexible local production and a wider range of products. Furthermore is the driving factor this market.
                • the military and defense sectors in both North America and Europe are significant adopters of swarm intelligence. The development of autonomous drone swarms for applications such as surveillance is the driving factor this market.
                • reconnaissance is the driving factor this market.
                • and even coordinated defense is a major area of research and investment. These swarms can cover large areas is the driving factor this market.
                • share information in real-time is the driving factor this market.
                • and adapt to dynamic battlefield conditions is the driving factor this market.
                • providing a significant strategic advantage. In Europe is the driving factor this market.
                • initiatives under the Horizon Europe program are fostering research and innovation in AI and robotics is the driving factor this market.
                • including swarm systems is the driving factor this market.
                • to bolster the region technological sovereignty and security capabilities. The expansion of autonomous systems is not limited to industrial and military applications. In agriculture is the driving factor this market.
                • swarms of small is the driving factor this market.
                • autonomous robots are being developed for precision farming tasks is the driving factor this market.
                • leading to more sustainable and efficient food production. In the energy sector is the driving factor this market.
                • swarm intelligence can be used to optimize the operation of smart grids and manage distributed energy resources. The OASEES project is the driving factor this market.
                • a Horizon Europe initiative is the driving factor this market.
                • is exploring the use of swarm intelligence for optimizing electric vehicle fleet charging and grid load distribution is the driving factor this market.
                • with activities running from January 2023 to December 2025. The overarching trend is a move away from large is the driving factor this market.
                • monolithic systems towards more distributed is the driving factor this market.
                • intelligent is the driving factor this market.
                • and collaborative networks of autonomous agents is the driving factor this market.
                • and swarm intelligence is the key enabling technology for this paradigm shift. is the driving factor this market.

                The Swarm Intelligence market vendors should focus on grabbing business opportunities from the ACO segment as it accounted for the largest market share in the base year.
                RIA - Research AI Assistant
                Ask RIA