
Tabletop Games Market Size 2025-2029
The tabletop games market size is forecast to increase by USD 4.76 billion at a CAGR of 12.3% between 2024 and 2029.
- The market is experiencing significant growth, driven by the increasing popularity of tabletop game cafes and the integration of digital elements into traditional games. The number of tabletop game cafes has been on the rise, providing a social and interactive space for players to enjoy their favorite games. This trend is expected to continue, as these cafes offer unique experiences that cannot be replicated through digital platforms. Another key driver in the market is the integration of digital elements into tabletop games. This trend is gaining traction, as companies seek to enhance the gaming experience by adding digital features such as virtual components, augmented reality, and online connectivity.
- This not only makes the games more engaging but also opens up new opportunities for collaboration and competition among players. However, the market also faces challenges, with the increasing threat from alternate gaming platforms being a significant concern. The console and PC games, as well as mobile games, are increasingly competing for the attention of potential customers. To remain competitive, tabletop game companies must find ways to differentiate their offerings and provide unique experiences that cannot be replicated through digital platforms. For instance, they could focus on creating immersive and social gaming experiences that cater to the growing demand for face-to-face interaction and community building.
- In conclusion, the market is experiencing robust growth, driven by the rise of tabletop game cafes and the integration of digital elements into traditional games. However, companies must also contend with the increasing threat from alternate gaming platforms and find ways to differentiate their offerings to remain competitive. By focusing on creating unique and immersive gaming experiences, tabletop game companies can capitalize on market opportunities and navigate challenges effectively.
What will be the Size of the Tabletop Games Market during the forecast period?

- The market continues to evolve, with various sectors experiencing dynamic shifts. STEM education integrates tabletop games into classrooms, fostering critical thinking and problem-solving skills among students. Retail distribution channels expand, with online retailers gaining traction against brick-and-mortar stores. Game ratings influence consumer choices, with science fiction and mystery games garnering high ratings. Mobile gaming and hardcore gamers push the boundaries of competitive gaming, while virtual tabletop platforms offer immersive experiences. Deductive reasoning and narrative games engage players, and graphic design elevates the visual appeal. Gaming trends favor cooperative games, themed events, and inclusive gaming.
- Game development sees an influx of indie game developers, and game mechanics evolve to cater to diverse demographics. Game balance and strategy remain crucial for strategy gamers, while puzzle games stimulate critical thinking. Fan communities thrive on game analysis, feedback loops, and fan art. Role-playing games offer character development and social interaction, while game engines drive innovation in game design. Board games, card games, and historical games retain their popularity, catering to family gamers and casual gamers alike. Escape rooms, game nights, and gaming lounges provide opportunities for social interaction. Sound design, music composition, and spatial awareness add depth to the gaming experience.
- Horror games and game publishing cater to niche audiences, while game accessibility ensures inclusivity. Overall, the market is a dynamic and ever-evolving landscape, with continuous innovation and applications across various sectors.
How is this Tabletop Games Industry segmented?
The tabletop games industry research report provides comprehensive data (region-wise segment analysis), with forecasts and estimates in "USD million" for the period 2025-2029, as well as historical data from 2019-2023 for the following segments.
- Type
- Monopoly
- Scrabble
- Chess
- Ludo
- Others
- Distribution Channel
- Offline
- Online
- Player Age
- Children
- Teens
- Adults
- Play Format
- Competitive
- Cooperative
- Solo
- Geography
- North America
- US
- Mexico
- Europe
- France
- Germany
- Italy
- Norway
- UK
- Middle East and Africa
- UAE
- APAC
- Australia
- China
- India
- Japan
- South Korea
- South America
- Brazil
- Rest of World (ROW)
- North America
By Type Insights
The monopoly segment is estimated to witness significant growth during the forecast period.
Tabletop games, including board games, card games, and role-playing games, continue to captivate audiences with their immersive experiences and social interaction. Stem education integrates tabletop games into classrooms, fostering critical thinking, problem-solving, and learning through game mechanics. Retail distribution expands accessibility to these games, allowing various editions and themes to reach diverse demographics. Science fiction and mystery games engage players with narrative-driven storytelling, while fantasy games transport audiences to imaginative worlds. Deductive reasoning and puzzle games challenge players to use their cognitive abilities. Graphic design and music composition enhance the gaming experience, adding depth and aesthetics.
Competitive gaming and strategy games cater to hardcore gamers, while cooperative games promote teamwork and inclusivity. Virtual tabletop platforms offer immersive experiences, enabling players to connect and game online. Geek culture and themed events celebrate the community and foster a sense of belonging. Family gamers enjoy party games and board game cafes, while historical games provide educational value. Game design and game publishing allow for innovation and creativity. Miniature games and live action role-playing offer unique and engaging experiences. Game balance, spatial awareness, and character development are essential elements in game mechanics. Game analysis and feedback loops help improve game design and player experience.
Game components, such as game pieces and game engines, contribute to the overall quality of the game. Escape rooms and educational games provide interactive and engaging learning experiences. Role-playing enthusiasts and collectible card games offer opportunities for character development and strategic gameplay. Inclusive gaming and game accessibility ensure that everyone can enjoy the tabletop gaming experience.
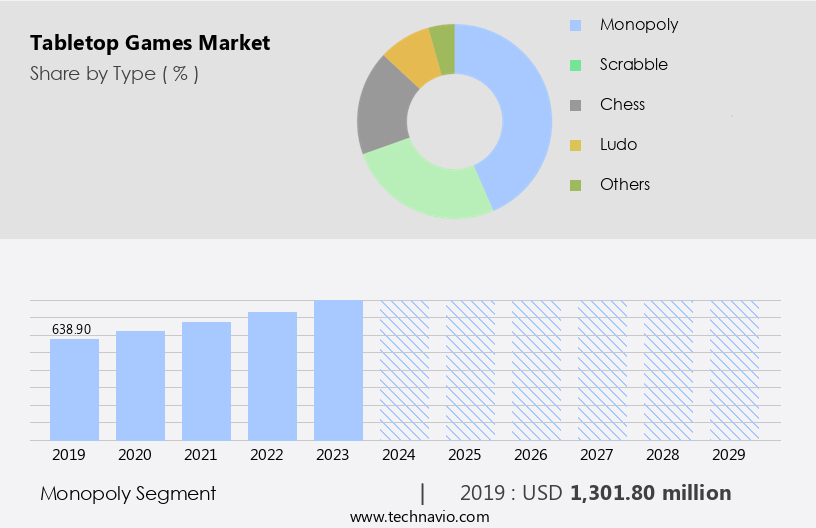
The Monopoly segment was valued at USD 1.3 billion in 2019 and showed a gradual increase during the forecast period.
Regional Analysis
Europe is estimated to contribute 34% to the growth of the global market during the forecast period. Technavio's analysts have elaborately explained the regional trends and drivers that shape the market during the forecast period.
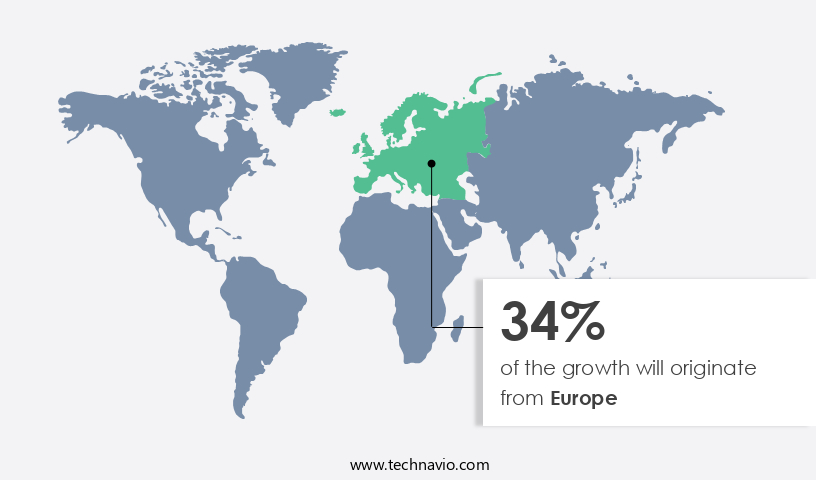
Europe's tabletop gaming market is a vibrant and diverse industry, marked by a strong community of gamers and publishers. Major gaming conventions, such as Essen Spiel in Germany and the UK Games Expo, serve as platforms for showcasing new games and fostering social interaction among gamers. The continent's urban landscapes have seen an increase in game cafes and dedicated gaming spaces, offering a welcoming environment for enthusiasts to gather and engage in tabletop gaming. The European gaming community encompasses a wide range of players, from casual gamers to dedicated hobbyists. This diversity is mirrored in the variety of tabletop games available, including science fiction, mystery, and fantasy games, as well as competitive and cooperative games.
Narrative-driven games, puzzle games, and educational games are also popular, reflecting the educational and social benefits of tabletop gaming. Game design plays a crucial role in the industry, with graphic design, sound design, and music composition contributing to immersive experiences. Role-playing games, card games, board games, historical games, and miniature games are all part of the rich tapestry of tabletop gaming in Europe. Indie game development and game publishing have gained significant traction, with many innovative games emerging from this sector. Tabletop gaming trends include virtual tabletop platforms, game mechanics that emphasize spatial awareness and critical thinking, and the incorporation of technology to enhance the gaming experience.
Gaming communities and local game stores provide opportunities for gamers to connect, share feedback, and learn from one another. The industry continues to evolve, with themed events, game analysis, and inclusive gaming initiatives contributing to its growth and appeal.
Market Dynamics
Our researchers analyzed the data with 2024 as the base year, along with the key drivers, trends, and challenges. A holistic analysis of drivers will help companies refine their marketing strategies to gain a competitive advantage.
What are the key market drivers leading to the rise in the adoption of Tabletop Games Industry?
- The surge in the number of tabletop game cafes is the primary catalyst fueling market growth in this sector.
- The market has experienced significant growth due to several factors. One of the key drivers is the rise in popularity of tabletop games among millennials. This demographic has shown a growing interest in these games, leading to an increase in the number of board game cafes worldwide. Located in countries such as the UK and the US, these establishments offer a diverse collection of games, including classics like Scrabble and Monopoly, as well as science fiction and mystery games. They also provide an on-site selection of food and drinks, attracting a wide audience. Hardcore gamers frequent these cafes for competitive gaming sessions, while parents and young adults use them for quality family time and socializing.
- Retail distribution channels, including online retailers, have also contributed to the market's growth. Game ratings, graphic design, narrative games, deductive reasoning, game theory, and virtual tabletop are some gaming trends that have influenced the market dynamics. Game components are another essential aspect, ensuring an immersive and harmonious gaming experience for players.
What are the market trends shaping the Tabletop Games Industry?
- The rising trend in tabletop gaming involves increased digital integration. This development is mandated by the current market, which prioritizes advanced technology and innovation.
- Tabletop games continue to captivate audiences by providing immersive experiences that blend traditional gameplay with digital integration. This trend caters to diverse gaming demographics, including geek culture, family gamers, and strategy enthusiasts. Digital enhancements, such as sound design, game design innovations, and cooperative gameplay, broaden the appeal of tabletop games to both board game aficionados and digital gaming platform users. Companion apps offer interactive features, dynamic storytelling, and augmented reality elements, adding strategic depth and engaging narratives. Companies, like Embracer Group AB and Hasbro, have embraced this trend, publishing digital adaptations of classic board games and introducing new titles that leverage both physical and digital components.
- Game balance and community engagement remain crucial elements of tabletop gaming, ensuring harmonious gameplay experiences for all players. Digital integration not only preserves the tactile aspects of tabletop games but also enhances them, providing a harmonious blend of old and new.
What challenges does the Tabletop Games Industry face during its growth?
- The escalating competition from alternative gaming platforms poses a significant challenge to the industry's growth trajectory.
- The market faces increasing competition from the digital gaming industry, which offers convenience, accessibility, and immersive environments. Popular mobile games, such as Pokemon GO and PlayerUnknown's Battlegrounds, have gained significant traction in recent years. These games are typically free to download, with revenue generated through in-game advertisements and the sale of virtual items. Traditional gaming publishers for console and PC platforms also offer a wide selection of games at competitive prices. Despite this competition, tabletop games continue to provide unique value through spatial awareness, social interaction, and tactile gameplay. Miniature games, strategy games, dice games, and family games offer diverse game mechanics that cater to various preferences.
- Themed events, game nights, and gaming lounges provide opportunities for fans to engage in inclusive gaming experiences. Music composition and game development communities further enrich the tabletop gaming landscape. Game analysis and fan conventions offer valuable insights into game trends and innovations. Tabletop games provide a harmonious balance of strategy, creativity, and social connection that cannot be replicated in digital gaming experiences. As the market continues to evolve, it remains a dynamic and engaging industry that appeals to a diverse audience.
Exclusive Customer Landscape
The tabletop games market forecasting report includes the adoption lifecycle of the market, covering from the innovator's stage to the laggard's stage. It focuses on adoption rates in different regions based on penetration. Furthermore, the tabletop games market report also includes key purchase criteria and drivers of price sensitivity to help companies evaluate and develop their market growth analysis strategies.
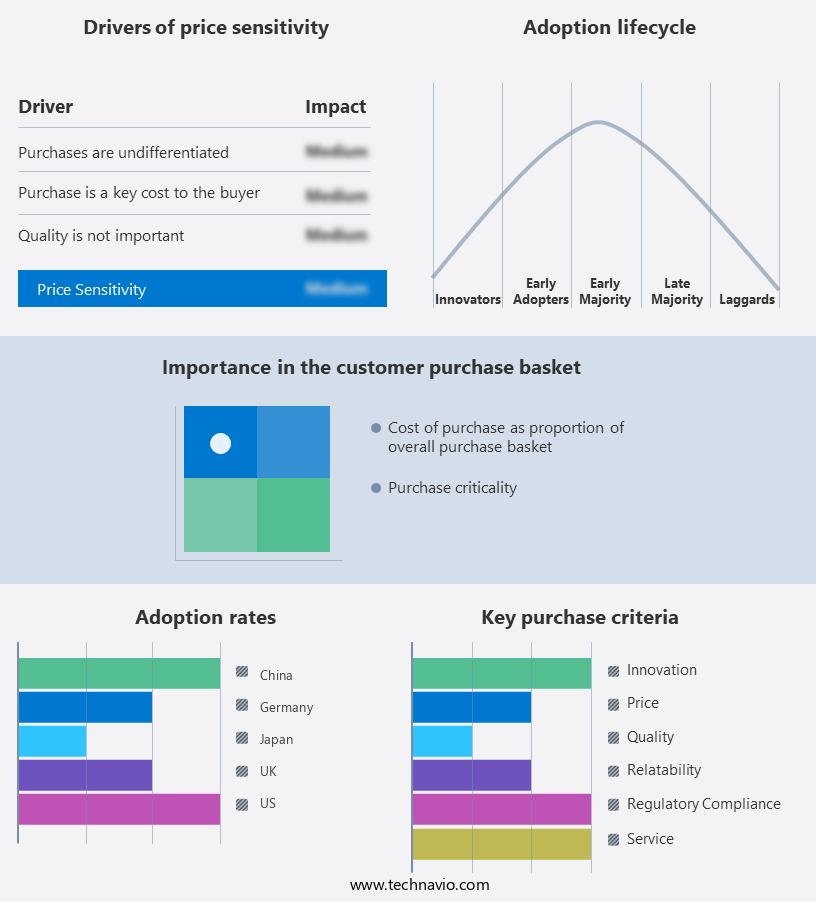
Customer Landscape
Key Companies & Market Insights
Companies are implementing various strategies, such as strategic alliances, tabletop games market forecast, partnerships, mergers and acquisitions, geographical expansion, and product/service launches, to enhance their presence in the industry.
Asmodee Group - This company specializes in providing a selection of table top games, including 7 Wonders: Sages Age cards and America in Flames.
The industry research and growth report includes detailed analyses of the competitive landscape of the market and information about key companies, including:
- Asmodee Group
- Avalon Hill (Hasbro)
- Bandai Namco Entertainment Inc.
- Buffalo Games Inc.
- Catan Studio
- Cephalofair Games
- CMON Limited
- Days of Wonder (Asmodee)
- Fantasy Flight Games (Asmodee)
- Funko Games
- Games Workshop Group PLC
- Hasbro Inc.
- Mattel Inc.
- Plaid Hat Games
- Queen Games
- Ravensburger AG
- Rio Grande Games
- The Pokémon Company
- Wizards of the Coast (Hasbro)
- Z-Man Games (Asmodee)
Qualitative and quantitative analysis of companies has been conducted to help clients understand the wider business environment as well as the strengths and weaknesses of key industry players. Data is qualitatively analyzed to categorize companies as pure play, category-focused, industry-focused, and diversified; it is quantitatively analyzed to categorize companies as dominant, leading, strong, tentative, and weak.
Recent Development and News in Tabletop Games Market
- In February 2024, the market witnessed a significant product launch with the introduction of "Tales from the Loop: The Board Game," a collaboration between Lucky Dice and Fria Ligan (FriaLigan.Com). This cooperative strategy game, based on the popular science fiction setting, generated substantial buzz within the community and sold out within weeks of its release.
- In May 2025, a major strategic partnership was announced between Asmodee and Fantasy Flight Games, two leading players in the tabletop games industry (Asmodee.Com & FFG.Com). This partnership aimed to expand their combined offerings and strengthen their position in the market. The financial terms of the agreement were not disclosed.
- In October 2024, a significant technological advancement was demonstrated at the annual Gen Con convention with the release of "Augmented Reality Tabletop Games" by Tabletopia and Microsoft (Tabletopia.Com & Microsoft.Com). This new platform combined digital components with physical tabletop games, allowing players to enhance their gaming experience with advanced visuals and interactive elements.
Research Analyst Overview
The market continues to evolve, with digital distribution and game streaming platforms reshaping traditional sales channels. Virtual reality gaming and augmented reality experiences add a new dimension to game theme and art, while wearable gaming devices offer immersive experiences. Game marketing strategies incorporate social media and influencer partnerships, driving community building and content creation. Expansion packs and campaign games cater to players seeking deeper game complexity, while modular board games offer variable setup and customization. Game design software and gaming software enable creators to develop their own content, fueling a culture of innovation. Blockchain gaming and non-fungible tokens introduce new monetization models, allowing collectable miniatures and other game assets to hold value beyond the table.
Multiplayer games and gaming subscriptions foster social connections, attracting solo gamers and those seeking consistent competition. Game legacy and gaming events celebrate the history of tabletop gaming, providing opportunities for players to connect and learn from industry experts. Online gaming platforms and game development tools facilitate collaboration and accessibility, making tabletop gaming more inclusive and accessible than ever before.
Dive into Technavio's robust research methodology, blending expert interviews, extensive data synthesis, and validated models for unparalleled Tabletop Games Market insights. See full methodology.
|
Market Scope |
|
|
Report Coverage |
Details |
|
Page number |
201 |
|
Base year |
2024 |
|
Historic period |
2019-2023 |
|
Forecast period |
2025-2029 |
|
Growth momentum & CAGR |
Accelerate at a CAGR of 12.3% |
|
Market growth 2025-2029 |
USD 4761.4 million |
|
Market structure |
Fragmented |
|
YoY growth 2024-2025(%) |
10.1 |
|
Key countries |
US, China, Germany, Japan, UK, Australia, India, France, Brazil, UAE, Rest of World (ROW), Saudi Arabia, France, South Korea, Mexico, Italy, and Norway |
|
Competitive landscape |
Leading Companies, Market Positioning of Companies, Competitive Strategies, and Industry Risks |
What are the Key Data Covered in this Tabletop Games Market Research and Growth Report?
- CAGR of the Tabletop Games industry during the forecast period
- Detailed information on factors that will drive the growth and forecasting between 2025 and 2029
- Precise estimation of the size of the market and its contribution of the industry in focus to the parent market
- Accurate predictions about upcoming growth and trends and changes in consumer behaviour
- Growth of the market across Europe, North America, APAC, South America, and Middle East and Africa
- Thorough analysis of the market's competitive landscape and detailed information about companies
- Comprehensive analysis of factors that will challenge the tabletop games market growth of industry companies
We can help! Our analysts can customize this tabletop games market research report to meet your requirements.
 RIA -
RIA - 
