
Teff Market Size 2024-2028
The teff market size is forecast to increase by USD 2.22 billion at a CAGR of 16.38% between 2023 and 2028.
- The market is experiencing significant growth due to several key factors. One trend driving market expansion is the increasing awareness of the nutritional benefits of teff. This ancient grain is rich in protein, dietary fiber, and essential minerals, making it an attractive option for health-conscious consumers. Online trends are also contributing to market growth, as consumers turn to e-commerce to purchase teff and related products.
- Additionally, fluctuations In the price of teff can impact market dynamics, presenting both opportunities and challenges for industry participants. Producers and suppliers must stay abreast of these trends and adapt to changing market conditions to remain competitive. Overall, the market is poised for continued growth in the coming years.
What will be the Size of the Teff Market During the Forecast Period?

- The market encompasses the production, processing, and distribution of teff, a small, ancient grain native to Ethiopia. Known for its ivory and reddish brown colors, teff is a key ingredient in Ethiopian cuisine, notably used to make injera bread. In recent years, the market has experienced significant growth due to increasing health consciousness and dietary trends.
- Teff is a gluten-free whole grain, rich in fiber, essential amino acids, minerals such as calcium and iron, and various nutrients. These health benefits have led to the development of teff-based products, including flour, muffins, chocolates, waffles, porridge, and more. The market is driven by the growing demand for healthier, gluten-free alternatives and the expanding popularity of teff in various culinary applications. Key insights suggest that the market will continue to grow, fueled by increasing consumer awareness of teff's nutritional benefits and its versatility in various food products.
How is this Teff Industry segmented and which is the largest segment?
The teff industry research report provides comprehensive data (region-wise segment analysis), with forecasts and estimates in "USD billion" for the period 2024-2028, as well as historical data from 2018-2022 for the following segments.
- Product
- Conventional teff
- Organic teff
- Geography
- Europe
- Germany
- UK
- France
- North America
- US
- APAC
- South America
- Middle East and Africa
- Europe
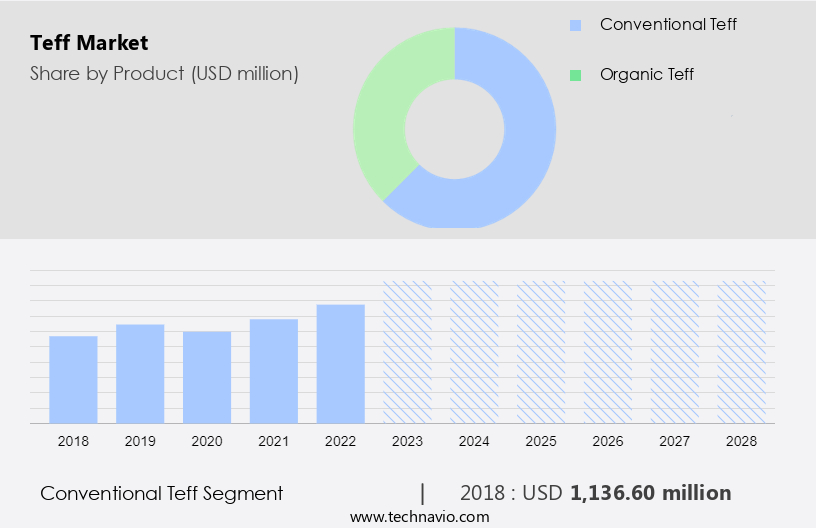
By Product Insights
The conventional teff segment is estimated to witness significant growth during the forecast period. Teff is a small, gluten-free grain seed gaining popularity for its numerous health benefits. This conventional grain, used in various food products, contributes to boosting immunity, enhancing digestion, and promoting cardiovascular health. Its nutritional profile also aids in balancing hormones and aiding in weight loss. Teff is available as seeds and flour, with the latter being suitable for individuals with celiac disease. The versatile flour can be used in cooking and baking, expanding culinary applications to include bread, flatbreads, and baked goods such as muffins, chocolates, waffles, and porridge.
The market is anticipated to grow due to increasing consumer awareness and dietary preferences. Furthermore, Teff's nutrient-rich profile, including high fiber content, essential amino acids, and minerals like calcium and iron, adds to its appeal. Culinary uses span from Ethiopian cuisine to pizza crust mixes and home baking In the food service industry.
Get a glance at the share of various segments. Request Free Sample
The conventional teff segment was valued at USD 1.14 billion in 2018 and showed a gradual increase during the forecast period.
Regional Analysis
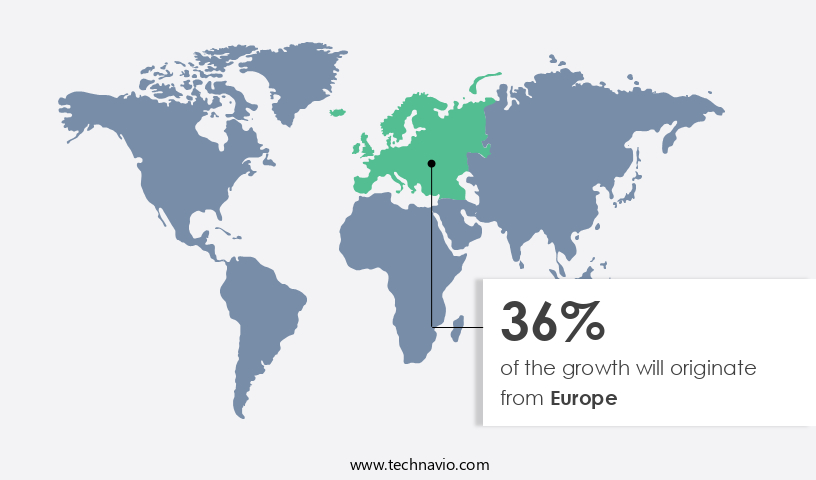
Europe is estimated to contribute 36% to the growth of the global market during the forecast period. Technavio's analysts have elaborately explained the regional trends and drivers that shape the market during the forecast period.
For more insights on the market share of various regions, Request Free Sample
Teff, a staple food in Ethiopian cuisine, is gaining popularity in Europe due to its nutritional benefits and the rising trend of health-conscious eating. This grain, available in varieties such as Millet Teff, Ivory Teff, and Reddish Brown Teff, is gluten-free and rich in fiber, essential amino acids, and minerals like calcium and iron. Its whole grain and flour forms are widely used in baked goods, breakfast dishes like porridge, and culinary applications in various global cuisines, including Ethiopian food. The demand for teff is driven by the increasing preference for gluten-free products among European consumers. The market for Teff, including production units, is expected to grow as this super grain offers a healthier alternative to traditional grains.
Key insights reveal that teff is used in making pizza crust mixes, bread, muffins, chocolates, waffles, and other sweets. Online shopping platforms and home baking have made Teff easily accessible to consumers, catering to diverse dietary preferences In the food service industry.
Market Dynamics
Our researchers analyzed the data with 2023 as the base year, along with the key drivers, trends, and challenges. A holistic analysis of drivers will help companies refine their marketing strategies to gain a competitive advantage.
What are the key market drivers leading to the rise In the adoption of Teff Industry?
Growing awareness of the benefits of teff is the key driver of the market.
- Teff is a nutrient-dense superseed that offers numerous health benefits. This tiny, ivory or reddish brown grain is a staple in Ethiopian cuisine and is gaining popularity In the US due to its impressive nutritional profile. Whole grain Teff is a gluten-free alternative and is rich in essential amino acids, fiber, and various vitamins and minerals. Some key minerals found in Teff include calcium, iron, and phosphorus. Teff contains approximately 7 grams (0.25 ounces) of proteins per two ounces. Its high fiber content aids in digestion and helps control blood sugar levels, making it an ideal food for individuals with gluten sensitivity or diabetes.
- The iron present in Teff enhances oxygenation to vital body parts, thereby improving circulation. The culinary applications of Teff are vast, ranging from baked goods like bread, muffins, and chocolates to breakfast dishes like porridge and waffles. Teff's mild, nutty flavor makes it an excellent addition to various global cuisines. In the US, Teff is used to make pizza crust mix and is gaining popularity In the food service industry. Key Insights: Teff is a versatile, whole grain that offers numerous health benefits. Its high nutritional value and gluten-free nature make it an attractive option for those with dietary preferences.
What are the market trends shaping the Teff Industry?
Online trends is the upcoming market trend.
- The market, a significant segment of the millet family, encompasses Ivory teff and Reddish brown teff, both whole grain and gluten-free products. Whole Grain Teff and Teff Flour are essential components, catering to health and nutrition needs, particularly for those with gluten sensitivity. Teff's high fiber content, essential amino acids, and rich minerals like calcium and iron make it a popular choice. Culinary applications span from baked goods, such as bread, muffins, chocolates, waffles, and porridge, to global cuisines like Ethiopian, where Teff is a staple. The market's growth is influenced by the increasing dietary preferences for gluten-free and whole-grain foods.
- Online shopping platforms have made Teff accessible to a broader audience, enabling home baking and foodservice industry applications. Key Insights reveal that Ethiopian cuisine and food production units are significant contributors to The market. The market's expansion is driven by the increasing popularity of Teff and its versatility in various dishes, from appetizing flatbreads to flavorful breakfast options and ethnic sweets. Sustainable farming practices and an attractive name and packaging further enhance Teff's appeal. As e-commerce businesses continue to thrive, the market is poised for growth, with internet penetration rates in key regions reaching nearly 90%. This trend is expected to increase the demand for Teff and its various products, offering companies In the superfood industry promising opportunities for expansion.
What challenges does the Teff Industry face during its growth?
The fluctuating price of teff is a key challenge affecting the industry growth.
- The market encompasses a range of millet-based products, including Ivory teff and reddish brown Teff, which are whole grain and gluten-free. Whole Grain Teff and Teff Flour are essential components of health-conscious diets, catering to consumers with gluten sensitivity and those seeking fiber-rich, nutrient-dense alternatives. Teff's high fiber content, essential amino acids, and minerals like calcium and iron make it an attractive choice for various culinary applications, from baked goods and sweets to breakfast items like porridge and bread. Global cuisines, such as Ethiopian, have long embraced Teff, with Ethiopian food and production units playing a significant role In the market's growth.
- The demand for Teff continues to expand, driven by its versatility and appeal to diverse dietary preferences. Home baking and foodservice industries increasingly incorporate Teff into their offerings, from pizza crust mixes and bread to muffins, chocolates, waffles, and more. Despite its numerous benefits, the market faces challenges, primarily the price volatility of this grain type. The price of Teff can fluctuate significantly due to variations in supply and demand. Increased global demand for Teff, driven by consumer awareness and industry trends, can lead to price increases. Conversely, crop failures or production level fluctuations can result in decreased supply and price hikes.
Exclusive Customer Landscape
The market forecasting report includes the adoption lifecycle of the market, covering from the innovator's stage to the laggard's stage. It focuses on adoption rates in different regions based on penetration. Furthermore, the market report also includes key purchase criteria and drivers of price sensitivity to help companies evaluate and develop their market growth analysis strategies.

Customer Landscape
Key Companies & Market Insights
Companies are implementing various strategies, such as strategic alliances, teff market forecast, partnerships, mergers and acquisitions, geographical expansion, and product/service launches, to enhance their presence In the industry.
The industry research and growth report includes detailed analyses of the competitive landscape of the market and information about key companies, including:
- Bobs Red Mill Natural Foods Inc.
- Ceres Enterprises Ltd.
- COSTA CONCENTRADOS LEVANTINOS
- King Arthur Baking Co. Inc.
- PROBIOS SpA
- SHILOH FARMS
- TEFFCOM
- THE TEFF CO.
- Tobia Teff UK Ltd.
- Wild For
Qualitative and quantitative analysis of companies has been conducted to help clients understand the wider business environment as well as the strengths and weaknesses of key industry players. Data is qualitatively analyzed to categorize companies as pure play, category-focused, industry-focused, and diversified; it is quantitatively analyzed to categorize companies as dominant, leading, strong, tentative, and weak.
Research Analyst Overview
Teff, a small, ancient grain native to Ethiopia, has gained significant attention In the global food industry due to its unique characteristics and health benefits. This grain, available in two primary colors - ivory and reddish brown - is a whole grain that offers numerous advantages for various culinary applications. Teff's nutritional profile is noteworthy, as it is rich in essential minerals, including calcium and iron. Its high fiber content makes it an attractive option for consumers with dietary preferences leaning towards gluten-free and fiber-rich foods. The grain's amino acid profile is also noteworthy, making it a valuable component In the production of gluten-free products.
Moreover, the versatility of teff extends beyond its nutritional benefits. Its neutral flavor and fine texture make it suitable for various culinary applications, from baked goods and sweets to porridge and savory dishes. In the baking industry, teff flour is used to create bread, muffins, and chocolates, while In the foodservice sector, it is used to make waffles and pizza crust mixes. The market has witnessed steady growth due to increasing consumer awareness of health and nutrition. The grain's unique properties, including its high mineral content and gluten-free status, have made it a popular choice among health-conscious consumers.
Additionally, the growing popularity of ethnic cuisines, particularly Ethiopian, has fueled demand for teff In the food industry. Key insights into The market suggest that production units are increasing to meet the growing demand. Raw materials for teff production are sourced primarily from Ethiopia, where the grain has been cultivated for centuries. The high altitude at which teff is grown contributes to its unique flavor experiences, making it a desirable ingredient for both home baking and commercial food production. The appeal of teff lies not only in its nutritional benefits and culinary versatility but also in its sustainability.
|
Market Scope |
|
|
Report Coverage |
Details |
|
Page number |
138 |
|
Base year |
2023 |
|
Historic period |
2018-2022 |
|
Forecast period |
2024-2028 |
|
Growth momentum & CAGR |
Accelerate at a CAGR of 16.38% |
|
Market Growth 2024-2028 |
USD 2.22 billion |
|
Market structure |
Concentrated |
|
YoY growth 2023-2024(%) |
15.25 |
|
Key countries |
US, UK, Germany, Australia, and France |
|
Competitive landscape |
Leading Companies, Market Positioning of Companies, Competitive Strategies, and Industry Risks |
What are the Key Data Covered in this Market Research and Growth Report?
- CAGR of the Teff industry during the forecast period
- Detailed information on factors that will drive the market growth and forecasting between 2024 and 2028
- Precise estimation of the size of the market and its contribution of the industry in focus to the parent market
- Accurate predictions about upcoming growth and trends and changes in consumer behaviour
- Growth of the market across Europe, North America, APAC, South America, and Middle East and Africa
- Thorough analysis of the market's competitive landscape and detailed information about companies
- Comprehensive analysis of factors that will challenge the teff market growth of industry companies
We can help! Our analysts can customize this teff market research report to meet your requirements.
 RIA -
RIA - 
