Thin Client Market Analysis, Size, and Forecast 2026-2030: North America (US, Canada, and Mexico), Europe (Germany, France, and UK), APAC (China, Japan, and India), South America (Brazil and Argentina), Middle East and Africa (Saudi Arabia, UAE, and South Africa), and Rest of World (ROW)

Thin Client Market Analysis, Size, and Forecast 2026-2030:
North America (US, Canada, and Mexico), Europe (Germany, France, and UK), APAC (China, Japan, and India), South America (Brazil and Argentina), Middle East and Africa (Saudi Arabia, UAE, and South Africa), and Rest of World (ROW)

Published: Dec 2025 303 Pages SKU: IRTNTR71246

Market Overview at a Glance

$146.8 Mn
Market Opportunity
2.2%
CAGR 2025 - 2030
46.1%
North America Growth
$353.4 Mn
BFSI segment 2024

Thin Client Market Size 2026-2030

The thin client market size is valued to increase by USD 146.8 million, at a CAGR of 2.2% from 2025 to 2030. Increasing adoption of hybrid and remote work models will drive the thin client market.

Major Market Trends & Insights

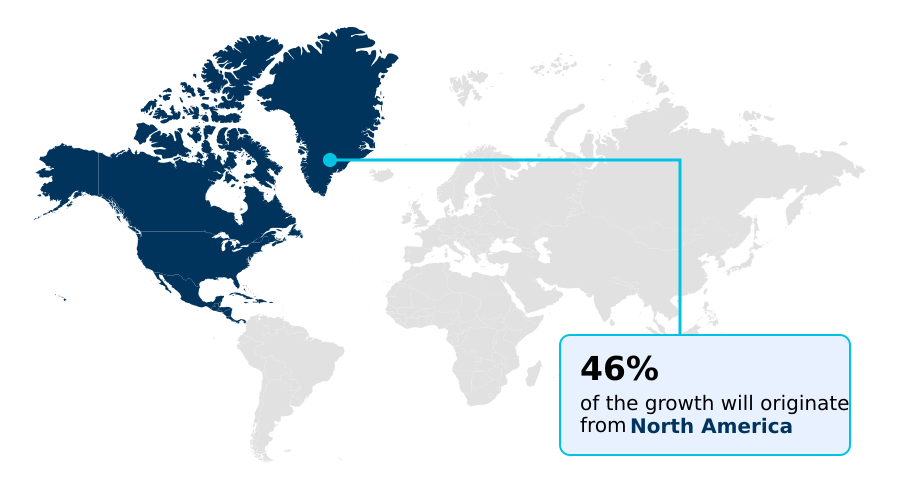
  • North America dominated the market and accounted for a 46.1% growth during the forecast period.
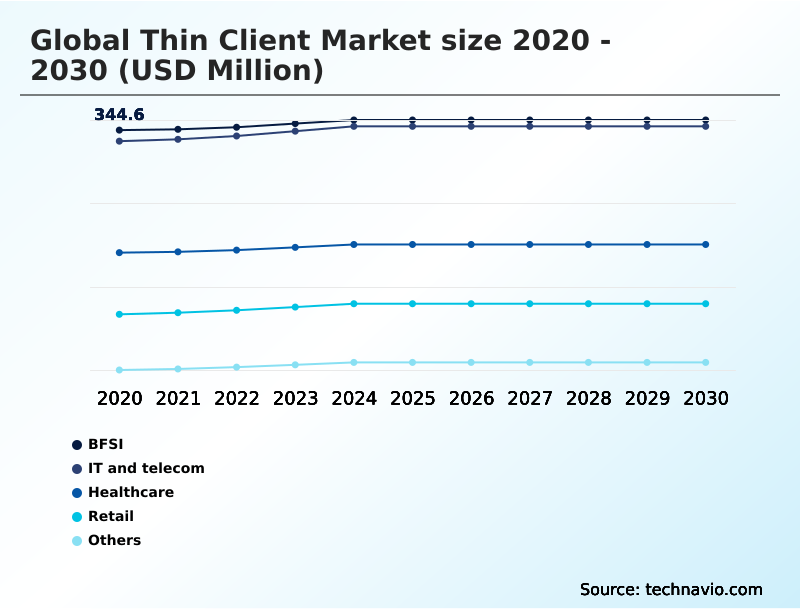
  • By End-user - BFSI segment was valued at USD 353.4 million in 2024
  • By Form Factor - Standalone segment accounted for the largest market revenue share in 2024

Market Size & Forecast

  • Market Opportunities: USD 206.5 million
  • Market Future Opportunities: USD 146.8 million
  • CAGR from 2025 to 2030 : 2.2%

Market Summary

  • The thin client market is defined by its role in bolstering cybersecurity and enhancing operational efficiency within modern IT infrastructures. The fundamental shift towards centralized computing architectures is driven by the imperative to secure data and streamline management, particularly for distributed workforces.
  • Organizations are replacing traditional PCs with endpoint computing devices that rely on a remote server, effectively moving the attack surface away from the user's desk and into a controlled data center.
  • This architecture is crucial in industries like finance, where a firm might deploy thin clients on its trading floors to ensure that no sensitive transactional data is stored locally, thereby mitigating risks of data leakage and simplifying regulatory compliance. The adoption of desktop as a service (DaaS) further accelerates this trend, lowering the barrier to entry for virtual desktop infrastructure.
  • While the technology offers a lower total cost of ownership through reduced energy consumption and longer hardware lifecycles, its performance is intrinsically tied to network quality.
  • The evolution of virtualization protocols and AI-driven management tools continues to address these challenges, broadening the applicability of thin clients from task-based roles to more demanding knowledge worker environments, reinforcing their strategic value in the enterprise.

What will be the Size of the Thin Client Market during the forecast period?

Get Key Insights on Market Forecast (PDF) Request Free Sample

How is the Thin Client Market Segmented?

The thin client industry research report provides comprehensive data (region-wise segment analysis), with forecasts and estimates in "USD million" for the period 2026-2030, as well as historical data from 2020-2024 for the following segments.

  • End-user
    • BFSI
    • IT and telecom
    • Healthcare
    • Retail
    • Others
  • Form factor
    • Standalone
    • With monitor
    • Mobile
  • Business model
    • Large enterprises
    • Small and medium enterprises
  • Geography
    • North America
      • US
      • Canada
      • Mexico
    • Europe
      • Germany
      • France
      • UK
    • APAC
      • China
      • Japan
      • India
    • South America
      • Brazil
      • Argentina
    • Middle East and Africa
      • Saudi Arabia
      • UAE
      • South Africa
    • Rest of World (ROW)

By End-user Insights

The bfsi segment is estimated to witness significant growth during the forecast period.

The BFSI sector remains a primary adopter of thin client technology, driven by non-negotiable requirements for data security and stringent regulatory compliance.

Financial institutions leverage virtual desktop infrastructure to protect vast quantities of sensitive customer information, ensuring data privacy and strengthening their overall security posture.

By centralizing data on servers, endpoint computing devices running secure operating systems like thinos significantly reduce the endpoint attack surface, a critical factor for meeting regulations like PCI DSS.

Centralized management software simplifies IT administration, allowing for rapid deployment of security patches.

Features such as encrypted data transmission and support for smart card readers are integral to this secure architecture, with some institutions reporting a 40% reduction in endpoint-related security incidents after implementing a zero trust security model with thin clients.

Request Free Sample

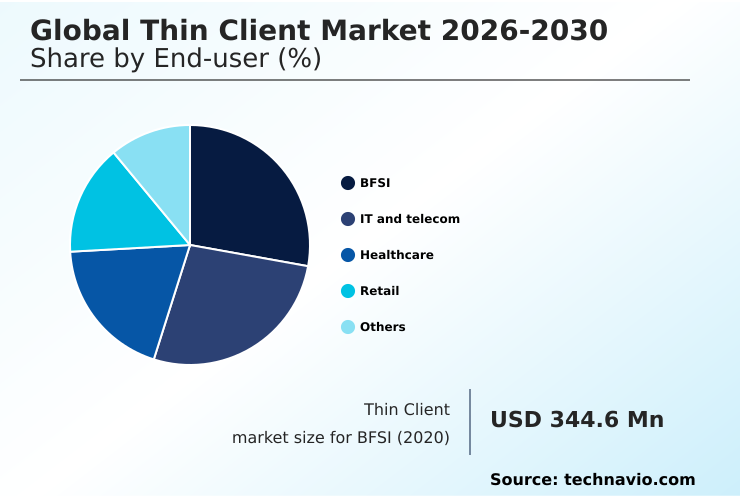
The BFSI segment was valued at USD 353.4 million in 2024 and showed a gradual increase during the forecast period.

Request Free Sample

Regional Analysis

North America is estimated to contribute 46.1% to the growth of the global market during the forecast period.Technavio’s analysts have elaborately explained the regional trends and drivers that shape the market during the forecast period.

See How Thin Client Market Demand is Rising in North America Request Free Sample

The geographic landscape of the market is diverse, led by North America's mature adoption driven by advanced server based infrastructure and a focus on security.

Europe follows, with strong demand in Germany and the UK, influenced by stringent data privacy regulations and government digitalization projects.

The APAC region presents the highest growth potential, fueled by the expansion of BPO industries in India and government-led digital initiatives in China. These developing markets are often leapfrogging traditional PC deployments in favor of more cost-effective vdi deployment.

In these regions, the adoption of zero client technology is particularly notable in large-scale educational and government projects, with deployments achieving up to a 20% improvement in resource optimization for virtual desktops.

The success of these installations often hinges on effective workload distribution to handle graphics intensive applications, showcasing the global applicability of this technology in creating a modern digital workspace.

Market Dynamics

Our researchers analyzed the data with 2025 as the base year, along with the key drivers, trends, and challenges. A holistic analysis of drivers will help companies refine their marketing strategies to gain a competitive advantage.

  • Strategic IT decisions increasingly involve a detailed analysis of thin client vs traditional pc security, where the centralized nature of thin clients offers a clear advantage. For organizations enabling a flexible workforce, a thin client for remote work setup provides a secure and manageable solution.
  • The rise of cloud computing has made desktop as a service endpoint devices a popular choice, though success hinges on following vdi deployment best practices. This includes leveraging cloud based thin client management platforms for streamlined administration. A common misconception involves performance, but modern approaches to optimizing thin client for graphics are making them viable for more demanding roles.
  • The financial argument, often framed as a total cost of ownership thin client vs pc comparison, consistently favors thin clients due to lower energy use and longer lifecycles. This is especially true in specialized fields; for instance, thin client in healthcare data security is critical for HIPAA compliance.
  • The concept of a secure endpoint for hybrid workforce is a core market driver. Use cases like a thin client for financial trading floors demonstrate their reliability in high-stakes environments. Many organizations are now implementing zero trust with thin client architectures to further harden their security.
  • The resulting thin client energy consumption savings contribute to both fiscal and sustainability goals, with some firms reporting energy cost reductions of over 30% compared to equivalent PC fleets. While managing vdi with proprietary software can create lock-in, the benefits often outweigh the drawbacks. Emerging applications, such as a thin client for industrial iot, are expanding the market's reach.
  • As businesses evaluate their endpoint strategy, the DaaS vs VDI endpoint strategy debate continues, with the choice often depending on specific infrastructure and management preferences. Other considerations include upgrading PCs with PC repurposing software, the thin client vs chromebook for education debate, securing endpoints in BFSI sector, and deploying mobile thin client for sales teams, all showcasing the technology's versatility.

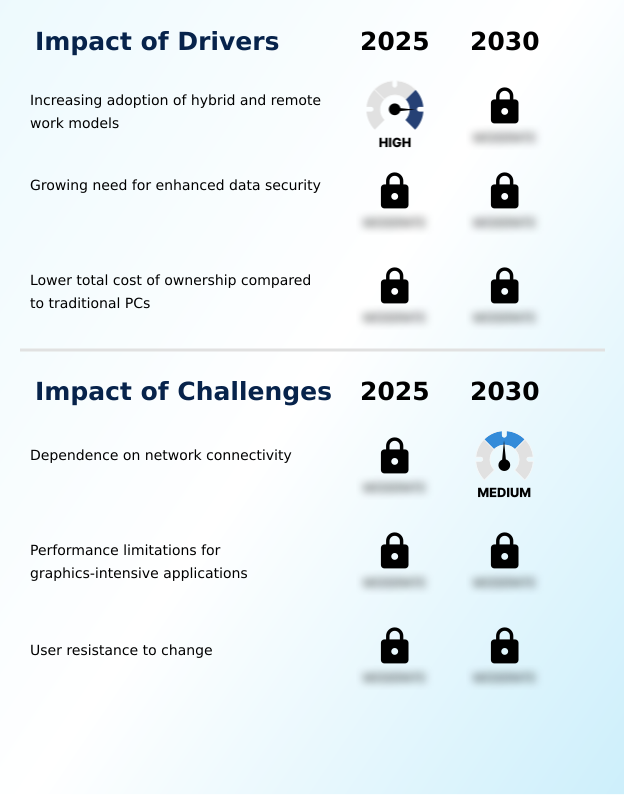
What are the key market drivers leading to the rise in the adoption of Thin Client Industry?

  • The increasing adoption of hybrid and remote work models serves as a primary driver for the thin client market, creating sustained demand for secure, manageable IT solutions for a distributed workforce.

  • The primary driver for market adoption remains the compelling value proposition of enhanced security and improved operational efficiency.
  • The adoption of desktop as a service (DaaS) offerings, often based on a subscription based licensing model, has made this technology accessible to a wider range of businesses.
  • By deploying a stateless computing device, organizations ensure all processing occurs in a secure data center, not on the endpoint. This architecture, fortified by secure boot processes and a locked down operating system, drastically reduces security vulnerabilities.
  • The lower total cost of ownership is a significant factor, with some deployments achieving over 40% savings in energy costs alone.
  • Furthermore, the ability to extend the life of existing hardware through pc repurposing offers a cost-effective path to modern endpoint management, supporting multi monitor setups and unified communications through efficient use of the remote desktop protocol.

What are the market trends shaping the Thin Client Industry?

  • A prominent market trend is the accelerating adoption of cloud-based thin clients. This shift is driven by organizational needs for scalable, centrally managed endpoints that seamlessly integrate with cloud applications and virtual desktop services.

  • The market is increasingly shaped by the trend toward cloud based management and software-defined endpoints. Organizations are leveraging an agile management console to orchestrate deployments across diverse environments, transforming any x86-64 device into a secure, cloud native endpoint.
  • This shift is highlighted by the rise of AI-powered security analytics and machine learning algorithms for predictive maintenance, which can reduce endpoint downtime by up to 30%. While some solutions rely on proprietary management software, the industry is moving toward open standards and flexible connection management platforms.
  • This focus on software enhances the user experience and supports sustainability goals through green computing. The role of the remote access provider is also evolving, with deep integrations that simplify secure access and management, reducing IT intervention for common issues by 25%.

What challenges does the Thin Client Industry face during its growth?

  • A significant challenge impacting market growth is the inherent dependence on stable, high-performance network connectivity for a satisfactory user experience.

  • A key challenge is the complete reliance on robust network connectivity and back-end server infrastructure. Any latency or outage directly impacts productivity, making the endpoint device unusable. While advancements in hyperconverged infrastructure have simplified on-premises deployments, the initial investment can be substantial.
  • Performance can also be a hurdle, as the central processing units in the data center must handle the load from all users. Ensuring a seamless user experience with features like session roaming requires careful optimization of virtualization protocols. Furthermore, managing application virtualization in complex multi cloud environments presents a challenge for IT teams.
  • In response, vendors are developing more resilient thin client operating systems and cyber immunity solutions to function in less-than-ideal network conditions, but the fundamental dependency on a high-performance connection to the virtualpccenter platform remains a significant consideration for deployment.

Exclusive Technavio Analysis on Customer Landscape

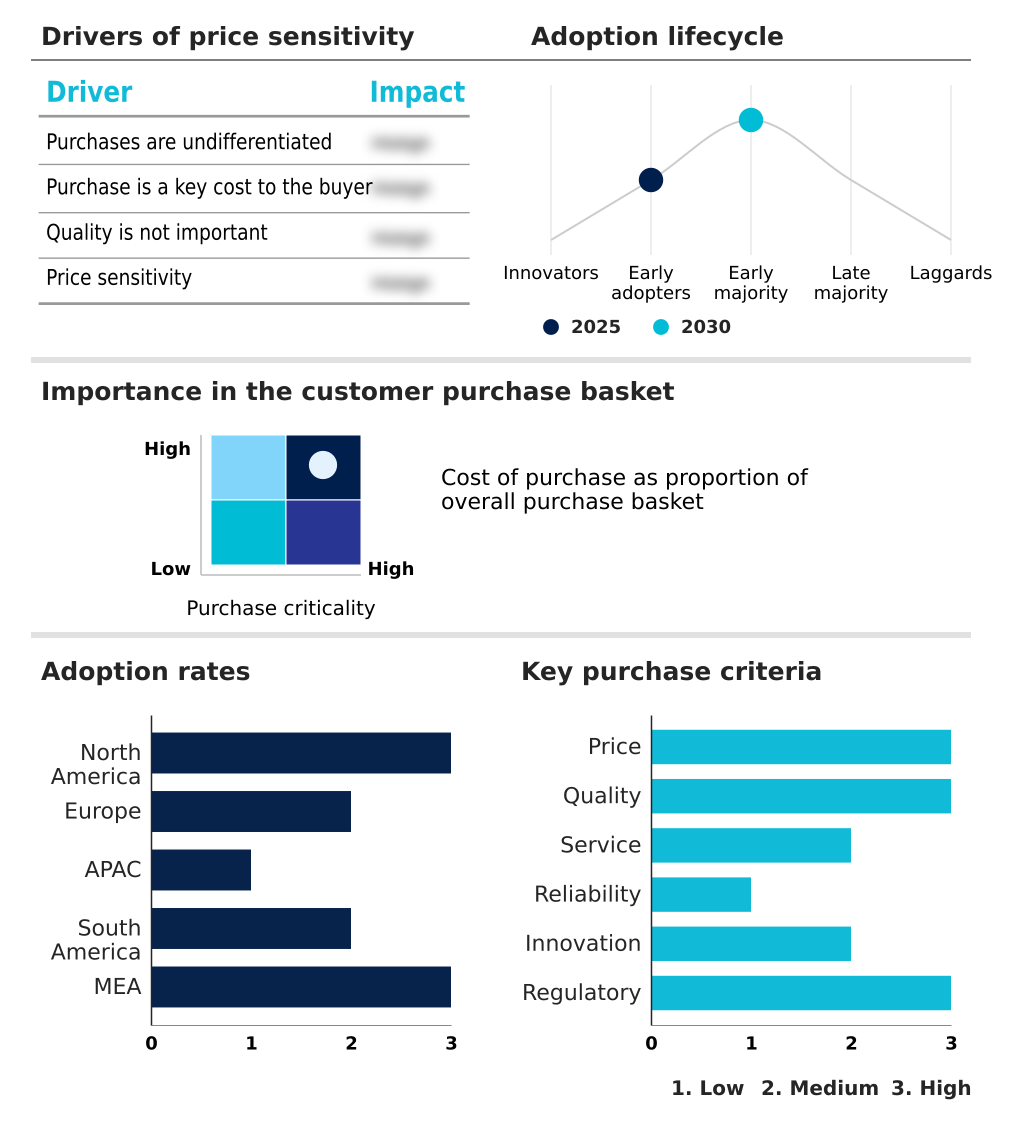
The thin client market forecasting report includes the adoption lifecycle of the market, covering from the innovator’s stage to the laggard’s stage. It focuses on adoption rates in different regions based on penetration. Furthermore, the thin client market report also includes key purchase criteria and drivers of price sensitivity to help companies evaluate and develop their market growth analysis strategies.

Customer Landscape of Thin Client Industry

Competitive Landscape

Companies are implementing various strategies, such as strategic alliances, thin client market forecast, partnerships, mergers and acquisitions, geographical expansion, and product/service launches, to enhance their presence in the industry.

10ZiG Technology Inc. - Delivering advanced thin client solutions with multi-display support and centralized management software, designed to optimize virtual desktop infrastructure environments.

The industry research and growth report includes detailed analyses of the competitive landscape of the market and information about key companies, including:

  • 10ZiG Technology Inc.
  • Acer Inc.
  • Advantech Co. Ltd.
  • ASUSTeK Computer Inc.
  • Chip PC Technologies
  • Cisco Systems Inc.
  • Dell Technologies Inc.
  • Devon IT
  • Fujian Centerm Co. Ltd.
  • Fujitsu Ltd.
  • HP Inc.
  • IGEL
  • INP Computer Technology
  • Lenovo Group Ltd.
  • LG Electronics Inc.
  • Ncomputing Co. Ltd.
  • NEC Corp.
  • Samsung Electronics Co. Ltd.
  • Siemens AG

Qualitative and quantitative analysis of companies has been conducted to help clients understand the wider business environment as well as the strengths and weaknesses of key industry players. Data is qualitatively analyzed to categorize companies as pure play, category-focused, industry-focused, and diversified; it is quantitatively analyzed to categorize companies as dominant, leading, strong, tentative, and weak.

Recent Development and News in Thin client market

  • In September 2024, Dell Technologies announced its next-generation Wyse thin clients, featuring an AI-powered security suite and native optimization for multi-cloud VDI environments.
  • In November 2024, IGEL and Amazon Web Services revealed a deepened strategic partnership to deliver a fully integrated solution for Amazon WorkSpaces, enhancing the IGEL OS for seamless cloud-native endpoint management.
  • In February 2025, HP Inc. acquired a leading PC repurposing software company to expand its HP Wolf Security portfolio, strengthening its ability to convert existing hardware into secure, managed endpoints.
  • In May 2025, Lenovo Group Ltd. launched a new line of mobile thin clients specifically designed for manufacturing and logistics, featuring ruggedized chassis and enhanced support for industrial IoT protocols.

Dive into Technavio’s robust research methodology, blending expert interviews, extensive data synthesis, and validated models for unparalleled Thin Client Market insights. See full methodology.

Market Scope
Page number 303
Base year 2025
Historic period 2020-2024
Forecast period 2026-2030
Growth momentum & CAGR Accelerate at a CAGR of 2.2%
Market growth 2026-2030 USD 146.8 million
Market structure Fragmented
YoY growth 2025-2026(%) 2.1%
Key countries US, Canada, Mexico, Germany, France, UK, Italy, The Netherlands, Spain, China, Japan, India, South Korea, Australia, Indonesia, Brazil, Argentina, Chile, Saudi Arabia, UAE, South Africa, Israel and Turkey
Competitive landscape Leading Companies, Market Positioning of Companies, Competitive Strategies, and Industry Risks

Request Free Sample

Research Analyst Overview

  • The thin client market continues its evolution, driven by the enterprise-wide adoption of virtual desktop infrastructure and desktop as a service models. This transition is fundamentally about centralizing control and minimizing risk at the network edge. Organizations are deploying endpoint computing devices, including those utilizing zero client technology, to create a secure, server based infrastructure.
  • These stateless computing devices connect to a remote server or data center, ensuring that all data and applications remain firewalled. The core technology stack includes specialized thin client operating systems like thinpro os or thinos and robust centralized management software.
  • Modern devices incorporate secure boot processes and encrypted data transmission as standard, running a locked down operating system to mitigate threats. Companies report that such endpoint security measures can reduce device provisioning times by as much as 75%. Innovations like cyber immunity solutions and next gen edge os are further hardening these systems.
  • The ability to perform a hardware refresh with minimal disruption, coupled with an agile management console and pc repurposing options, underscores the technology’s strategic value in today's IT landscape.

What are the Key Data Covered in this Thin Client Market Research and Growth Report?

  • What is the expected growth of the Thin Client Market between 2026 and 2030?

    • USD 146.8 million, at a CAGR of 2.2%

  • What segmentation does the market report cover?

    • The report is segmented by End-user (BFSI, IT and telecom, Healthcare, Retail, and Others), Form Factor (Standalone, With monitor, and Mobile), Business Model (Large enterprises, and Small and medium enterprises) and Geography (North America, Europe, APAC, South America, Middle East and Africa)

  • Which regions are analyzed in the report?

    • North America, Europe, APAC, South America and Middle East and Africa

  • What are the key growth drivers and market challenges?

    • Increasing adoption of hybrid and remote work models, Dependence on network connectivity

  • Who are the major players in the Thin Client Market?

    • 10ZiG Technology Inc., Acer Inc., Advantech Co. Ltd., ASUSTeK Computer Inc., Chip PC Technologies, Cisco Systems Inc., Dell Technologies Inc., Devon IT, Fujian Centerm Co. Ltd., Fujitsu Ltd., HP Inc., IGEL, INP Computer Technology, Lenovo Group Ltd., LG Electronics Inc., Ncomputing Co. Ltd., NEC Corp., Samsung Electronics Co. Ltd. and Siemens AG

Market Research Insights

  • The market is characterized by a strategic shift toward architectures that prioritize a robust security posture and enhanced operational efficiency. Organizations are achieving significant gains; for instance, the adoption of virtual desktops accessed via secure endpoint devices has been shown to reduce IT administration overhead by up to 40%.
  • This is driven by the need to manage a distributed workforce while maintaining stringent regulatory compliance. The focus on total cost of ownership remains critical, with deployments demonstrating a 25% lower energy consumption compared to traditional PCs. As businesses migrate to multi-cloud environments, the demand for endpoints that support diverse virtualization protocols and deliver a superior user experience is paramount.
  • This transition is not just about cost savings but is a fundamental re-evaluation of the digital workspace to ensure data privacy and business continuity.

We can help! Our analysts can customize this thin client market research report to meet your requirements.

Get in touch

1. Executive Summary

1.1 Market overview

Executive Summary - Chart on Market Overview
Executive Summary - Data Table on Market Overview
Executive Summary - Chart on Global Market Characteristics
Executive Summary - Chart on Market by Geography
Executive Summary - Chart on Market Segmentation by End-user
Executive Summary - Chart on Market Segmentation by Form Factor
Executive Summary - Chart on Market Segmentation by Business Model
Executive Summary - Chart on Incremental Growth
Executive Summary - Data Table on Incremental Growth
Executive Summary - Chart on Company Market Positioning

2. Technavio Analysis

2.1 Analysis of price sensitivity, lifecycle, customer purchase basket, adoption rates, and purchase criteria

2.2 Criticality of inputs and Factors of differentiation

Chart on Overview on criticality of inputs and factors of differentiation

2.3 Factors of disruption

Chart on Overview on factors of disruption

2.4 Impact of drivers and challenges

Chart on Impact of drivers and challenges in 2025 and 2030

3. Market Landscape

3.1 Market ecosystem

Chart on Parent Market
Data Table on - Parent Market

3.2 Market characteristics

Chart on Market characteristics analysis

3.3 Value chain analysis

Chart on Value chain analysis

4. Market Sizing

4.1 Market definition

Data Table on Offerings of companies included in the market definition

4.2 Market segment analysis

Market segments

4.3 Market size 2025

4.4 Market outlook: Forecast for 2025-2030

Chart on Global - Market size and forecast 2025-2030 ($ million)
Data Table on Global - Market size and forecast 2025-2030 ($ million)
Chart on Global Market: Year-over-year growth 2025-2030 (%)
Data Table on Global Market: Year-over-year growth 2025-2030 (%)

5. Historic Market Size

5.1 Global Thin Client Market 2020 - 2024

Historic Market Size - Data Table on Global Thin Client Market 2020 - 2024 ($ million)

5.2 End-user segment analysis 2020 - 2024

Historic Market Size - End-user Segment 2020 - 2024 ($ million)

5.3 Form Factor segment analysis 2020 - 2024

Historic Market Size - Form Factor Segment 2020 - 2024 ($ million)

5.4 Business Model segment analysis 2020 - 2024

Historic Market Size - Business Model Segment 2020 - 2024 ($ million)

5.5 Geography segment analysis 2020 - 2024

Historic Market Size - Geography Segment 2020 - 2024 ($ million)

5.6 Country segment analysis 2020 - 2024

Historic Market Size - Country Segment 2020 - 2024 ($ million)

6. Qualitative Analysis

6.1 The AI impact on global thin client market

7. Five Forces Analysis

7.1 Five forces summary

Five forces analysis - Comparison between 2025 and 2030

7.2 Bargaining power of buyers

Bargaining power of buyers - Impact of key factors 2025 and 2030

7.3 Bargaining power of suppliers

Bargaining power of suppliers - Impact of key factors in 2025 and 2030

7.4 Threat of new entrants

Threat of new entrants - Impact of key factors in 2025 and 2030

7.5 Threat of substitutes

Threat of substitutes - Impact of key factors in 2025 and 2030

7.6 Threat of rivalry

Threat of rivalry - Impact of key factors in 2025 and 2030

7.7 Market condition

Chart on Market condition - Five forces 2025 and 2030

8. Market Segmentation by End-user

8.1 Market segments

Chart on End-user - Market share 2025-2030 (%)
Data Table on End-user - Market share 2025-2030 (%)

8.2 Comparison by End-user

Chart on Comparison by End-user
Data Table on Comparison by End-user

8.3 BFSI - Market size and forecast 2025-2030

Chart on BFSI - Market size and forecast 2025-2030 ($ million)
Data Table on BFSI - Market size and forecast 2025-2030 ($ million)
Chart on BFSI - Year-over-year growth 2025-2030 (%)
Data Table on BFSI - Year-over-year growth 2025-2030 (%)

8.4 IT and telecom - Market size and forecast 2025-2030

Chart on IT and telecom - Market size and forecast 2025-2030 ($ million)
Data Table on IT and telecom - Market size and forecast 2025-2030 ($ million)
Chart on IT and telecom - Year-over-year growth 2025-2030 (%)
Data Table on IT and telecom - Year-over-year growth 2025-2030 (%)

8.5 Healthcare - Market size and forecast 2025-2030

Chart on Healthcare - Market size and forecast 2025-2030 ($ million)
Data Table on Healthcare - Market size and forecast 2025-2030 ($ million)
Chart on Healthcare - Year-over-year growth 2025-2030 (%)
Data Table on Healthcare - Year-over-year growth 2025-2030 (%)

8.6 Retail - Market size and forecast 2025-2030

Chart on Retail - Market size and forecast 2025-2030 ($ million)
Data Table on Retail - Market size and forecast 2025-2030 ($ million)
Chart on Retail - Year-over-year growth 2025-2030 (%)
Data Table on Retail - Year-over-year growth 2025-2030 (%)

8.7 Others - Market size and forecast 2025-2030

Chart on Others - Market size and forecast 2025-2030 ($ million)
Data Table on Others - Market size and forecast 2025-2030 ($ million)
Chart on Others - Year-over-year growth 2025-2030 (%)
Data Table on Others - Year-over-year growth 2025-2030 (%)

8.8 Market opportunity by End-user

Market opportunity by End-user ($ million)
Data Table on Market opportunity by End-user ($ million)

9. Market Segmentation by Form Factor

9.1 Market segments

Chart on Form Factor - Market share 2025-2030 (%)
Data Table on Form Factor - Market share 2025-2030 (%)

9.2 Comparison by Form Factor

Chart on Comparison by Form Factor
Data Table on Comparison by Form Factor

9.3 Standalone - Market size and forecast 2025-2030

Chart on Standalone - Market size and forecast 2025-2030 ($ million)
Data Table on Standalone - Market size and forecast 2025-2030 ($ million)
Chart on Standalone - Year-over-year growth 2025-2030 (%)
Data Table on Standalone - Year-over-year growth 2025-2030 (%)

9.4 With monitor - Market size and forecast 2025-2030

Chart on With monitor - Market size and forecast 2025-2030 ($ million)
Data Table on With monitor - Market size and forecast 2025-2030 ($ million)
Chart on With monitor - Year-over-year growth 2025-2030 (%)
Data Table on With monitor - Year-over-year growth 2025-2030 (%)

9.5 Mobile - Market size and forecast 2025-2030

Chart on Mobile - Market size and forecast 2025-2030 ($ million)
Data Table on Mobile - Market size and forecast 2025-2030 ($ million)
Chart on Mobile - Year-over-year growth 2025-2030 (%)
Data Table on Mobile - Year-over-year growth 2025-2030 (%)

9.6 Market opportunity by Form Factor

Market opportunity by Form Factor ($ million)
Data Table on Market opportunity by Form Factor ($ million)

10. Market Segmentation by Business Model

10.1 Market segments

Chart on Market Segmentation by Business Model - Market share 2025-2030 (%)
Data Table on Market Segmentation by Business Model - Market share 2025-2030 (%)

10.2 Comparison by Market Segmentation by Business Model

Chart on Comparison by Market Segmentation by Business Model
Data Table on Comparison by Market Segmentation by Business Model

10.3 Large enterprises - Market size and forecast 2025-2030

Chart on Large enterprises - Market size and forecast 2025-2030 ($ million)
Data Table on Large enterprises - Market size and forecast 2025-2030 ($ million)
Chart on Large enterprises - Year-over-year growth 2025-2030 (%)
Data Table on Large enterprises - Year-over-year growth 2025-2030 (%)

10.4 Small and medium enterprises - Market size and forecast 2025-2030

Chart on Small and medium enterprises - Market size and forecast 2025-2030 ($ million)
Data Table on Small and medium enterprises - Market size and forecast 2025-2030 ($ million)
Chart on Small and medium enterprises - Year-over-year growth 2025-2030 (%)
Data Table on Small and medium enterprises - Year-over-year growth 2025-2030 (%)

10.5 Market opportunity by Market Segmentation by Business Model

Market opportunity by Market Segmentation by Business Model ($ million)
Data Table on Market opportunity by Market Segmentation by Business Model ($ million)

11. Customer Landscape

11.1 Customer landscape overview

Analysis of price sensitivity, lifecycle, customer purchase basket, adoption rates, and purchase criteria

12. Geographic Landscape

12.1 Geographic segmentation

Chart on Market share by geography 2025-2030 (%)
Data Table on Market share by geography 2025-2030 (%)

12.2 Geographic comparison

Chart on Geographic comparison
Data Table on Geographic comparison

12.3 North America - Market size and forecast 2025-2030

Chart on North America - Market size and forecast 2025-2030 ($ million)
Data Table on North America - Market size and forecast 2025-2030 ($ million)
Chart on North America - Year-over-year growth 2025-2030 (%)
Data Table on North America - Year-over-year growth 2025-2030 (%)
Chart on Regional Comparison - North America
Data Table on Regional Comparison - North America

12.3.1 US - Market size and forecast 2025-2030

Chart on US - Market size and forecast 2025-2030 ($ million)
Data Table on US - Market size and forecast 2025-2030 ($ million)
Chart on US - Year-over-year growth 2025-2030 (%)
Data Table on US - Year-over-year growth 2025-2030 (%)

12.3.2 Canada - Market size and forecast 2025-2030

Chart on Canada - Market size and forecast 2025-2030 ($ million)
Data Table on Canada - Market size and forecast 2025-2030 ($ million)
Chart on Canada - Year-over-year growth 2025-2030 (%)
Data Table on Canada - Year-over-year growth 2025-2030 (%)

12.3.3 Mexico - Market size and forecast 2025-2030

Chart on Mexico - Market size and forecast 2025-2030 ($ million)
Data Table on Mexico - Market size and forecast 2025-2030 ($ million)
Chart on Mexico - Year-over-year growth 2025-2030 (%)
Data Table on Mexico - Year-over-year growth 2025-2030 (%)

12.4 Europe - Market size and forecast 2025-2030

Chart on Europe - Market size and forecast 2025-2030 ($ million)
Data Table on Europe - Market size and forecast 2025-2030 ($ million)
Chart on Europe - Year-over-year growth 2025-2030 (%)
Data Table on Europe - Year-over-year growth 2025-2030 (%)
Chart on Regional Comparison - Europe
Data Table on Regional Comparison - Europe

12.4.1 Germany - Market size and forecast 2025-2030

Chart on Germany - Market size and forecast 2025-2030 ($ million)
Data Table on Germany - Market size and forecast 2025-2030 ($ million)
Chart on Germany - Year-over-year growth 2025-2030 (%)
Data Table on Germany - Year-over-year growth 2025-2030 (%)

12.4.2 France - Market size and forecast 2025-2030

Chart on France - Market size and forecast 2025-2030 ($ million)
Data Table on France - Market size and forecast 2025-2030 ($ million)
Chart on France - Year-over-year growth 2025-2030 (%)
Data Table on France - Year-over-year growth 2025-2030 (%)

12.4.3 UK - Market size and forecast 2025-2030

Chart on UK - Market size and forecast 2025-2030 ($ million)
Data Table on UK - Market size and forecast 2025-2030 ($ million)
Chart on UK - Year-over-year growth 2025-2030 (%)
Data Table on UK - Year-over-year growth 2025-2030 (%)

12.4.4 Italy - Market size and forecast 2025-2030

Chart on Italy - Market size and forecast 2025-2030 ($ million)
Data Table on Italy - Market size and forecast 2025-2030 ($ million)
Chart on Italy - Year-over-year growth 2025-2030 (%)
Data Table on Italy - Year-over-year growth 2025-2030 (%)

12.4.5 The Netherlands - Market size and forecast 2025-2030

Chart on The Netherlands - Market size and forecast 2025-2030 ($ million)
Data Table on The Netherlands - Market size and forecast 2025-2030 ($ million)
Chart on The Netherlands - Year-over-year growth 2025-2030 (%)
Data Table on The Netherlands - Year-over-year growth 2025-2030 (%)

12.4.6 Spain - Market size and forecast 2025-2030

Chart on Spain - Market size and forecast 2025-2030 ($ million)
Data Table on Spain - Market size and forecast 2025-2030 ($ million)
Chart on Spain - Year-over-year growth 2025-2030 (%)
Data Table on Spain - Year-over-year growth 2025-2030 (%)

12.5 APAC - Market size and forecast 2025-2030

Chart on APAC - Market size and forecast 2025-2030 ($ million)
Data Table on APAC - Market size and forecast 2025-2030 ($ million)
Chart on APAC - Year-over-year growth 2025-2030 (%)
Data Table on APAC - Year-over-year growth 2025-2030 (%)
Chart on Regional Comparison - APAC
Data Table on Regional Comparison - APAC

12.5.1 China - Market size and forecast 2025-2030

Chart on China - Market size and forecast 2025-2030 ($ million)
Data Table on China - Market size and forecast 2025-2030 ($ million)
Chart on China - Year-over-year growth 2025-2030 (%)
Data Table on China - Year-over-year growth 2025-2030 (%)

12.5.2 Japan - Market size and forecast 2025-2030

Chart on Japan - Market size and forecast 2025-2030 ($ million)
Data Table on Japan - Market size and forecast 2025-2030 ($ million)
Chart on Japan - Year-over-year growth 2025-2030 (%)
Data Table on Japan - Year-over-year growth 2025-2030 (%)

12.5.3 India - Market size and forecast 2025-2030

Chart on India - Market size and forecast 2025-2030 ($ million)
Data Table on India - Market size and forecast 2025-2030 ($ million)
Chart on India - Year-over-year growth 2025-2030 (%)
Data Table on India - Year-over-year growth 2025-2030 (%)

12.5.4 South Korea - Market size and forecast 2025-2030

Chart on South Korea - Market size and forecast 2025-2030 ($ million)
Data Table on South Korea - Market size and forecast 2025-2030 ($ million)
Chart on South Korea - Year-over-year growth 2025-2030 (%)
Data Table on South Korea - Year-over-year growth 2025-2030 (%)

12.5.5 Australia - Market size and forecast 2025-2030

Chart on Australia - Market size and forecast 2025-2030 ($ million)
Data Table on Australia - Market size and forecast 2025-2030 ($ million)
Chart on Australia - Year-over-year growth 2025-2030 (%)
Data Table on Australia - Year-over-year growth 2025-2030 (%)

12.5.6 Indonesia - Market size and forecast 2025-2030

Chart on Indonesia - Market size and forecast 2025-2030 ($ million)
Data Table on Indonesia - Market size and forecast 2025-2030 ($ million)
Chart on Indonesia - Year-over-year growth 2025-2030 (%)
Data Table on Indonesia - Year-over-year growth 2025-2030 (%)

12.6 South America - Market size and forecast 2025-2030

Chart on South America - Market size and forecast 2025-2030 ($ million)
Data Table on South America - Market size and forecast 2025-2030 ($ million)
Chart on South America - Year-over-year growth 2025-2030 (%)
Data Table on South America - Year-over-year growth 2025-2030 (%)
Chart on Regional Comparison - South America
Data Table on Regional Comparison - South America

12.6.1 Brazil - Market size and forecast 2025-2030

Chart on Brazil - Market size and forecast 2025-2030 ($ million)
Data Table on Brazil - Market size and forecast 2025-2030 ($ million)
Chart on Brazil - Year-over-year growth 2025-2030 (%)
Data Table on Brazil - Year-over-year growth 2025-2030 (%)

12.6.2 Argentina - Market size and forecast 2025-2030

Chart on Argentina - Market size and forecast 2025-2030 ($ million)
Data Table on Argentina - Market size and forecast 2025-2030 ($ million)
Chart on Argentina - Year-over-year growth 2025-2030 (%)
Data Table on Argentina - Year-over-year growth 2025-2030 (%)

12.6.3 Chile - Market size and forecast 2025-2030

Chart on Chile - Market size and forecast 2025-2030 ($ million)
Data Table on Chile - Market size and forecast 2025-2030 ($ million)
Chart on Chile - Year-over-year growth 2025-2030 (%)
Data Table on Chile - Year-over-year growth 2025-2030 (%)

12.7 Middle East and Africa - Market size and forecast 2025-2030

Chart on Middle East and Africa - Market size and forecast 2025-2030 ($ million)
Data Table on Middle East and Africa - Market size and forecast 2025-2030 ($ million)
Chart on Middle East and Africa - Year-over-year growth 2025-2030 (%)
Data Table on Middle East and Africa - Year-over-year growth 2025-2030 (%)
Chart on Regional Comparison - Middle East and Africa
Data Table on Regional Comparison - Middle East and Africa

12.7.1 Saudi Arabia - Market size and forecast 2025-2030

Chart on Saudi Arabia - Market size and forecast 2025-2030 ($ million)
Data Table on Saudi Arabia - Market size and forecast 2025-2030 ($ million)
Chart on Saudi Arabia - Year-over-year growth 2025-2030 (%)
Data Table on Saudi Arabia - Year-over-year growth 2025-2030 (%)

12.7.2 UAE - Market size and forecast 2025-2030

Chart on UAE - Market size and forecast 2025-2030 ($ million)
Data Table on UAE - Market size and forecast 2025-2030 ($ million)
Chart on UAE - Year-over-year growth 2025-2030 (%)
Data Table on UAE - Year-over-year growth 2025-2030 (%)

12.7.3 South Africa - Market size and forecast 2025-2030

Chart on South Africa - Market size and forecast 2025-2030 ($ million)
Data Table on South Africa - Market size and forecast 2025-2030 ($ million)
Chart on South Africa - Year-over-year growth 2025-2030 (%)
Data Table on South Africa - Year-over-year growth 2025-2030 (%)

12.7.4 Israel - Market size and forecast 2025-2030

Chart on Israel - Market size and forecast 2025-2030 ($ million)
Data Table on Israel - Market size and forecast 2025-2030 ($ million)
Chart on Israel - Year-over-year growth 2025-2030 (%)
Data Table on Israel - Year-over-year growth 2025-2030 (%)

12.7.5 Turkey - Market size and forecast 2025-2030

Chart on Turkey - Market size and forecast 2025-2030 ($ million)
Data Table on Turkey - Market size and forecast 2025-2030 ($ million)
Chart on Turkey - Year-over-year growth 2025-2030 (%)
Data Table on Turkey - Year-over-year growth 2025-2030 (%)

12.8 Market opportunity by geography

Market opportunity by geography ($ million)
Data Tables on Market opportunity by geography ($ million)

13. Drivers, Challenges, and Opportunity

13.1 Market drivers

Increasing adoption of hybrid and remote work models
Growing need for enhanced data security
Lower total cost of ownership compared to traditional PCs

13.2 Market challenges

Dependence on network connectivity
Performance limitations for graphics-intensive applications
User resistance to change

13.3 Impact of drivers and challenges

Impact of drivers and challenges in 2025 and 2030

13.4 Market opportunities

Adoption of cloud-based thin client
Integration of AI in thin client management
Focus on sustainable and energy-efficient computing

14. Competitive Landscape

14.1 Overview

14.2

Overview on criticality of inputs and factors of differentiation

14.3 Landscape disruption

Overview on factors of disruption

14.4 Industry risks

Impact of key risks on business

15. Competitive Analysis

15.1 Companies profiled

Companies covered

15.2 Company ranking index

15.3 Market positioning of companies

Matrix on companies position and classification

15.4 10ZiG Technology Inc.

10ZiG Technology Inc. - Overview
10ZiG Technology Inc. - Product / Service
10ZiG Technology Inc. - Key offerings
SWOT

15.5 Acer Inc.

Acer Inc. - Overview
Acer Inc. - Business segments
Acer Inc. - Key news
Acer Inc. - Key offerings
Acer Inc. - Segment focus
SWOT

15.6 Advantech Co. Ltd.

Advantech Co. Ltd. - Overview
Advantech Co. Ltd. - Business segments
Advantech Co. Ltd. - Key news
Advantech Co. Ltd. - Key offerings
Advantech Co. Ltd. - Segment focus
SWOT

15.7 ASUSTeK Computer Inc.

ASUSTeK Computer Inc. - Overview
ASUSTeK Computer Inc. - Product / Service
ASUSTeK Computer Inc. - Key news
ASUSTeK Computer Inc. - Key offerings
SWOT

15.8 Chip PC Technologies

Chip PC Technologies - Overview
Chip PC Technologies - Product / Service
Chip PC Technologies - Key offerings
SWOT

15.9 Cisco Systems Inc.

Cisco Systems Inc. - Overview
Cisco Systems Inc. - Business segments
Cisco Systems Inc. - Key news
Cisco Systems Inc. - Key offerings
Cisco Systems Inc. - Segment focus
SWOT

15.10 Dell Technologies Inc.

Dell Technologies Inc. - Overview
Dell Technologies Inc. - Business segments
Dell Technologies Inc. - Key news
Dell Technologies Inc. - Key offerings
Dell Technologies Inc. - Segment focus
SWOT

15.11 Fujian Centerm Co. Ltd.

Fujian Centerm Co. Ltd. - Overview
Fujian Centerm Co. Ltd. - Product / Service
Fujian Centerm Co. Ltd. - Key offerings
SWOT

15.12 Fujitsu Ltd.

Fujitsu Ltd. - Overview
Fujitsu Ltd. - Business segments
Fujitsu Ltd. - Key news
Fujitsu Ltd. - Key offerings
Fujitsu Ltd. - Segment focus
SWOT

15.13 HP Inc.

HP Inc. - Overview
HP Inc. - Business segments
HP Inc. - Key news
HP Inc. - Key offerings
HP Inc. - Segment focus
SWOT

15.14 Lenovo Group Ltd.

Lenovo Group Ltd. - Overview
Lenovo Group Ltd. - Business segments
Lenovo Group Ltd. - Key news
Lenovo Group Ltd. - Key offerings
Lenovo Group Ltd. - Segment focus
SWOT

15.15 LG Electronics Inc.

LG Electronics Inc. - Overview
LG Electronics Inc. - Product / Service
LG Electronics Inc. - Key offerings
SWOT

15.16 NEC Corp.

NEC Corp. - Overview
NEC Corp. - Business segments
NEC Corp. - Key news
NEC Corp. - Key offerings
NEC Corp. - Segment focus
SWOT

15.17 Samsung Electronics Co. Ltd.

Samsung Electronics Co. Ltd. - Overview
Samsung Electronics Co. Ltd. - Business segments
Samsung Electronics Co. Ltd. - Key news
Samsung Electronics Co. Ltd. - Key offerings
Samsung Electronics Co. Ltd. - Segment focus
SWOT

15.18 Siemens AG

Siemens AG - Overview
Siemens AG - Business segments
Siemens AG - Key news
Siemens AG - Key offerings
Siemens AG - Segment focus
SWOT

16. Appendix

16.1 Scope of the report

Market definition
Objectives
Notes and caveats

16.2 Inclusions and exclusions checklist

Inclusions checklist
Exclusions checklist

16.3 Currency conversion rates for US$

16.4 Research methodology

16.5 Data procurement

Information sources

16.6 Data validation

16.7 Validation techniques employed for market sizing

16.8 Data synthesis

16.9 360 degree market analysis

16.10 List of abbreviations

Research Methodology

Technavio presents a detailed picture of the market by way of study, synthesis, and summation of data from multiple sources. The analysts have presented the various facets of the market with a particular focus on identifying the key industry influencers. The data thus presented is comprehensive, reliable, and the result of extensive research, both primary and secondary.

INFORMATION SOURCES

Primary sources

  • Manufacturers and suppliers
  • Channel partners
  • Industry experts
  • Strategic decision makers

Secondary sources

  • Industry journals and periodicals
  • Government data
  • Financial reports of key industry players
  • Historical data
  • Press releases

DATA ANALYSIS

Data Synthesis

  • Collation of data
  • Estimation of key figures
  • Analysis of derived insights

Data Validation

  • Triangulation with data models
  • Reference against proprietary databases
  • Corroboration with industry experts

REPORT WRITING

Qualitative

  • Market drivers
  • Market challenges
  • Market trends
  • Five forces analysis

Quantitative

  • Market size and forecast
  • Market segmentation
  • Geographical insights
  • Competitive landscape

Interested in this report?

Get your sample now to see our research methodology and insights!

Download Now

Frequently Asked Questions

Thin Client market growth will increase by USD 146.8 million during 2026-2030.

The Thin Client market is expected to grow at a CAGR of 2.2% during 2026-2030.

Thin Client market is segmented by End-user (BFSI, IT and telecom, Healthcare, Retail, Others) Form factor (Standalone, With monitor, Mobile) Business model (Large enterprises, Small and medium enterprises)

10ZiG Technology Inc., Acer Inc., Advantech Co. Ltd., ASUSTeK Computer Inc., Chip PC Technologies, Cisco Systems Inc., Dell Technologies Inc., Devon IT, Fujian Centerm Co. Ltd., Fujitsu Ltd., HP Inc., IGEL, INP Computer Technology, Lenovo Group Ltd., LG Electronics Inc., Ncomputing Co. Ltd., NEC Corp., Samsung Electronics Co. Ltd., Siemens AG are a few of the key vendors in the Thin Client market.

North America will register the highest growth rate of 46.1% among the other regions. Therefore, the Thin Client market in North America is expected to garner significant business opportunities for the vendors during the forecast period.

US, Canada, Mexico, Germany, France, UK, Italy, The Netherlands, Spain, China, Japan, India, South Korea, Australia, Indonesia, Brazil, Argentina, Chile, Saudi Arabia, UAE, South Africa, Israel, Turkey

  • Increasing adoption of hybrid and remote work models is the driving factor this market.

The Thin Client market vendors should focus on grabbing business opportunities from the End-user segment as it accounted for the largest market share in the base year.