
Data Center Interconnect Solutions Market Size 2025-2029
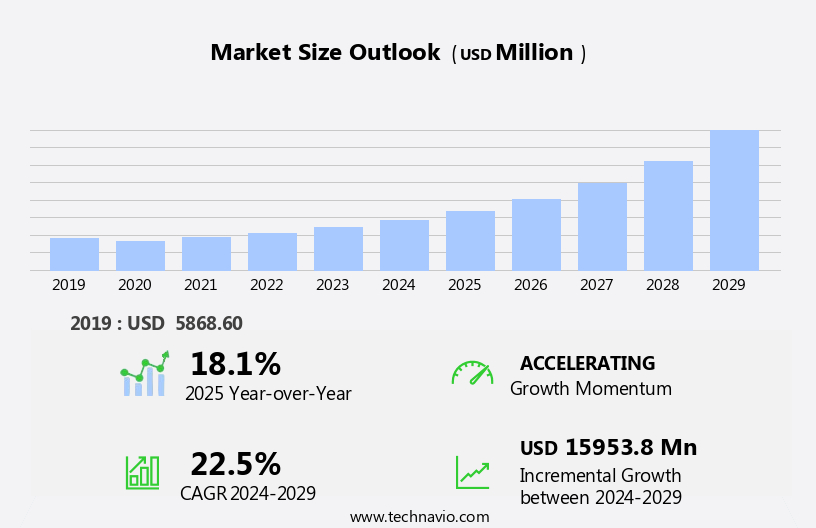
The data center interconnect solutions market size is forecast to increase by USD 15.95 billion, at a CAGR of 22.5% between 2024 and 2029.
- The market is experiencing significant growth due to the increasing demand for high-speed connectivity between data centers. With the digital transformation trend gaining momentum, there is a surging need for businesses to interconnect their data centers to support increasing bandwidth capacity and ensure seamless data transfer. This requirement is driving the adoption of advanced interconnect solutions, such as dark fiber, wavelength services, and Ethernet-based interconnects. However, the market is not without challenges. One major obstacle is the complexity and cost associated with implementing these interconnect solutions. The need for specialized expertise and infrastructure can pose a significant barrier to entry for smaller organizations.
- Additionally, ensuring security and data privacy during interconnects is a critical concern for businesses, as they look to protect sensitive information. To capitalize on the market opportunities and navigate these challenges effectively, companies must focus on offering user-friendly, cost-effective, and secure interconnect solutions. By addressing these concerns, they can differentiate themselves in the competitive landscape and meet the evolving needs of their customers.
What will be the Size of the Data Center Interconnect Solutions Market during the forecast period?
Explore in-depth regional segment analysis with market size data - historical 2019-2023 and forecasts 2025-2029 - in the full report.
Request Free Sample
The market continues to evolve, driven by the ever-increasing demand for high-speed connectivity, energy efficiency, and network security. Deployment models vary, with wireless backhaul and data center fabric gaining traction due to their flexibility and scalability. Network virtualization, network bandwidth, and virtual private networks are essential components, enabling cloud connectivity, edge computing, and network function virtualization. Emerging technologies such as coherent optics and 400 gigabit ethernet are poised to revolutionize data center efficiency, while network slicing and open standards promote network optimization and availability. Energy efficiency remains a critical concern, with power usage effectiveness and green computing playing key roles in data center design and operations.
Network security, disaster recovery, and high availability are essential considerations, with cooling systems and network management solutions ensuring optimal performance. Network latency, 100 gigabit ethernet, and software-defined networking are crucial elements of network optimization. Data center consolidation and power consumption reduction are ongoing priorities, with direct connect and data center infrastructure solutions facilitating seamless integration of various technologies. Proprietary solutions, fiber channel, and optical transceivers continue to play a significant role in the market, offering unique advantages and capabilities. Network availability, service level agreements, and wavelength division multiplexing are essential components of network operations, ensuring reliable and efficient data transfer.
Hybrid cloud solutions provide flexibility and cost savings, while network optimization and data center security remain top priorities.
How is this Data Center Interconnect Solutions Industry segmented?
The data center interconnect solutions industry research report provides comprehensive data (region-wise segment analysis), with forecasts and estimates in "USD million" for the period 2025-2029, as well as historical data from 2019-2023 for the following segments.
- End-user
- Telecommunications
- BFSI
- Cloud and IT services
- Content and digital media
- Others
- Deployment
- On-premises
- Cloud-based
- Hybrid
- Application
- Cloud connectivity
- Disaster recovery
- Workload sharing
- Solution
- Optical interconnects
- Ethernet switches
- Routers
- Software
- Geography
- North America
- US
- Canada
- Europe
- France
- Germany
- UK
- APAC
- China
- India
- Japan
- South Korea
- South America
- Brazil
- Rest of World (ROW)
- North America
By End-user Insights
The telecommunications segment is estimated to witness significant growth during the forecast period.
The market is witnessing significant growth due to the increasing demand for high-speed connectivity and data center consolidation. Coherent optics and 400 gigabit ethernet are becoming increasingly popular for enhancing network bandwidth and capacity planning. Energy efficiency is a key concern for data center operators, leading to the adoption of power usage effectiveness and green computing. Network monitoring and security solutions, including network slicing, virtual network functions, and network function virtualization, are essential for ensuring network availability and data center operations. Virtual machines and data center migration require efficient interconnect solutions for seamless integration and disaster recovery. Capacity planning and network optimization are crucial for managing power consumption and network latency.
Optical transport networks and wavelength division multiplexing are being utilized for data center interconnect, while open standards facilitate seamless integration and network management. Data center design and operations are evolving with the adoption of software-defined networking, network virtualization, and hybrid cloud. Direct connect and edge computing are becoming essential for improving network performance and reducing latency. Cooling systems and disaster recovery solutions ensure high availability and business continuity. The telecommunications segment is a major contributor to the market, driven by the rise of digital mobile payment systems and the increasing demand for better connectivity. In regions such as MEA, communications service providers (CSPs) play a crucial role in catering to the demand for data center interconnect solutions.
The deployment of proprietary solutions, fiber channel, and optical transceivers further enhances the market's growth.
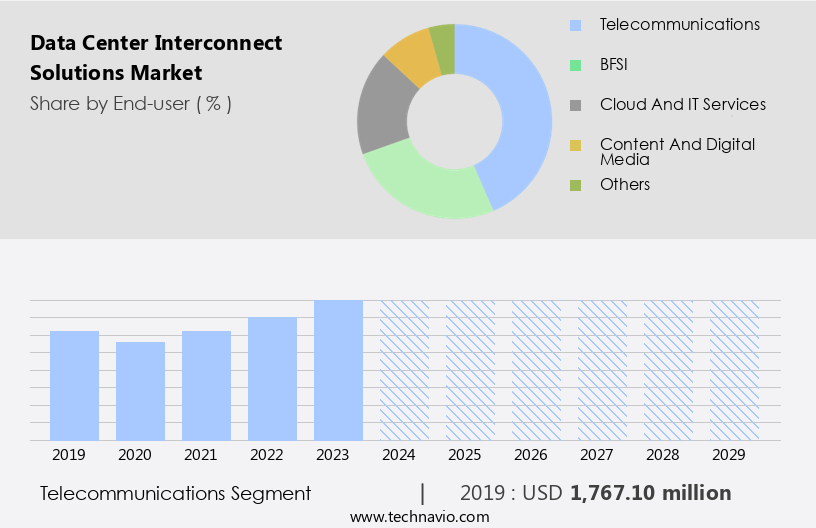
The Telecommunications segment was valued at USD 1.77 billion in 2019 and showed a gradual increase during the forecast period.
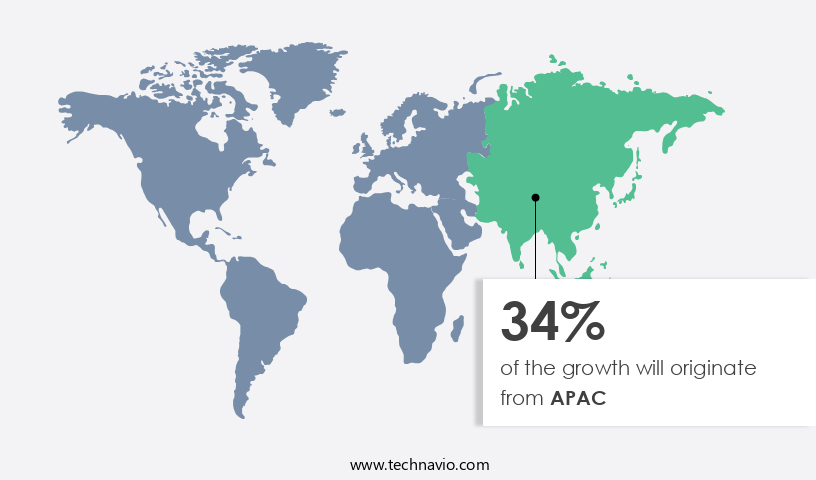
Regional Analysis
APAC is estimated to contribute 34% to the growth of the global market during the forecast period.Technavio’s analysts have elaborately explained the regional trends and drivers that shape the market during the forecast period.
The market in North America is experiencing steady growth, driven by the increasing demand for high-bandwidth connectivity from industries such as telecommunications, banking and finance, cloud and IT services, and content and digital media. The rollout of commercial 5G networks, offering low latency and high-speed connectivity, is further fueling the growth of IoT solutions and content delivery services. In the US, the adoption of cloud-based computing is accelerating, leading to a surge in data center development. According to CBRE, data center supply in primary markets increased by 34% year-over-year to 6,922 megawatts in the second half of 2021.
Energy efficiency is a significant concern in data center operations, leading to the adoption of solutions such as 400 and 800 gigabit ethernet, optical amplifiers, and optical transport networks. Network monitoring, capacity planning, and virtual machines are essential for data center migration and consolidation. Network security, network slicing, virtual network functions, and network function virtualization are critical for ensuring data center efficiency and security. Power usage effectiveness, disaster recovery, and high availability are essential considerations for data center design and operations. Cooling systems and open standards are vital for network availability and network optimization. Service level agreements, network latency, and software-defined networking are essential for network management and cloud connectivity.
Edge computing, wavelength division multiplexing, and deployment models are emerging trends in the market. Wireless backhaul and network virtualization are also gaining popularity. Proprietary solutions, fiber channel, and optical transceivers are being used to address specific industry requirements. Data center interconnect solutions are essential for hybrid cloud environments, ensuring seamless connectivity and integration between on-premises and cloud infrastructure. Network management and network bandwidth are critical for managing and optimizing network performance. Overall, the market in North America is poised for continued growth, driven by the increasing demand for high-bandwidth connectivity and the adoption of cloud-based computing.
Market Dynamics
Our researchers analyzed the data with 2024 as the base year, along with the key drivers, trends, and challenges. A holistic analysis of drivers will help companies refine their marketing strategies to gain a competitive advantage.
The market encompasses a range of advanced technologies designed to connect multiple data centers, ensuring seamless communication and high-performance data transfer. These solutions leverage technologies like dark fiber, wavelength services, and Ethernet to deliver low-latency, high-bandwidth connectivity. Additionally, they incorporate features such as automatic failover, traffic engineering, and network security to ensure business continuity and data protection. Data center interconnect solutions also support various protocols, including MPLS, VPLS, and VXC, enabling efficient and scalable network architectures. Furthermore, they offer flexible bandwidth options, from 1Gbps to 100Gbps, catering to diverse business needs. In summary, the market provides robust, reliable, and agile connectivity solutions for businesses requiring seamless data transfer and communication between multiple data centers.
What are the key market drivers leading to the rise in the adoption of Data Center Interconnect Solutions Industry?
- The escalating need for uninterrupted connectivity serves as the primary catalyst for market growth.
- The market is experiencing significant growth due to the increasing demand for reliable and high-speed connectivity. With the surge in digital transformation and the adoption of cloud services, data center infrastructure has become a critical component for businesses. Service level agreements (SLAs) are becoming increasingly important to ensure network performance, and network latency is a major concern for organizations. To address this, solutions such as 100 gigabit ethernet, software-defined networking (SDN), and network optimization are gaining popularity. Data center consolidation is another trend driving market growth, as businesses seek to reduce power consumption and improve security. Hybrid cloud deployments are also on the rise, necessitating interconnect solutions for seamless data transfer between public and private clouds.
- Network management and security are key considerations, with wavelength division multiplexing (WDM) emerging as a solution for enhancing network capacity and security. Overall, the market is expected to continue its growth trajectory, driven by the need for efficient, secure, and high-performance connectivity solutions.
What are the market trends shaping the Data Center Interconnect Solutions Industry?
- Software-defined interconnection is an emerging market trend. This technology enables dynamic and flexible network connections, making it a valuable investment for businesses seeking agility and efficiency in their communication infrastructure.
- Data center interconnect solutions are essential for enterprises as they navigate the increasing adoption of public, private, and hybrid cloud environments. The growing preference for cloud services from hyperscalers like AWS, Microsoft, and Google is driven by the need to reduce on-premises data center operational expenses. The combination of private and public clouds offers flexibility in scaling capacity. Moreover, the trend towards multi-cloud environments to avoid company lock-in adds complexity to data center interconnection. Industries such as content and digital media, and telecommunications require significant network bandwidth. Artificial intelligence, machine learning, big data analytics, and deep learning are increasingly important across industries, driving the need for advanced data center interconnect solutions.
- Deployment models, including wireless backhaul and network virtualization, are critical in addressing the challenges of interconnecting data centers. Network function virtualization, virtual private network, cloud connectivity, edge computing, and proprietary solutions are key technologies shaping the market. Fiber channel and optical transceivers are essential components in delivering high-speed, reliable interconnectivity. Enterprises require interconnect solutions that are harmonious, immersive, and emphasize performance and security. Recent research indicates that understanding these trends and adopting innovative interconnect solutions will be crucial for businesses to remain competitive. The future will see increased focus on automation, orchestration, and intelligence in data center interconnect solutions.
What challenges does the Data Center Interconnect Solutions Industry face during its growth?
- The need for enhancing bandwidth capacity represents a significant challenge that can hinder industry growth. This requirement for expanded data transfer capabilities is a critical issue that must be addressed to ensure continued progress and success within the industry.
- The market is experiencing significant growth due to the increasing adoption of cloud services by businesses. Enterprises are turning to cloud offerings, including infrastructure as a service (IaaS) and software as a service (SaaS), which necessitates high-bandwidth interconnect solutions for centralized data centers. These interconnections are essential for applications such as disaster recovery, which can be complex due to multiple connections. Technological advancements, like AI and ML, enable enterprises to analyze vast amounts of data efficiently. Energy efficiency is a critical factor in data center operations, and interconnect solutions must meet this requirement. Network monitoring, security, capacity planning, and network slicing are other essential aspects of data center interconnect solutions.
- Coherent optics, such as 400 and 800 gigabit ethernet, play a significant role in providing high-speed interconnectivity. Optical amplifiers are also crucial components for long-haul data center interconnects. Network slicing allows for the allocation of network resources to various applications, ensuring optimal performance and efficiency. Overall, the market for data center interconnect solutions is dynamic, driven by the evolving needs of businesses and the ongoing technological advancements.
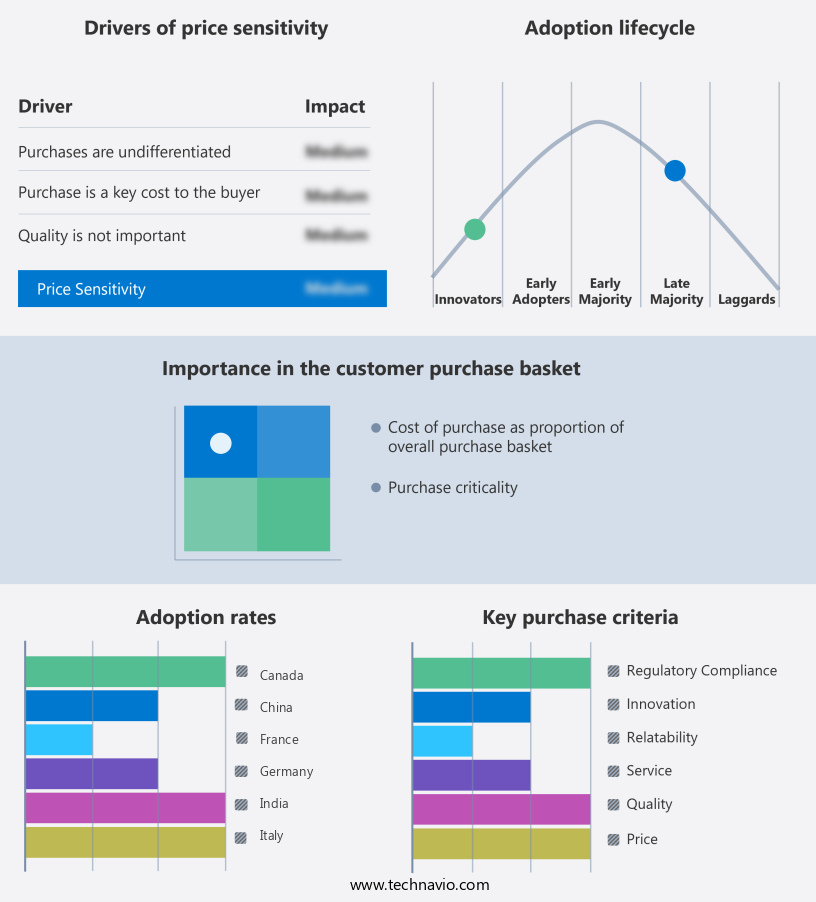
Exclusive Customer Landscape
The data center interconnect solutions market forecasting report includes the adoption lifecycle of the market, covering from the innovator’s stage to the laggard’s stage. It focuses on adoption rates in different regions based on penetration. Furthermore, the data center interconnect solutions market report also includes key purchase criteria and drivers of price sensitivity to help companies evaluate and develop their market growth analysis strategies.
Customer Landscape
Key Companies & Market Insights
Companies are implementing various strategies, such as strategic alliances, data center interconnect solutions market forecast, partnerships, mergers and acquisitions, geographical expansion, and product/service launches, to enhance their presence in the industry.
ADVA Optical Networking SE - Specializing in data center interconnectivity, we provide innovative solutions, including FSP 3000 OLS. Our offerings enhance network connectivity and performance, ensuring uninterrupted data transfer and low latency. By leveraging advanced technologies, we deliver reliable, scalable, and secure interconnect solutions.
The industry research and growth report includes detailed analyses of the competitive landscape of the market and information about key companies, including:
- ADVA Optical Networking SE
- Ciena Corp.
- Cisco Systems Inc.
- Cologix Inc.
- Colt Technology Services Group Ltd.
- CoreSite Realty Corp.
- Corning Inc.
- CyrusOne LLC
- Digital Realty Trust Inc.
- Equinix Inc.
- Extreme Networks Inc.
- Fujitsu Ltd.
- Huawei Technologies Co. Ltd.
- Juniper Networks Inc.
- Megaport Ltd.
- Nokia Corp.
- Nippon Telegraph and Telephone Corp.
- Reichle and DeMassari AG
- Viavi Solutions Inc.
Qualitative and quantitative analysis of companies has been conducted to help clients understand the wider business environment as well as the strengths and weaknesses of key industry players. Data is qualitatively analyzed to categorize companies as pure play, category-focused, industry-focused, and diversified; it is quantitatively analyzed to categorize companies as dominant, leading, strong, tentative, and weak.
Recent Development and News in Data Center Interconnect Solutions Market
- In January 2024, Cisco Systems announced the launch of its new NCS 5500 Series Router, designed specifically for data center interconnect applications. This high-performance router aims to address the increasing bandwidth demands in data center environments (Cisco Press Release).
- In March 2024, Juniper Networks and Arista Networks entered into a strategic partnership to jointly develop and deliver solutions that combine Juniper's Contrail Networking software and Arista's switching technology, enhancing their offerings in the data center interconnect market (Juniper Networks Press Release).
- In May 2024, Infinera, a leading provider of optical transport solutions, secured a USD100 million investment from Koch Industries to accelerate the development and deployment of its ICE6 photonic integrated circuit technology, which promises significant improvements in data center interconnect capacity and efficiency (Infinera Press Release).
- In January 2025, Google Cloud announced the expansion of its global network, adding new data center interconnect points in the United States, Europe, and Asia Pacific regions. This expansion aims to reduce latency and improve connectivity for Google Cloud customers (Google Cloud Blog).
Research Analyst Overview
- The Data Center Interconnect (DCI) solutions market is experiencing significant growth, driven by the increasing demand for high-speed, secure, and efficient connectivity between data centers. Optical fiber plays a crucial role in DCI, providing the necessary bandwidth for data transfer. Network security companies are integrating advanced security features into their offerings, addressing the growing concern for data protection. Telecom operators and cloud providers are investing in capacity planning tools and best practices to optimize their network infrastructure and ensure a good return on investment. Service level management and problem management are essential for maintaining high network availability and performance.
- Content delivery networks and application delivery controllers enhance user experience and application performance. Security management, including intrusion detection systems and network virtualization platforms, is a critical aspect of DCI. Network management software, configuration management, and incident management tools enable efficient and automated network operations. Consulting firms and system integrators provide valuable expertise in implementing and optimizing DCI solutions. Operational expenditure and capital expenditure are key considerations for businesses, with network automation tools and predictive analytics helping to reduce operational costs and improve network performance. Business continuity and disaster recovery are essential for ensuring uninterrupted services. Big data analytics and AI-driven network management provide valuable insights for network optimization and capacity planning.
- Network monitoring tools and routing equipment are essential components of DCI, enabling real-time network performance metrics and traffic analysis. Switching equipment and load balancers distribute network traffic efficiently and ensure high availability. Change management processes are crucial for implementing network modifications without disrupting services. Overall, the DCI solutions market is dynamic and evolving, with a focus on security, efficiency, and performance. Network operators and businesses must stay informed of the latest trends and best practices to optimize their network infrastructure and achieve their business objectives.
Dive into Technavio’s robust research methodology, blending expert interviews, extensive data synthesis, and validated models for unparalleled Data Center Interconnect Solutions Market insights. See full methodology.
|
Market Scope |
|
|
Report Coverage |
Details |
|
Page number |
180 |
|
Base year |
2024 |
|
Historic period |
2019-2023 |
|
Forecast period |
2025-2029 |
|
Growth momentum & CAGR |
Accelerate at a CAGR of 22.5% |
|
Market growth 2025-2029 |
USD 15953.8 million |
|
Market structure |
Fragmented |
|
YoY growth 2024-2025(%) |
18.1 |
|
Key countries |
US, China, Canada, India, Germany, UK, Japan, France, Brazil, and South Korea |
|
Competitive landscape |
Leading Companies, Market Positioning of Companies, Competitive Strategies, and Industry Risks |
What are the Key Data Covered in this Data Center Interconnect Solutions Market Research and Growth Report?
- CAGR of the Data Center Interconnect Solutions industry during the forecast period
- Detailed information on factors that will drive the growth and forecasting between 2025 and 2029
- Precise estimation of the size of the market and its contribution of the industry in focus to the parent market
- Accurate predictions about upcoming growth and trends and changes in consumer behaviour
- Growth of the market across North America, APAC, Europe, South America, and Middle East and Africa
- Thorough analysis of the market’s competitive landscape and detailed information about companies
- Comprehensive analysis of factors that will challenge the data center interconnect solutions market growth of industry companies
We can help! Our analysts can customize this data center interconnect solutions market research report to meet your requirements.
 RIA -
RIA - 
