
UK Foodservice Market Size 2025-2029
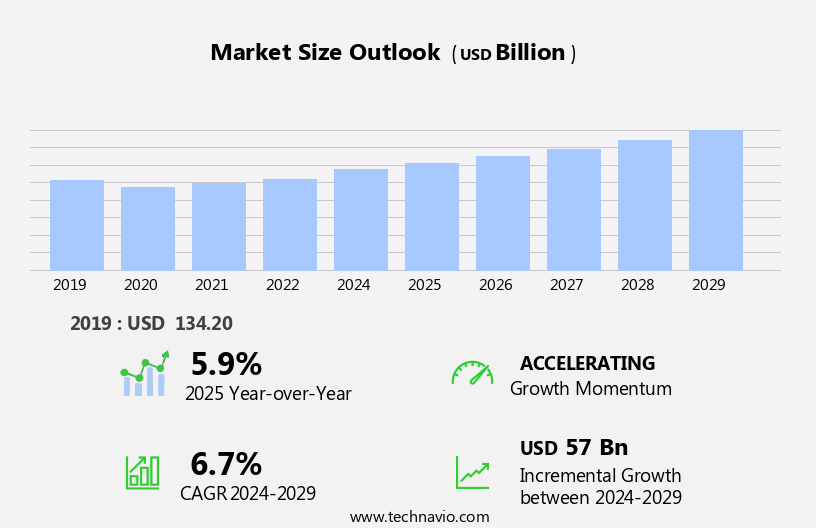
The UK foodservice market size is forecast to increase by USD 57 billion at a CAGR of 6.7% between 2024 and 2029.
- Foodservice market is experiencing significant shifts, driven by the increasing popularity of food delivery apps and online ordering platforms. This digital transformation is revolutionizing the way consumers interact with foodservice providers, leading to increased convenience and flexibility. However, regulatory hurdles impact adoption, as stringent food safety regulations and complex licensing requirements pose challenges for new entrants. Additionally, labor shortages in the foodservice sector are tempering growth potential, as operators struggle to find and retain skilled workers. Virtual restaurants and ghost kitchens are gaining traction as potential solutions to labor challenges, enabling businesses to operate with reduced overheads and increased efficiency. The foodservice market encompasses a diverse range of establishments, including cafes, bars, cloud kitchens, full service restaurants, quick service restaurants, chained outlets, independent outlets, and various mobile food services such as food trucks and fast-food chains.
- These trends present both opportunities and challenges for market participants. Companies that can effectively navigate regulatory requirements and adapt to changing consumer preferences will be well-positioned to capitalize on the market's growth potential. Meanwhile, addressing labor shortages through innovative operational models and investing in technology will be crucial for long-term success.
What will be the size of the UK Foodservice Market during the forecast period?
- The foodservice industry continues to evolve, with a focus on data-driven insights from foodservice analytics shaping business decisions. Industry standards prioritize sustainable practices, as reflected in the latest foodservice trends report. Innovation in foodservice is evident in the adoption of kitchen automation and smart kitchen technology. Foodservice consulting firms help businesses optimize operations through food safety certifications and efficient foodservice business models. Restaurant management technology adoption is transforming the industry, from customer loyalty programs to restaurant design trends. Foodservice distribution and equipment leasing companies are integrating technology to streamline supply chain management. Foodservice equipment maintenance is also becoming more efficient with the integration of IoT sensors and predictive analytics. Moreover, the cloud kitchen concept is emerging as a significant trend, enabling foodservice providers to operate without a physical storefront, reducing overhead costs and increasing operational efficiency.
How is this market segmented?
The market research report provides comprehensive data (region-wise segment analysis), with forecasts and estimates in "USD billion" for the period 2025-2029, as well as historical data from 2019-2023 for the following segments. {{segments_for_ai.nslist}
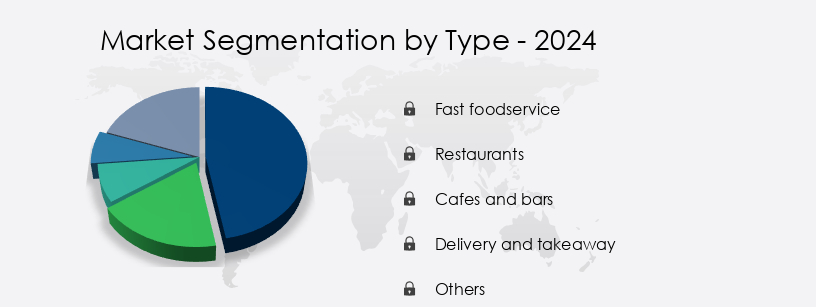
By Type Insights
The fast foodservice segment is estimated to witness significant growth during the forecast period. The foodservice market in the US is characterized by various trends and dynamics shaping the industry. Off-premise catering continues to gain traction as customers seek convenience and flexibility. Customer feedback is increasingly important for foodservice operators, influencing menu offerings and improving customer experience. Ingredient sourcing, with a focus on local and organic options, is a growing concern for both casual dining establishments and fine dining restaurants. Cloud kitchens and ghost kitchens are emerging business models, optimizing workflow and reducing overhead costs. Food trends, such as healthy eating and dietary restrictions, are driving innovation in meal kits and menu offerings. The increasing number of full-service restaurants and the popularity of online catering services are additional growth factors.
Catering equipment and commercial kitchen equipment are essential investments for foodservice operators, while staff training and food cost control remain critical areas of focus. Cloud-based solutions, including employee scheduling and inventory management software, are streamlining operations and enhancing operational efficiency. Customer satisfaction is a top priority, with digital menu boards and table management systems contributing to an enhanced dining experience. Foodservice design, from kitchen layout to restaurant technology, is evolving to accommodate these trends. Food allergies and food waste reduction are key concerns, with table management systems and delivery services addressing these issues. Sustainability initiatives and brand loyalty programs are becoming increasingly important in the hospitality industry. Community outreach programs and e-commerce channels further enhance the market's reach and accessibility.
Get a glance at the market share of various segments Request Free Sample
The Fast foodservice segment was valued at USD 55.50 billion in 2019 and showed a gradual increase during the forecast period. Foodservice automation, including robotics and labor management, is transforming the industry, while foodservice industry associations provide valuable resources and networking opportunities. Mobile ordering and online ordering platforms are changing the way customers interact with foodservice establishments, with data analytics and social media marketing enabling targeted marketing and personalized customer experiences. Delivery services, such as third-party platforms and in-house delivery, are expanding the reach of foodservice businesses. In the fast casual segment, operational efficiency and revenue management are crucial, with foodservice operators leveraging digital marketing and foodservice automation to optimize their businesses. Fine dining establishments, on the other hand, prioritize customer experience and staff training, with a focus on organic food and gluten-free options. The foodservice market in the US is a dynamic and evolving industry, with trends and innovations shaping the way food is prepared, served, and consumed. From off-premise catering to food delivery platforms, the industry is adapting to meet the changing needs and preferences of consumers. Foodservice operators must stay informed and adapt to these trends to remain competitive and thrive in this ever-changing landscape.
Market Dynamics
Our researchers analyzed the data with 2024 as the base year, along with the key drivers, trends, and challenges. A holistic analysis of drivers will help companies refine their marketing strategies to gain a competitive advantage.
What are the key market drivers leading to the rise in the adoption of Foodservice in UK Industry?
- The increase in popularity of food delivery apps and online ordering platforms is the primary catalyst fueling market growth in this sector. The foodservice industry is experiencing significant growth as a result of the increasing popularity of off-premise dining options, such as catering and food delivery. Customer feedback plays a crucial role in the success of foodservice operators, driving the need for high-quality ingredients and excellent customer experience. Catering equipment and commercial kitchen equipment are essential investments for businesses offering off-premise dining services. Food trends, including meal kits and cloud kitchens, are transforming the industry, enabling operators to optimize workflows and reduce costs. Ingredient sourcing has become a priority for many businesses, with a focus on sustainability and ethical practices.
- Customer experience is also a key differentiator, with operators leveraging technology to streamline ordering and delivery processes. Foodservice operators are adapting to these trends by investing in kitchen layouts that support both dine-in and takeout services. Meal kits and cloud kitchens offer new revenue streams and increased operational efficiency. By focusing on customer experience, ingredient sourcing, and workflow optimization, foodservice operators can stay competitive in today's dynamic market.
What are the market trends shaping the Foodservice in UK Industry?
- Virtual restaurants and ghost kitchens are emerging as the latest market trend. These concepts, which involve delivering food directly to customers without traditional dine-in options, are gaining significant traction in the food industry. Virtual restaurants and ghost kitchens have emerged as innovative business models in the foodservice industry, eliminating the need for traditional brick-and-mortar dining spaces. This setup significantly reduces overhead costs, including rent or property ownership, dining area maintenance, and front-of-house staff hiring. The growing popularity of food delivery apps and online ordering platforms has fueled a in demand for delivery and takeaway options. Virtual restaurants and ghost kitchens cater exclusively to this trend, focusing solely on preparing food for off-premises consumption. These business models offer entrepreneurial opportunities for chefs, restaurateurs, and food entrepreneurs. The lower barriers to entry compared to traditional restaurants enable individuals to launch new food concepts through virtual kitchens and brands more easily, capitalizing on the increasing demand for delivery-only options.
- Food cost control is crucial for virtual restaurants and ghost kitchens, as they operate primarily in a delivery-focused environment. Cloud-based solutions for inventory management and employee scheduling help streamline operations and optimize costs. Additionally, accommodating dietary restrictions and promoting healthy eating options can differentiate these businesses and attract a wider customer base. Robotics in foodservice and advanced foodservice equipment have become essential for maintaining efficiency and quality in the kitchen. Digital marketing and partnerships with food delivery platforms are also vital for increasing revenue and reaching a larger audience. Effective revenue management strategies, such as dynamic pricing and targeted promotions, can help maximize profits and maintain a competitive edge.
What challenges does the Foodservice in UK Industry face during its growth?
- The foodservice industry faces significant growth impediments due to acute labor shortages within the sector. The foodservice market in the hospitality industry is experiencing significant changes due to the adoption of automation and technology. This trend is particularly noticeable in the areas of foodservice design, inventory management, and labor management. Organic food and gluten-free options have become increasingly popular, leading to a greater focus on operational efficiency and customer satisfaction. Digital menu boards and restaurant technology are becoming more common, enabling faster and more accurate order processing. Inventory management software is helping to reduce food waste and improve stock control. Brand loyalty is a key driver of growth in the foodservice market, and technology is playing a crucial role in enhancing the customer experience.
- Fine dining establishments are also embracing technology, with some offering self-service kiosks and mobile ordering apps. Labor management is a significant challenge for the foodservice industry, with many businesses struggling to find enough staff due to low wages and limited benefits. This trend is expected to continue, making it essential for foodservice operators to explore ways to increase operational efficiency and reduce labor costs. The foodservice market is undergoing significant transformation, driven by the adoption of automation and technology. Organic food, gluten-free options, and customer satisfaction remain key priorities, while operational efficiency and labor management are critical challenges. Digital menu boards, inventory management software, and brand loyalty are key areas of focus for foodservice operators looking to stay competitive.
Exclusive Customer Landscape
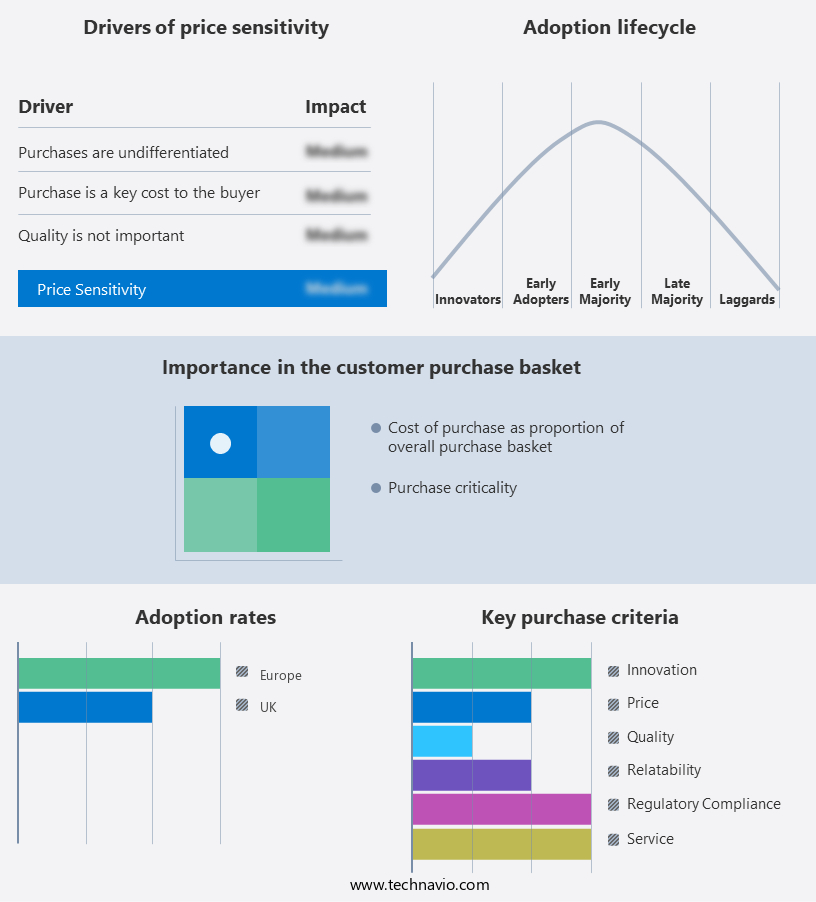
The foodservice market in UK forecasting report includes the adoption lifecycle of the market, covering from the innovator's stage to the laggard's stage. It focuses on adoption rates in different regions based on penetration. Furthermore, the foodservice market in UK report also includes key purchase criteria and drivers of price sensitivity to help companies evaluate and develop their market growth analysis strategies.
Customer Landscape
Key Companies & Market Insights
Companies are implementing various strategies, such as strategic alliances, foodservice market in UK forecast, partnerships, mergers and acquisitions, geographical expansion, and product/service launches, to enhance their presence in the industry.
Bid Corp. Ltd. - The BFS Group Ltd., a subsidiary of the corporation, provides a range of food services.
The industry research and growth report includes detailed analyses of the competitive landscape of the market and information about key companies, including:
- Bid Corp. Ltd.
- BKUK Group Ltd
- Compass Group Plc
- Cooperatie Koninklijke Cosun UA
- Elior Group SA
- Greggs Plc
- Hannah Food Service
- JJ Food Service Ltd.
- JMP Foodservice
- Kitwave Group plc
- McDonald Corp.
- Mitchells and Butlers plc
- MKG Foods
- Nandos Group
- Nestle SA
- PepsiCo Inc.
- PizzaExpress Restaurants Ltd.
- The Coca Cola Co.
- The Restaurant Group PLC
- Whitbread PLC
Qualitative and quantitative analysis of companies has been conducted to help clients understand the wider business environment as well as the strengths and weaknesses of key industry players. Data is qualitatively analyzed to categorize companies as pure play, category-focused, industry-focused, and diversified; it is quantitatively analyzed to categorize companies as dominant, leading, strong, tentative, and weak.
Recent Development and News in Foodservice Market In UK
- In February 2024, McDonald's announced the global rollout of its contactless ordering and mobile payment system, McD App, in collaboration with Mastercard (Reuters, 2024). This strategic partnership aimed to enhance the customer experience and accelerate the recovery of the foodservice industry post-pandemic.
- In August 2024, Starbucks completed the acquisition of a 40% stake in Teavana, a specialty tea retailer, for approximately USD 620 million (Starbucks Corporation, 2024). This strategic move expanded Starbucks' product offerings and catered to the growing demand for specialty tea beverages in the foodservice market.
- In January 2025, Domino's Pizza signed a major partnership with Nuro, a robotics company, to deploy autonomous delivery vehicles for contactless pizza deliveries (Domino's Pizza, 2025). This technological advancement aimed to improve efficiency and safety while catering to the increasing consumer preference for contactless services.
- In March 2025, the European Union passed the Sustainable Foodservice Packaging Regulation, banning single-use plastics in foodservice packaging by 2025 (European Commission, 2021). This regulatory initiative aimed to reduce plastic waste and promote sustainable practices within the foodservice industry.
Research Analyst Overview
The foodservice market continues to evolve, with dynamic trends shaping the industry across various sectors. Customer feedback plays a pivotal role in shaping menu offerings and service standards. Ingredient sourcing, driven by consumer preferences for organic and locally sourced options, influences catering and casual dining establishments alike. Cloud kitchens and off-premise catering are gaining traction, optimizing workflow and reducing operational costs for foodservice operators. Food trends, such as plant-based diets and healthy eating, necessitate staff training and food cost control. Cloud-based solutions, including employee scheduling and inventory management software, streamline operations and enhance customer experience. Dietary restrictions, from gluten-free to food allergies, require catering equipment and commercial kitchen equipment tailored to meet specific needs.
Robotics in foodservice and automation offer labor management solutions, while digital menu boards and online ordering platforms cater to the growing demand for convenience and contactless dining. Revenue management and data analytics enable foodservice operators to optimize pricing and improve brand loyalty. Within the restaurant sector, there are various segments such as full-service restaurants, quick-service restaurants, cafes, and fast food chains. Hospitality industry associations and foodservice design firms contribute to the ongoing innovation in the sector, with fine dining and fast casual restaurants adopting restaurant technology to enhance the customer experience. Health and wellness is another key trend, with consumers increasingly seeking plant-based options like vegan food and specialty beverages. Sustainability initiatives and food waste reduction strategies are increasingly important, with ghost kitchens and delivery services offering solutions to minimize waste and reduce carbon footprint. Social media marketing and delivery services cater to evolving consumer preferences, ensuring the foodservice industry remains at the forefront of innovation.
Dive into Technavio's robust research methodology, blending expert interviews, extensive data synthesis, and validated models for unparalleled Foodservice Market in UK insights. See full methodology.
|
Market Scope |
|
|
Report Coverage |
Details |
|
Page number |
183 |
|
Base year |
2024 |
|
Historic period |
2019-2023 |
|
Forecast period |
2025-2029 |
|
Growth momentum & CAGR |
Accelerate at a CAGR of 6.7% |
|
Market growth 2025-2029 |
USD 57 billion |
|
Market structure |
Fragmented |
|
YoY growth 2024-2025(%) |
5.9 |
|
Key countries |
UK |
|
Competitive landscape |
Leading Companies, Market Positioning of Companies, Competitive Strategies, and Industry Risks |
What are the Key Data Covered in this Foodservice Market in UK Research and Growth Report?
- CAGR of the Foodservice in UK industry during the forecast period
- Detailed information on factors that will drive the growth and forecasting between 2025 and 2029
- Precise estimation of the size of the market and its contribution of the industry in focus to the parent market
- Accurate predictions about upcoming growth and trends and changes in consumer behaviour
- Growth of the market across UK
- Thorough analysis of the market's competitive landscape and detailed information about companies
- Comprehensive analysis of factors that will challenge the foodservice market in UK growth of industry companies
We can help! Our analysts can customize this foodservice market in UK research report to meet your requirements.
 RIA -
RIA - 
