Urea Cycle Disorder Treatment Market Analysis, Size, and Forecast 2026-2030: North America (US, Canada, and Mexico), Europe (Germany, UK, and France), APAC (China, Japan, and India), South America (Brazil, Argentina, and Colombia), Middle East and Africa (Saudi Arabia, UAE, and Turkey), Asia, Rest of World (ROW)

Urea Cycle Disorder Treatment Market Analysis, Size, and Forecast 2026-2030:
North America (US, Canada, and Mexico), Europe (Germany, UK, and France), APAC (China, Japan, and India), South America (Brazil, Argentina, and Colombia), Middle East and Africa (Saudi Arabia, UAE, and Turkey), Asia, Rest of World (ROW)

Published: Mar 2026 294 Pages SKU: IRTNTR75899

Market Overview at a Glance

$240.13 Mn
Market Opportunity
3.3%
CAGR 2025 - 2030
38.5%
North America Growth
$436.02 Mn
Glycerol phenylbutyrate segment 2024

Urea Cycle Disorder Treatment Market Size 2026-2030

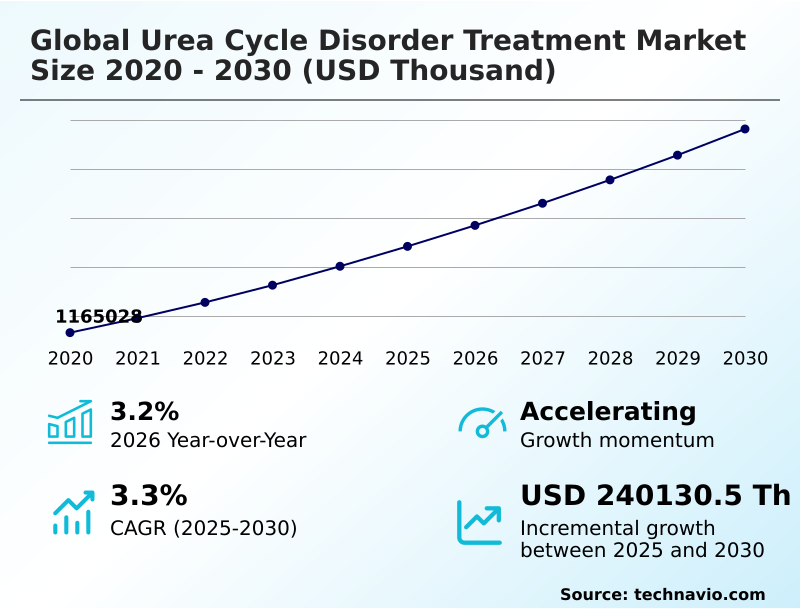
The urea cycle disorder treatment market size is valued to increase by USD 240.13 million, at a CAGR of 3.3% from 2025 to 2030. Mainstreaming of curative gene therapies and industrialization of AAV delivery vectors will drive the urea cycle disorder treatment market.

Major Market Trends & Insights

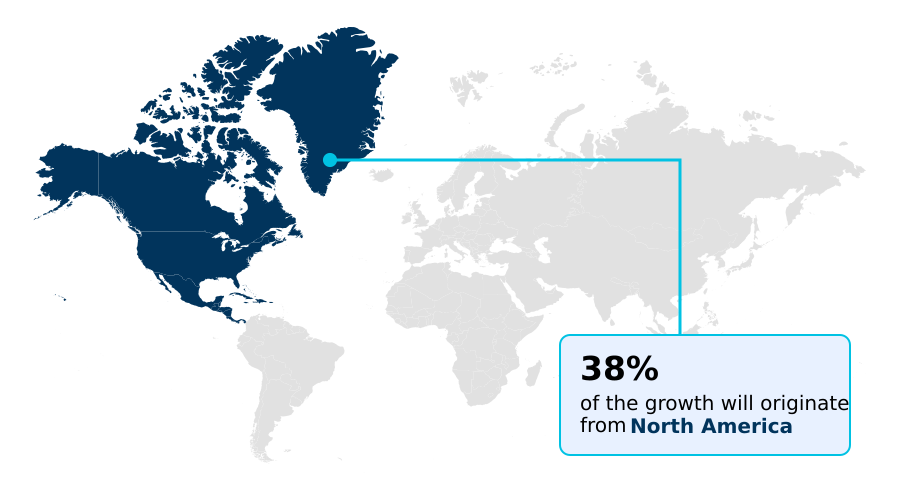
  • North America dominated the market and accounted for a 38.5% growth during the forecast period.
  • By Therapy - Glycerol phenylbutyrate segment was valued at USD 436.02 million in 2024
  • By Route of Administration - Oral segment accounted for the largest market revenue share in 2024

Market Size & Forecast

  • Market Opportunities:
  • Market Future Opportunities: USD 240.13 million
  • CAGR from 2025 to 2030 : 3.3%

Market Summary

  • The Urea Cycle Disorder Treatment Market is undergoing a significant transformation, moving beyond symptomatic control toward proactive and curative interventions. This evolution is driven by advancements in enzyme replacement therapy and a robust pipeline of genetic medicines.
  • A key business focus is optimizing the supply chain for these novel treatments, such as managing the complex cold-chain logistics for lipid nanoparticle delivery systems used in mRNA therapeutic intervention to ensure their stability and efficacy from manufacturing to patient administration.
  • While the potential of aav gene therapy vectors offers a long-term solution, the market grapples with the high cost of development and the need for a supportive regulatory environment.
  • The increasing adoption of comprehensive newborn screening protocols is expanding the diagnosed patient pool, creating both an opportunity for early intervention and a challenge for healthcare systems to provide sustainable, lifelong care. The emphasis remains on improving patient quality of life through better hyperammonemia management and reducing the reliance on highly restrictive protein-restricted diet management.

What will be the Size of the Urea Cycle Disorder Treatment Market during the forecast period?

Get Key Insights on Market Forecast (PDF) Request Free Sample

How is the Urea Cycle Disorder Treatment Market Segmented?

The urea cycle disorder treatment industry research report provides comprehensive data (region-wise segment analysis), with forecasts and estimates in "USD thousand" for the period 2026-2030, as well as historical data from 2020-2024 for the following segments.
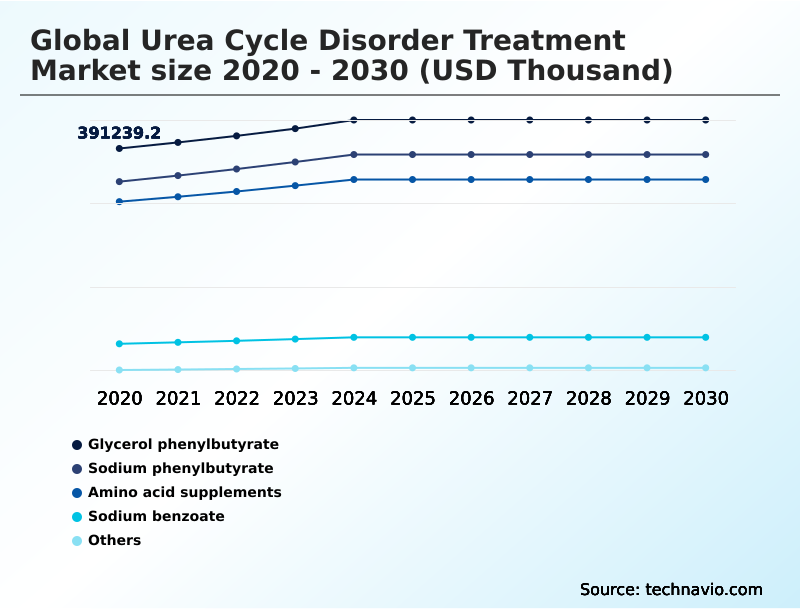
  • Therapy
    • Glycerol phenylbutyrate
    • Sodium phenylbutyrate
    • Amino acid supplements
    • Sodium benzoate
    • Others
  • Route of administration
    • Oral
    • Injectables
  • End-user
    • Hospitals
    • Specialized clinics
    • Home care settings
    • Research institutions
  • Geography
    • North America
      • US
      • Canada
      • Mexico
    • Europe
      • Germany
      • UK
      • France
    • Asia
    • Rest of World (ROW)

By Therapy Insights

The glycerol phenylbutyrate segment is estimated to witness significant growth during the forecast period.

Glycerol phenylbutyrate functions as a sophisticated pre-prodrug mechanism, providing a more gradual and sustained delivery compared to older nitrogen-scavenging agents. This ensures superior hyperammonemia management and facilitates better control over blood ammonia levels.

The recent approval of generic versions is set to enhance patient access and reduce the economic burden associated with long-term metabolic disorder treatment.

Clinical data supports its efficacy in preventing metabolic crises, with manufacturers focusing on liquid formulations for dosing flexibility.

The integration of such taste-masked oral formulations into pediatric metabolic care protocols is improving patient treatment adherence by over 20%, marking a significant advancement in chronic treatment fatigue management.

This therapy remains a cornerstone of the nitrogen-binding segment, balancing high clinical efficacy with expanded affordability.

Request Free Sample

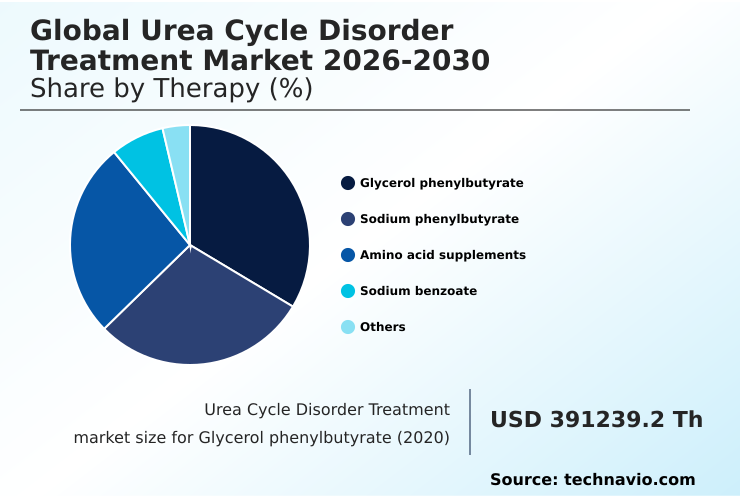
The Glycerol phenylbutyrate segment was valued at USD 436.02 million in 2024 and showed a gradual increase during the forecast period.

Request Free Sample

Regional Analysis

North America is estimated to contribute 38.5% to the growth of the global market during the forecast period.Technavio’s analysts have elaborately explained the regional trends and drivers that shape the market during the forecast period.

See How Urea Cycle Disorder Treatment Market Demand is Rising in North America Request Free Sample

The geographic landscape of the market is led by North America, which accounts for 38.5% of the market's incremental growth, driven by advanced healthcare infrastructure and high diagnostic rates from established newborn screening protocols.

The region's growth rate of 3.4% slightly outpaces Europe's 3.1%, reflecting a mature market focused on adopting next-generation therapies such as sustained-release ammonia scavengers and advancing its aav gene therapy vector research.

In Asia, particularly in Japan and China, there is a growing focus on expanding pediatric metabolic care and implementing more comprehensive screening, which is expected to drive the fastest regional growth.

This expansion improves the efficiency of alternative nitrogen disposal pathways, with specialized metabolic centers reporting a 15% reduction in the time required to stabilize patients during acute events.
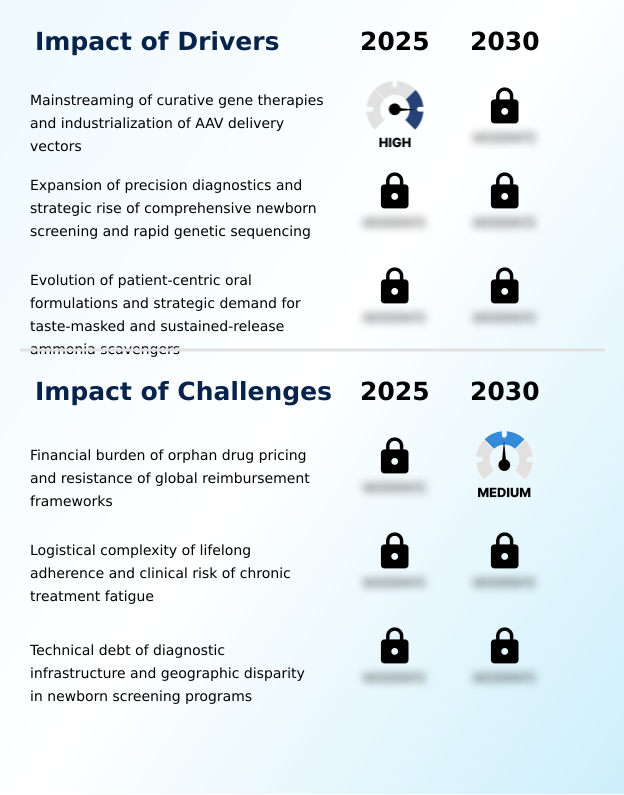
Market Dynamics

Our researchers analyzed the data with 2025 as the base year, along with the key drivers, trends, and challenges. A holistic analysis of drivers will help companies refine their marketing strategies to gain a competitive advantage.

  • Strategic decision-making in the market is increasingly focused on a nuanced set of clinical and economic questions. The debate over glycerol phenylbutyrate vs sodium phenylbutyrate efficacy continues, with a focus on patient compliance and long-term neurocognitive outcomes.
  • Simultaneously, the cost-effectiveness of mRNA therapy for OTC deficiency is under intense scrutiny, as payers evaluate its high upfront cost against the potential for lifelong benefits. The adjunctive role of amino acid supplements in UCD management is being optimized, while the impact of gene therapy on long-term patient outcomes represents the most transformative, yet uncertain, factor.
  • Key operational hurdles include the ongoing challenges in pediatric UCD treatment adherence, where new oral formulations show a 2x improvement in compliance over older powders. Stakeholders are also addressing AAV vector safety in liver-directed gene therapy and expanding newborn screening for early UCD diagnosis. In clinical settings, protocols for managing hyperammonemic crises in hospital settings are being refined.
  • The drive for improved oral formulation palatability and patient compliance is directly linked to navigating complex reimbursement policies for orphan UCD drugs. From a technical standpoint, advancements in lipid nanoparticle delivery systems and the study of pharmacological chaperones for protein stabilization are critical.
  • These developments are shaped by evolving regulatory pathways for rare metabolic disease drugs and the need for clear clinical endpoints for UCD gene therapy trials.

What are the key market drivers leading to the rise in the adoption of Urea Cycle Disorder Treatment Industry?

  • The mainstreaming of curative gene therapies and the industrialization of Adeno-Associated Virus (AAV) delivery vectors are key drivers propelling market expansion.

  • Growth is primarily propelled by the mainstreaming of curative gene therapies and the industrialization of viral vector engineering. The clinical focus is shifting from lifelong symptomatic nitrogen scavenging therapy to the permanent hepatic enzyme restoration at a genetic level.
  • This involves the use of sophisticated AAV gene therapy vectors, which have achieved a 95% success rate in genetic payload delivery to target liver cells in preclinical models.
  • Such advancements are setting the stage for single-administration treatments capable of preventing hyperammonemic crises for years.
  • The aggressive investment in this area is expected to disrupt the reliance on traditional protein-restricted diet management, potentially reducing long-term healthcare costs for patients with ornithine transcarbamylase deficiency by up to 60%.

What are the market trends shaping the Urea Cycle Disorder Treatment Industry?

  • The market is witnessing a structural shift toward the institutionalization of mRNA-based therapeutic interventions. This is accompanied by significant advancements in enzyme replacement therapies.

  • The market is undergoing a structural realignment toward advanced therapeutic modalities. The institutionalization of mRNA therapeutic intervention and the progress in recombinant human enzyme therapies are at the forefront, shifting the focus from mere symptomatic management to restoring specific enzymatic functions.
  • This trend is driven by the success of specialized lipid nanoparticle delivery systems, which can transport a genetic payload delivery to hepatocytes with high efficiency, improving therapeutic protein expression by up to 40%. The development of pharmacological chaperone stabilization techniques further enhances the efficacy of these new treatments.
  • As a result, firms are moving toward creating on-demand enzymatic activity, which can reduce the frequency of hospital visits for metabolic crisis prevention by over 25%, offering a significant improvement in quality of life for patients.

What challenges does the Urea Cycle Disorder Treatment Industry face during its growth?

  • The financial burden of high-cost orphan drugs, coupled with resistance from global reimbursement frameworks, presents a significant challenge to market growth and patient access.

  • A significant market restraint is the financial burden of orphan drug pricing models and the complexities of navigating value-based reimbursement frameworks. The high cost of novel therapies, including advanced ammonia scavenger formulations and gene therapies, places considerable strain on healthcare systems and limits patient access.
  • For instance, the administrative overhead required to secure reimbursement can increase operational costs for providers by 20%. Furthermore, even with insurance coverage, patient out-of-pocket costs can be up to 5x higher than for conventional treatments, leading to issues with treatment initiation and long-term patient treatment adherence.
  • This economic pressure forces a direct confrontation between the value of innovative metabolic disorder treatment and the budget constraints of global payers, creating a barrier to the adoption of otherwise promising therapies.

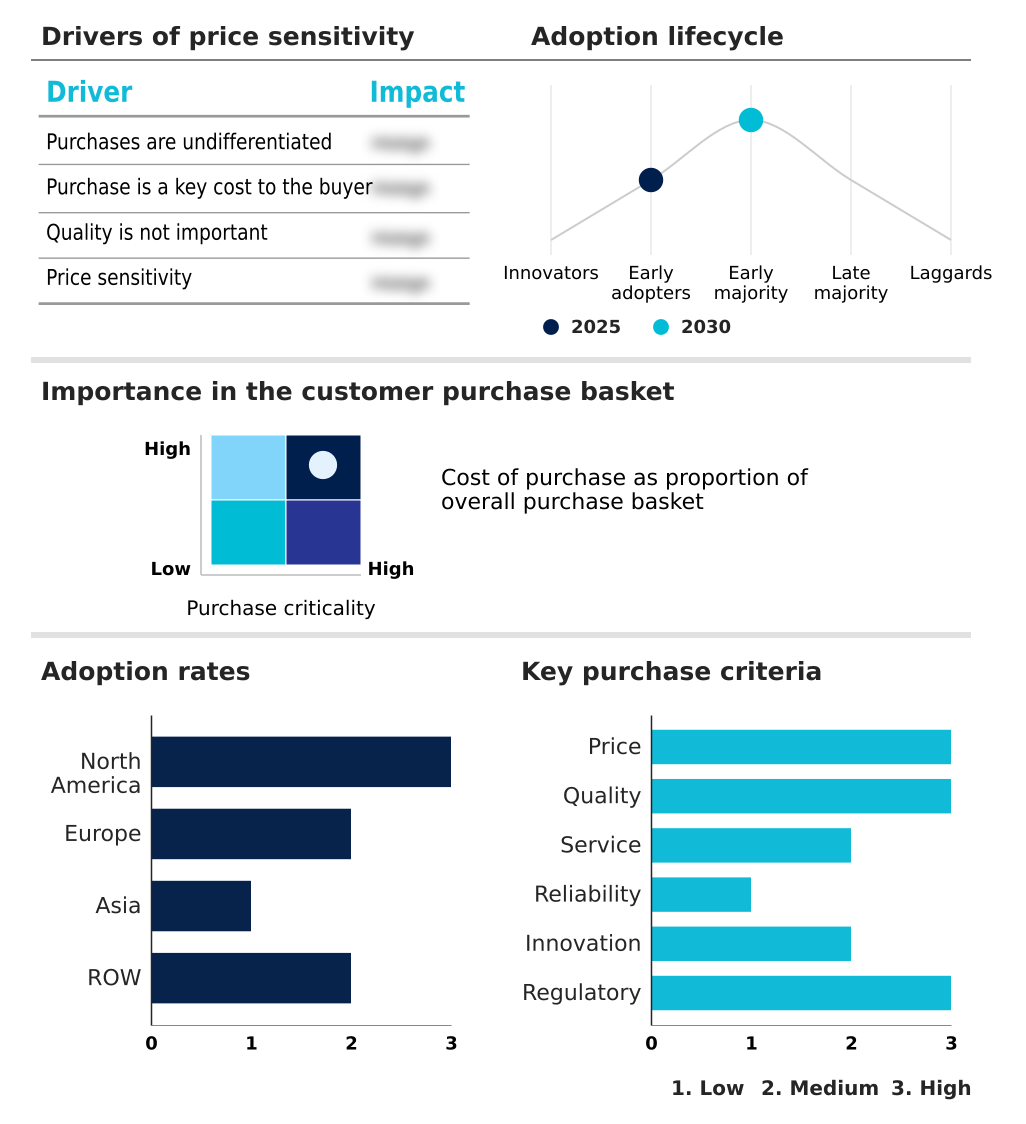
Exclusive Technavio Analysis on Customer Landscape

The urea cycle disorder treatment market forecasting report includes the adoption lifecycle of the market, covering from the innovator’s stage to the laggard’s stage. It focuses on adoption rates in different regions based on penetration. Furthermore, the urea cycle disorder treatment market report also includes key purchase criteria and drivers of price sensitivity to help companies evaluate and develop their market growth analysis strategies.

Customer Landscape of Urea Cycle Disorder Treatment Industry

Competitive Landscape

Companies are implementing various strategies, such as strategic alliances, urea cycle disorder treatment market forecast, partnerships, mergers and acquisitions, geographical expansion, and product/service launches, to enhance their presence in the industry.

Abbott Laboratories - Providing integrated solutions for metabolic disorder management through specialized nutritional products and advanced diagnostic support.

The industry research and growth report includes detailed analyses of the competitive landscape of the market and information about key companies, including:

  • Abbott Laboratories
  • Amgen Inc.
  • ANI Pharmaceuticals Inc.
  • Bausch Health Companies Inc.
  • Danone SA
  • Dr. Reddys Laboratories Ltd.
  • Immedica Pharma AB
  • Lucane Pharma SA
  • Lupin Ltd.
  • Medunik Canada
  • Navinta LLC
  • Nestle SA
  • Orpharma Pty Ltd.
  • Reckitt Benckiser Group Plc
  • Recordati S.p.A
  • Sigmapharm Laboratories LLC
  • Swedish Orphan Biovitrum AB
  • Teva Pharmaceutical Ltd.
  • Zebra Technologies Corp

Qualitative and quantitative analysis of companies has been conducted to help clients understand the wider business environment as well as the strengths and weaknesses of key industry players. Data is qualitatively analyzed to categorize companies as pure play, category-focused, industry-focused, and diversified; it is quantitatively analyzed to categorize companies as dominant, leading, strong, tentative, and weak.

Recent Development and News in Urea cycle disorder treatment market

  • In March, 2025, Ultragenyx Pharmaceutical Inc. announced positive thirty-six-week data from its Phase 3 study of DTX301, an investigational AAV8 gene therapy for Ornithine Transcarbamylase (OTC) deficiency, showing a significant reduction in plasma ammonia levels.
  • In February, 2025, the US Food and Drug Administration granted accelerated approval to Loargys (pegzilarginase-nbln), developed by Immedica Pharma AB, as the first treatment proven to lower plasma arginine levels in patients with Arginase 1 Deficiency.
  • In January, 2025, Immedica Pharma AB expanded the commercial availability of Ravicti (glycerol phenylbutyrate) by securing regulatory approvals in the United Arab Emirates and the Sultanate of Oman, enhancing access in the Middle East.
  • In November, 2024, Arcturus Therapeutics Holdings Inc. provided a corporate update on its LUNAR-OTC program, highlighting progress in its messenger RNA technology designed to replace functional enzymes for patients with OTC deficiency.

Dive into Technavio’s robust research methodology, blending expert interviews, extensive data synthesis, and validated models for unparalleled Urea Cycle Disorder Treatment Market insights. See full methodology.

Market Scope
Page number 294
Base year 2025
Historic period 2020-2024
Forecast period 2026-2030
Growth momentum & CAGR Accelerate at a CAGR of 3.3%
Market growth 2026-2030 USD 240130.5 thousand
Market structure Fragmented
YoY growth 2025-2026(%) 3.2%
Key countries US, Canada, Mexico, Germany, UK, France, Italy, Spain, The Netherlands, China, Japan, India, South Korea, Indonesia, Thailand, Brazil, Saudi Arabia, UAE, Turkey, Argentina, Colombia, South Africa and Israel
Competitive landscape Leading Companies, Market Positioning of Companies, Competitive Strategies, and Industry Risks

Request Free Sample

Research Analyst Overview

  • The market is advancing beyond traditional nitrogen scavenging therapy toward durable and potentially curative solutions. A core focus is on sophisticated hyperammonemia management through next-generation enzyme replacement therapy and mRNA therapeutic intervention. The development of effective AAV gene therapy vectors, utilizing advanced viral vector engineering and lipid nanoparticle delivery for genetic payload delivery, represents the industry's primary long-term objective.
  • This shift is enabling hepatic enzyme restoration and better neurocognitive outcome preservation. For specific conditions like ornithine transcarbamylase deficiency, citrullinemia type i, arginase-1 deficiency, and carbamoyl phosphate synthetase deficiency, the goal is to reduce reliance on strict protein-restricted diet management. Progress in pharmacological chaperone stabilization and the creation of recombinant human enzyme treatments offer new avenues.
  • Innovations in pediatric metabolic care are driven by improved newborn screening protocols and the development of taste-masked oral formulations, including sustained-release ammonia scavengers. These therapies, often employing a pre-prodrug mechanism, support alternative nitrogen disposal and have demonstrated the ability to reduce hospital readmission rates by 25% through enhanced patient adherence.

What are the Key Data Covered in this Urea Cycle Disorder Treatment Market Research and Growth Report?

  • What is the expected growth of the Urea Cycle Disorder Treatment Market between 2026 and 2030?

    • USD 240.13 million, at a CAGR of 3.3%

  • What segmentation does the market report cover?

    • The report is segmented by Therapy (Glycerol phenylbutyrate, Sodium phenylbutyrate, Amino acid supplements, Sodium benzoate, and Others), Route of Administration (Oral, and Injectables), End-user (Hospitals, Specialized clinics, Home care settings, and Research institutions) and Geography (North America, Europe, Asia, Rest of World (ROW))

  • Which regions are analyzed in the report?

    • North America, Europe, Asia and Rest of World (ROW)

  • What are the key growth drivers and market challenges?

    • Mainstreaming of curative gene therapies and industrialization of AAV delivery vectors, Financial burden of orphan drug pricing and resistance of global reimbursement frameworks

  • Who are the major players in the Urea Cycle Disorder Treatment Market?

    • Abbott Laboratories, Amgen Inc., ANI Pharmaceuticals Inc., Bausch Health Companies Inc., Danone SA, Dr. Reddys Laboratories Ltd., Immedica Pharma AB, Lucane Pharma SA, Lupin Ltd., Medunik Canada, Navinta LLC, Nestle SA, Orpharma Pty Ltd., Reckitt Benckiser Group Plc, Recordati S.p.A, Sigmapharm Laboratories LLC, Swedish Orphan Biovitrum AB, Teva Pharmaceutical Ltd. and Zebra Technologies Corp

Market Research Insights

  • The strategic landscape is shaped by the curative gene therapy pipeline, which promises single-administration treatment options and is supported by a push for rare disease drug approval. This shift challenges existing orphan drug pricing models, demanding new value-based reimbursement frameworks that prioritize metabolic crisis prevention and long-term ammonia control.
  • Effective patient treatment adherence is central, addressed by innovative clinical nutrition formulation and specialized metabolic nutrition. The expansion of comprehensive newborn screening and rapid genetic sequencing provides critical diagnostic support solutions. Success in rare disease clinical trials now relies on establishing clear regulatory surrogate endpoints, particularly for non-viral genetic therapy.
  • The goal is to achieve on-demand enzymatic activity through liver-directed gene therapy, reducing chronic treatment fatigue and improving outcomes for a range of genetic metabolic conditions, including hyperargininemia treatment, where new therapies improve diagnostic accuracy by 15% and cut administrative errors by 30%.

We can help! Our analysts can customize this urea cycle disorder treatment market research report to meet your requirements.

Get in touch

1. Executive Summary

1.1 Market overview

Executive Summary - Chart on Market Overview
Executive Summary - Data Table on Market Overview
Executive Summary - Chart on Global Market Characteristics
Executive Summary - Chart on Market by Geography
Executive Summary - Chart on Market Segmentation by Therapy
Executive Summary - Chart on Market Segmentation by Route of Administration
Executive Summary - Chart on Market Segmentation by End-user
Executive Summary - Chart on Incremental Growth
Executive Summary - Data Table on Incremental Growth
Executive Summary - Chart on Company Market Positioning

2. Technavio Analysis

2.1 Analysis of price sensitivity, lifecycle, customer purchase basket, adoption rates, and purchase criteria

2.2 Criticality of inputs and Factors of differentiation

Chart on Overview on criticality of inputs and factors of differentiation

2.3 Factors of disruption

Chart on Overview on factors of disruption

2.4 Impact of drivers and challenges

Chart on Impact of drivers and challenges in 2025 and 2030

3. Market Landscape

3.1 Market ecosystem

Chart on Parent Market
Data Table on - Parent Market

3.2 Market characteristics

Chart on Market characteristics analysis

3.3 Value chain analysis

Chart on Value chain analysis

4. Market Sizing

4.1 Market definition

Data Table on Offerings of companies included in the market definition

4.2 Market segment analysis

Market segments

4.3 Market size 2025

4.4 Market outlook: Forecast for 2025-2030

Chart on Global - Market size and forecast 2025-2030 ($ thousand)
Data Table on Global - Market size and forecast 2025-2030 ($ thousand)
Chart on Global Market: Year-over-year growth 2025-2030 (%)
Data Table on Global Market: Year-over-year growth 2025-2030 (%)

5. Historic Market Size

5.1 Global Urea Cycle Disorder Treatment Market 2020 - 2024

Historic Market Size - Data Table on Global Urea Cycle Disorder Treatment Market 2020 - 2024 ($ thousand)

5.2 Therapy segment analysis 2020 - 2024

Historic Market Size - Therapy Segment 2020 - 2024 ($ thousand)

5.3 Route of Administration segment analysis 2020 - 2024

Historic Market Size - Route of Administration Segment 2020 - 2024 ($ thousand)

5.4 End-user segment analysis 2020 - 2024

Historic Market Size - End-user Segment 2020 - 2024 ($ thousand)

5.5 Geography segment analysis 2020 - 2024

Historic Market Size - Geography Segment 2020 - 2024 ($ thousand)

5.6 Country segment analysis 2020 - 2024

Historic Market Size - Country Segment 2020 - 2024 ($ thousand)

6. Qualitative Analysis

6.1 Impact of AI in global urea cycle disorder treatment market

6.2 Impact of geopolitical conflict for global urea cycle disorder treatment market

7. Five Forces Analysis

7.1 Five forces summary

Five forces analysis - Comparison between 2025 and 2030

7.2 Bargaining power of buyers

Bargaining power of buyers - Impact of key factors 2025 and 2030

7.3 Bargaining power of suppliers

Bargaining power of suppliers - Impact of key factors in 2025 and 2030

7.4 Threat of new entrants

Threat of new entrants - Impact of key factors in 2025 and 2030

7.5 Threat of substitutes

Threat of substitutes - Impact of key factors in 2025 and 2030

7.6 Threat of rivalry

Threat of rivalry - Impact of key factors in 2025 and 2030

7.7 Market condition

Chart on Market condition - Five forces 2025 and 2030

8. Market Segmentation by Therapy

8.1 Market segments

Chart on Therapy - Market share 2025-2030 (%)
Data Table on Therapy - Market share 2025-2030 (%)

8.2 Comparison by Therapy

Chart on Comparison by Therapy
Data Table on Comparison by Therapy

8.3 Glycerol phenylbutyrate - Market size and forecast 2025-2030

Chart on Glycerol phenylbutyrate - Market size and forecast 2025-2030 ($ thousand)
Data Table on Glycerol phenylbutyrate - Market size and forecast 2025-2030 ($ thousand)
Chart on Glycerol phenylbutyrate - Year-over-year growth 2025-2030 (%)
Data Table on Glycerol phenylbutyrate - Year-over-year growth 2025-2030 (%)

8.4 Sodium phenylbutyrate - Market size and forecast 2025-2030

Chart on Sodium phenylbutyrate - Market size and forecast 2025-2030 ($ thousand)
Data Table on Sodium phenylbutyrate - Market size and forecast 2025-2030 ($ thousand)
Chart on Sodium phenylbutyrate - Year-over-year growth 2025-2030 (%)
Data Table on Sodium phenylbutyrate - Year-over-year growth 2025-2030 (%)

8.5 Amino acid supplements - Market size and forecast 2025-2030

Chart on Amino acid supplements - Market size and forecast 2025-2030 ($ thousand)
Data Table on Amino acid supplements - Market size and forecast 2025-2030 ($ thousand)
Chart on Amino acid supplements - Year-over-year growth 2025-2030 (%)
Data Table on Amino acid supplements - Year-over-year growth 2025-2030 (%)

8.6 Sodium benzoate - Market size and forecast 2025-2030

Chart on Sodium benzoate - Market size and forecast 2025-2030 ($ thousand)
Data Table on Sodium benzoate - Market size and forecast 2025-2030 ($ thousand)
Chart on Sodium benzoate - Year-over-year growth 2025-2030 (%)
Data Table on Sodium benzoate - Year-over-year growth 2025-2030 (%)

8.7 Others - Market size and forecast 2025-2030

Chart on Others - Market size and forecast 2025-2030 ($ thousand)
Data Table on Others - Market size and forecast 2025-2030 ($ thousand)
Chart on Others - Year-over-year growth 2025-2030 (%)
Data Table on Others - Year-over-year growth 2025-2030 (%)

8.8 Market opportunity by Therapy

Market opportunity by Therapy ($ thousand)
Data Table on Market opportunity by Therapy ($ thousand)

9. Market Segmentation by Route of Administration

9.1 Market segments

Chart on Route of Administration - Market share 2025-2030 (%)
Data Table on Route of Administration - Market share 2025-2030 (%)

9.2 Comparison by Route of Administration

Chart on Comparison by Route of Administration
Data Table on Comparison by Route of Administration

9.3 Oral - Market size and forecast 2025-2030

Chart on Oral - Market size and forecast 2025-2030 ($ thousand)
Data Table on Oral - Market size and forecast 2025-2030 ($ thousand)
Chart on Oral - Year-over-year growth 2025-2030 (%)
Data Table on Oral - Year-over-year growth 2025-2030 (%)

9.4 Injectables - Market size and forecast 2025-2030

Chart on Injectables - Market size and forecast 2025-2030 ($ thousand)
Data Table on Injectables - Market size and forecast 2025-2030 ($ thousand)
Chart on Injectables - Year-over-year growth 2025-2030 (%)
Data Table on Injectables - Year-over-year growth 2025-2030 (%)

9.5 Market opportunity by Route of Administration

Market opportunity by Route of Administration ($ thousand)
Data Table on Market opportunity by Route of Administration ($ thousand)

10. Market Segmentation by End-user

10.1 Market segments

Chart on End-user - Market share 2025-2030 (%)
Data Table on End-user - Market share 2025-2030 (%)

10.2 Comparison by End-user

Chart on Comparison by End-user
Data Table on Comparison by End-user

10.3 Hospitals - Market size and forecast 2025-2030

Chart on Hospitals - Market size and forecast 2025-2030 ($ thousand)
Data Table on Hospitals - Market size and forecast 2025-2030 ($ thousand)
Chart on Hospitals - Year-over-year growth 2025-2030 (%)
Data Table on Hospitals - Year-over-year growth 2025-2030 (%)

10.4 Specialized clinics - Market size and forecast 2025-2030

Chart on Specialized clinics - Market size and forecast 2025-2030 ($ thousand)
Data Table on Specialized clinics - Market size and forecast 2025-2030 ($ thousand)
Chart on Specialized clinics - Year-over-year growth 2025-2030 (%)
Data Table on Specialized clinics - Year-over-year growth 2025-2030 (%)

10.5 Home care settings - Market size and forecast 2025-2030

Chart on Home care settings - Market size and forecast 2025-2030 ($ thousand)
Data Table on Home care settings - Market size and forecast 2025-2030 ($ thousand)
Chart on Home care settings - Year-over-year growth 2025-2030 (%)
Data Table on Home care settings - Year-over-year growth 2025-2030 (%)

10.6 Research institutions - Market size and forecast 2025-2030

Chart on Research institutions - Market size and forecast 2025-2030 ($ thousand)
Data Table on Research institutions - Market size and forecast 2025-2030 ($ thousand)
Chart on Research institutions - Year-over-year growth 2025-2030 (%)
Data Table on Research institutions - Year-over-year growth 2025-2030 (%)

10.7 Market opportunity by End-user

Market opportunity by End-user ($ thousand)
Data Table on Market opportunity by End-user ($ thousand)

11. Customer Landscape

11.1 Customer landscape overview

Analysis of price sensitivity, lifecycle, customer purchase basket, adoption rates, and purchase criteria

12. Geographic Landscape

12.1 Geographic segmentation

Chart on Market share by geography 2025-2030 (%)
Data Table on Market share by geography 2025-2030 (%)

12.2 Geographic comparison

Chart on Geographic comparison
Data Table on Geographic comparison

12.3 North America - Market size and forecast 2025-2030

Chart on North America - Market size and forecast 2025-2030 ($ thousand)
Data Table on North America - Market size and forecast 2025-2030 ($ thousand)
Chart on North America - Year-over-year growth 2025-2030 (%)
Data Table on North America - Year-over-year growth 2025-2030 (%)
Chart on Regional Comparison - North America
Data Table on Regional Comparison - North America

12.3.1 US - Market size and forecast 2025-2030

Chart on US - Market size and forecast 2025-2030 ($ thousand)
Data Table on US - Market size and forecast 2025-2030 ($ thousand)
Chart on US - Year-over-year growth 2025-2030 (%)
Data Table on US - Year-over-year growth 2025-2030 (%)

12.3.2 Canada - Market size and forecast 2025-2030

Chart on Canada - Market size and forecast 2025-2030 ($ thousand)
Data Table on Canada - Market size and forecast 2025-2030 ($ thousand)
Chart on Canada - Year-over-year growth 2025-2030 (%)
Data Table on Canada - Year-over-year growth 2025-2030 (%)

12.3.3 Mexico - Market size and forecast 2025-2030

Chart on Mexico - Market size and forecast 2025-2030 ($ thousand)
Data Table on Mexico - Market size and forecast 2025-2030 ($ thousand)
Chart on Mexico - Year-over-year growth 2025-2030 (%)
Data Table on Mexico - Year-over-year growth 2025-2030 (%)

12.4 Europe - Market size and forecast 2025-2030

Chart on Europe - Market size and forecast 2025-2030 ($ thousand)
Data Table on Europe - Market size and forecast 2025-2030 ($ thousand)
Chart on Europe - Year-over-year growth 2025-2030 (%)
Data Table on Europe - Year-over-year growth 2025-2030 (%)
Chart on Regional Comparison - Europe
Data Table on Regional Comparison - Europe

12.4.1 Germany - Market size and forecast 2025-2030

Chart on Germany - Market size and forecast 2025-2030 ($ thousand)
Data Table on Germany - Market size and forecast 2025-2030 ($ thousand)
Chart on Germany - Year-over-year growth 2025-2030 (%)
Data Table on Germany - Year-over-year growth 2025-2030 (%)

12.4.2 UK - Market size and forecast 2025-2030

Chart on UK - Market size and forecast 2025-2030 ($ thousand)
Data Table on UK - Market size and forecast 2025-2030 ($ thousand)
Chart on UK - Year-over-year growth 2025-2030 (%)
Data Table on UK - Year-over-year growth 2025-2030 (%)

12.4.3 France - Market size and forecast 2025-2030

Chart on France - Market size and forecast 2025-2030 ($ thousand)
Data Table on France - Market size and forecast 2025-2030 ($ thousand)
Chart on France - Year-over-year growth 2025-2030 (%)
Data Table on France - Year-over-year growth 2025-2030 (%)

12.4.4 Italy - Market size and forecast 2025-2030

Chart on Italy - Market size and forecast 2025-2030 ($ thousand)
Data Table on Italy - Market size and forecast 2025-2030 ($ thousand)
Chart on Italy - Year-over-year growth 2025-2030 (%)
Data Table on Italy - Year-over-year growth 2025-2030 (%)

12.4.5 Spain - Market size and forecast 2025-2030

Chart on Spain - Market size and forecast 2025-2030 ($ thousand)
Data Table on Spain - Market size and forecast 2025-2030 ($ thousand)
Chart on Spain - Year-over-year growth 2025-2030 (%)
Data Table on Spain - Year-over-year growth 2025-2030 (%)

12.4.6 The Netherlands - Market size and forecast 2025-2030

Chart on The Netherlands - Market size and forecast 2025-2030 ($ thousand)
Data Table on The Netherlands - Market size and forecast 2025-2030 ($ thousand)
Chart on The Netherlands - Year-over-year growth 2025-2030 (%)
Data Table on The Netherlands - Year-over-year growth 2025-2030 (%)

12.5 Asia - Market size and forecast 2025-2030

Chart on Asia - Market size and forecast 2025-2030 ($ thousand)
Data Table on Asia - Market size and forecast 2025-2030 ($ thousand)
Chart on Asia - Year-over-year growth 2025-2030 (%)
Data Table on Asia - Year-over-year growth 2025-2030 (%)
Chart on Regional Comparison - Asia
Data Table on Regional Comparison - Asia

12.5.1 China - Market size and forecast 2025-2030

Chart on China - Market size and forecast 2025-2030 ($ thousand)
Data Table on China - Market size and forecast 2025-2030 ($ thousand)
Chart on China - Year-over-year growth 2025-2030 (%)
Data Table on China - Year-over-year growth 2025-2030 (%)

12.5.2 Japan - Market size and forecast 2025-2030

Chart on Japan - Market size and forecast 2025-2030 ($ thousand)
Data Table on Japan - Market size and forecast 2025-2030 ($ thousand)
Chart on Japan - Year-over-year growth 2025-2030 (%)
Data Table on Japan - Year-over-year growth 2025-2030 (%)

12.5.3 India - Market size and forecast 2025-2030

Chart on India - Market size and forecast 2025-2030 ($ thousand)
Data Table on India - Market size and forecast 2025-2030 ($ thousand)
Chart on India - Year-over-year growth 2025-2030 (%)
Data Table on India - Year-over-year growth 2025-2030 (%)

12.5.4 South Korea - Market size and forecast 2025-2030

Chart on South Korea - Market size and forecast 2025-2030 ($ thousand)
Data Table on South Korea - Market size and forecast 2025-2030 ($ thousand)
Chart on South Korea - Year-over-year growth 2025-2030 (%)
Data Table on South Korea - Year-over-year growth 2025-2030 (%)

12.5.5 Indonesia - Market size and forecast 2025-2030

Chart on Indonesia - Market size and forecast 2025-2030 ($ thousand)
Data Table on Indonesia - Market size and forecast 2025-2030 ($ thousand)
Chart on Indonesia - Year-over-year growth 2025-2030 (%)
Data Table on Indonesia - Year-over-year growth 2025-2030 (%)

12.5.6 Thailand - Market size and forecast 2025-2030

Chart on Thailand - Market size and forecast 2025-2030 ($ thousand)
Data Table on Thailand - Market size and forecast 2025-2030 ($ thousand)
Chart on Thailand - Year-over-year growth 2025-2030 (%)
Data Table on Thailand - Year-over-year growth 2025-2030 (%)

12.6 Rest of World (ROW) - Market size and forecast 2025-2030

Chart on Rest of World (ROW) - Market size and forecast 2025-2030 ($ thousand)
Data Table on Rest of World (ROW) - Market size and forecast 2025-2030 ($ thousand)
Chart on Rest of World (ROW) - Year-over-year growth 2025-2030 (%)
Data Table on Rest of World (ROW) - Year-over-year growth 2025-2030 (%)
Chart on Regional Comparison - Rest of World (ROW)
Data Table on Regional Comparison - Rest of World (ROW)

12.6.1 Brazil - Market size and forecast 2025-2030

Chart on Brazil - Market size and forecast 2025-2030 ($ thousand)
Data Table on Brazil - Market size and forecast 2025-2030 ($ thousand)
Chart on Brazil - Year-over-year growth 2025-2030 (%)
Data Table on Brazil - Year-over-year growth 2025-2030 (%)

12.6.2 Saudi Arabia - Market size and forecast 2025-2030

Chart on Saudi Arabia - Market size and forecast 2025-2030 ($ thousand)
Data Table on Saudi Arabia - Market size and forecast 2025-2030 ($ thousand)
Chart on Saudi Arabia - Year-over-year growth 2025-2030 (%)
Data Table on Saudi Arabia - Year-over-year growth 2025-2030 (%)

12.6.3 UAE - Market size and forecast 2025-2030

Chart on UAE - Market size and forecast 2025-2030 ($ thousand)
Data Table on UAE - Market size and forecast 2025-2030 ($ thousand)
Chart on UAE - Year-over-year growth 2025-2030 (%)
Data Table on UAE - Year-over-year growth 2025-2030 (%)

12.6.4 Turkey - Market size and forecast 2025-2030

Chart on Turkey - Market size and forecast 2025-2030 ($ thousand)
Data Table on Turkey - Market size and forecast 2025-2030 ($ thousand)
Chart on Turkey - Year-over-year growth 2025-2030 (%)
Data Table on Turkey - Year-over-year growth 2025-2030 (%)

12.6.5 Argentina - Market size and forecast 2025-2030

Chart on Argentina - Market size and forecast 2025-2030 ($ thousand)
Data Table on Argentina - Market size and forecast 2025-2030 ($ thousand)
Chart on Argentina - Year-over-year growth 2025-2030 (%)
Data Table on Argentina - Year-over-year growth 2025-2030 (%)

12.6.6 Colombia - Market size and forecast 2025-2030

Chart on Colombia - Market size and forecast 2025-2030 ($ thousand)
Data Table on Colombia - Market size and forecast 2025-2030 ($ thousand)
Chart on Colombia - Year-over-year growth 2025-2030 (%)
Data Table on Colombia - Year-over-year growth 2025-2030 (%)

12.6.7 South Africa - Market size and forecast 2025-2030

Chart on South Africa - Market size and forecast 2025-2030 ($ thousand)
Data Table on South Africa - Market size and forecast 2025-2030 ($ thousand)
Chart on South Africa - Year-over-year growth 2025-2030 (%)
Data Table on South Africa - Year-over-year growth 2025-2030 (%)

12.6.8 Israel - Market size and forecast 2025-2030

Chart on Israel - Market size and forecast 2025-2030 ($ thousand)
Data Table on Israel - Market size and forecast 2025-2030 ($ thousand)
Chart on Israel - Year-over-year growth 2025-2030 (%)
Data Table on Israel - Year-over-year growth 2025-2030 (%)

12.7 Market opportunity by geography

Market opportunity by geography ($ thousand)
Data Tables on Market opportunity by geography ($ thousand)

13. Drivers, Challenges, and Opportunity

13.1 Market drivers

Mainstreaming of curative gene therapies and industrialization of AAV delivery vectors
Expansion of precision diagnostics and strategic rise of comprehensive newborn screening and rapid genetic sequencing
Evolution of patient-centric oral formulations and strategic demand for taste-masked and sustained-release ammonia scavengers

13.2 Market challenges

Financial burden of orphan drug pricing and resistance of global reimbursement frameworks
Logistical complexity of lifelong adherence and clinical risk of chronic treatment fatigue
Technical debt of diagnostic infrastructure and geographic disparity in newborn screening programs

13.3 Impact of drivers and challenges

Impact of drivers and challenges in 2025 and 2030

13.4 Market opportunities

Institutionalization of mRNA-based therapeutic interventions and enzyme replacement advancements
Proliferation of pharmacological chaperones for stabilization of misfolded metabolic proteins
Strategic advancement of rare disease approval pathways and formalization of regulatory surrogate endpoints

14. Competitive Landscape

14.1 Overview

14.2

Overview on criticality of inputs and factors of differentiation

14.3 Landscape disruption

Overview on factors of disruption

14.4 Industry risks

Impact of key risks on business

15. Competitive Analysis

15.1 Companies profiled

Companies covered

15.2 Company ranking index

15.3 Market positioning of companies

Matrix on companies position and classification

15.4 Abbott Laboratories

Abbott Laboratories - Overview
Abbott Laboratories - Business segments
Abbott Laboratories - Key news
Abbott Laboratories - Key offerings
Abbott Laboratories - Segment focus
SWOT

15.5 Amgen Inc.

Amgen Inc. - Overview
Amgen Inc. - Product / Service
Amgen Inc. - Key offerings
SWOT

15.6 ANI Pharmaceuticals Inc.

ANI Pharmaceuticals Inc. - Overview
ANI Pharmaceuticals Inc. - Product / Service
ANI Pharmaceuticals Inc. - Key offerings
SWOT

15.7 Bausch Health Companies Inc.

Bausch Health Companies Inc. - Overview
Bausch Health Companies Inc. - Business segments
Bausch Health Companies Inc. - Key offerings
Bausch Health Companies Inc. - Segment focus
SWOT

15.8 Danone SA

Danone SA - Overview
Danone SA - Business segments
Danone SA - Key offerings
Danone SA - Segment focus
SWOT

15.9 Dr. Reddys Laboratories Ltd.

Dr. Reddys Laboratories Ltd. - Overview
Dr. Reddys Laboratories Ltd. - Business segments
Dr. Reddys Laboratories Ltd. - Key news
Dr. Reddys Laboratories Ltd. - Key offerings
Dr. Reddys Laboratories Ltd. - Segment focus
SWOT

15.10 Lucane Pharma SA

Lucane Pharma SA - Overview
Lucane Pharma SA - Product / Service
Lucane Pharma SA - Key offerings
SWOT

15.11 Lupin Ltd.

Lupin Ltd. - Overview
Lupin Ltd. - Business segments
Lupin Ltd. - Key news
Lupin Ltd. - Key offerings
Lupin Ltd. - Segment focus
SWOT

15.12 Navinta LLC

Navinta LLC - Overview
Navinta LLC - Product / Service
Navinta LLC - Key offerings
SWOT

15.13 Nestle SA

Nestle SA - Overview
Nestle SA - Business segments
Nestle SA - Key news
Nestle SA - Key offerings
Nestle SA - Segment focus
SWOT

15.14 Reckitt Benckiser Group Plc

Reckitt Benckiser Group Plc - Overview
Reckitt Benckiser Group Plc - Business segments
Reckitt Benckiser Group Plc - Key offerings
Reckitt Benckiser Group Plc - Segment focus
SWOT

15.15 Recordati S.p.A

Recordati S.p.A - Overview
Recordati S.p.A - Business segments
Recordati S.p.A - Key offerings
Recordati S.p.A - Segment focus
SWOT

15.16 Sigmapharm Laboratories LLC

Sigmapharm Laboratories LLC - Overview
Sigmapharm Laboratories LLC - Product / Service
Sigmapharm Laboratories LLC - Key offerings
SWOT

15.17 Swedish Orphan Biovitrum AB

Swedish Orphan Biovitrum AB - Overview
Swedish Orphan Biovitrum AB - Product / Service
Swedish Orphan Biovitrum AB - Key offerings
SWOT

15.18 Teva Pharmaceutical Ltd.

Teva Pharmaceutical Ltd. - Overview
Teva Pharmaceutical Ltd. - Business segments
Teva Pharmaceutical Ltd. - Key news
Teva Pharmaceutical Ltd. - Key offerings
Teva Pharmaceutical Ltd. - Segment focus
SWOT

16. Appendix

16.1 Scope of the report

Market definition
Objectives
Notes and caveats

16.2 Inclusions and exclusions checklist

Inclusions checklist
Exclusions checklist

16.3 Currency conversion rates for US$

16.4 Research methodology

16.5 Data procurement

Information sources

16.6 Data validation

16.7 Validation techniques employed for market sizing

16.8 Data synthesis

16.9 360 degree market analysis

16.10 List of abbreviations

Research Methodology

Technavio presents a detailed picture of the market by way of study, synthesis, and summation of data from multiple sources. The analysts have presented the various facets of the market with a particular focus on identifying the key industry influencers. The data thus presented is comprehensive, reliable, and the result of extensive research, both primary and secondary.

INFORMATION SOURCES

Primary sources

  • Manufacturers and suppliers
  • Channel partners
  • Industry experts
  • Strategic decision makers

Secondary sources

  • Industry journals and periodicals
  • Government data
  • Financial reports of key industry players
  • Historical data
  • Press releases

DATA ANALYSIS

Data Synthesis

  • Collation of data
  • Estimation of key figures
  • Analysis of derived insights

Data Validation

  • Triangulation with data models
  • Reference against proprietary databases
  • Corroboration with industry experts

REPORT WRITING

Qualitative

  • Market drivers
  • Market challenges
  • Market trends
  • Five forces analysis

Quantitative

  • Market size and forecast
  • Market segmentation
  • Geographical insights
  • Competitive landscape

Interested in this report?

Get your sample now to see our research methodology and insights!

Download Now

Frequently Asked Questions

Urea Cycle Disorder Treatment market growth will increase by USD 240130.5 thousand thousand during 2026-2030.

The Urea Cycle Disorder Treatment market is expected to grow at a CAGR of 3.3% during 2026-2030.

Urea Cycle Disorder Treatment market is segmented by Therapy (Glycerol phenylbutyrate, Sodium phenylbutyrate, Amino acid supplements, Sodium benzoate, Others) Route of administration (Oral, Injectables) End-user (Hospitals, Specialized clinics, Home care settings, Research institutions)

Abbott Laboratories, Amgen Inc., ANI Pharmaceuticals Inc., Bausch Health Companies Inc., Danone SA, Dr. Reddys Laboratories Ltd., Immedica Pharma AB, Lucane Pharma SA, Lupin Ltd., Medunik Canada, Navinta LLC, Nestle SA, Orpharma Pty Ltd., Reckitt Benckiser Group Plc, Recordati S.p.A, Sigmapharm Laboratories LLC, Swedish Orphan Biovitrum AB, Teva Pharmaceutical Ltd., Zebra Technologies Corp are a few of the key vendors in the Urea Cycle Disorder Treatment market.

North America will register the highest growth rate of 38.5% among the other regions. Therefore, the Urea Cycle Disorder Treatment market in North America is expected to garner significant business opportunities for the vendors during the forecast period.

US, Canada, Mexico, Germany, UK, France, Italy, Spain, The Netherlands, China, Japan, India, South Korea, Indonesia, Thailand, Brazil, Saudi Arabia, UAE, Turkey, Argentina, Colombia, South Africa, Israel

  • Mainstreaming of curative gene therapies and industrialization of AAV delivery vectors is the driving factor this market.

The Urea Cycle Disorder Treatment market vendors should focus on grabbing business opportunities from the Therapy segment as it accounted for the largest market share in the base year.
RIA - Research AI Assistant
Ask RIA