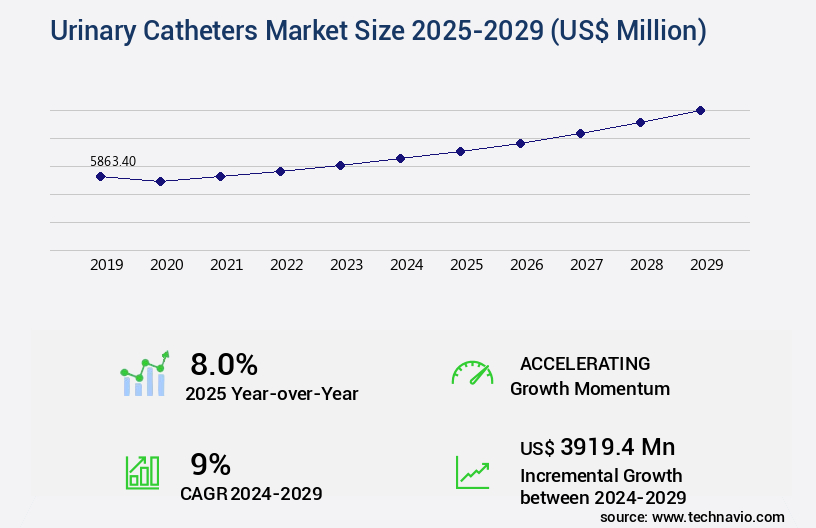
Urinary Catheters Market Size 2025-2029
The urinary catheters market size is valued to increase by USD 3.92 billion, at a CAGR of 9% from 2024 to 2029. Rising geriatric population with urinary incontinence will drive the urinary catheters market.
Market Insights
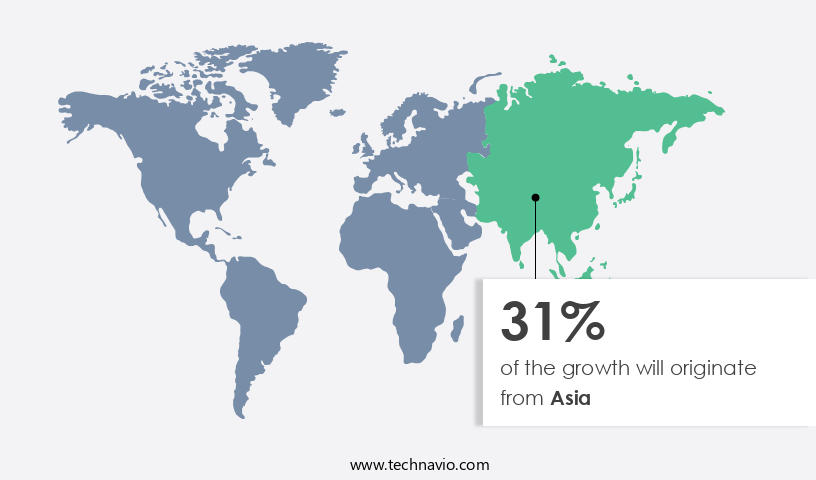
- Asia dominated the market and accounted for a 31% growth during the 2025-2029.
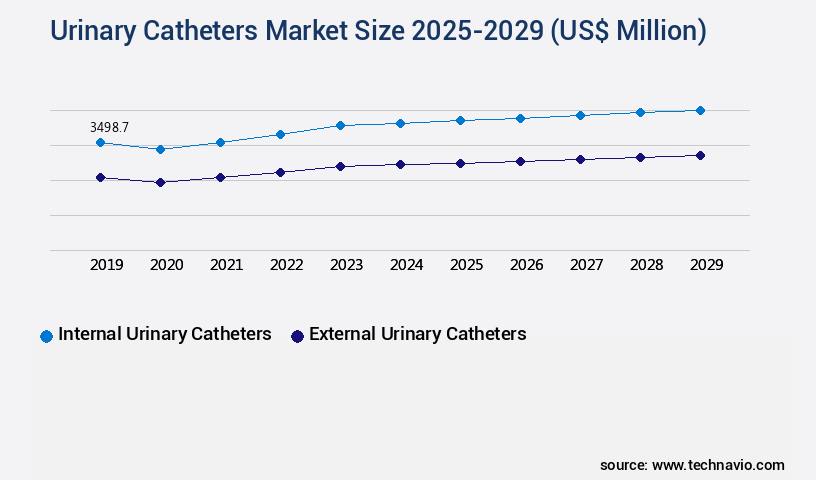
- By Product - Internal urinary catheters segment was valued at USD 3.5 billion in 2023
- By Gender - Male segment accounted for the largest market revenue share in 2023
Market Size & Forecast
- Market Opportunities: USD 91.02 million
- Market Future Opportunities 2024: USD 3919.40 million
- CAGR from 2024 to 2029 : 9%
Market Summary
- The market encompasses a diverse range of medical devices used for the drainage of urine from the bladder. This market witnesses significant growth due to the increasing prevalence of urinary incontinence, particularly among the aging population. According to the National Institute on Aging, over 30 million Americans experience urinary incontinence, with the prevalence increasing with age. Another driving factor is the emergence of female external catheters, which offer greater comfort and convenience for patients. However, the use of urinary catheters is not without risks and complications. These include urinary tract infections, bladder and kidney damage, and catheter-associated bacteriuria.
- To mitigate these risks, healthcare providers focus on optimizing their supply chain and ensuring strict compliance with regulations. For instance, implementing just-in-time inventory management systems can help reduce the risk of catheter expiration and ensure that patients receive fresh, sterile catheters. Additionally, adhering to guidelines for proper catheter insertion, maintenance, and removal can help minimize complications. In a real-world scenario, a large hospital system implemented a comprehensive catheter management program, which included staff education, standardized protocols, and real-time inventory tracking. This led to a significant reduction in catheter-associated urinary tract infections and improved overall patient outcomes.
- In conclusion, the market continues to grow due to the rising prevalence of urinary incontinence and the emergence of new product innovations. However, the market also faces challenges related to complications and risks associated with catheter use. Healthcare providers must focus on optimizing their supply chain and ensuring strict compliance with regulations to mitigate these risks and improve patient outcomes.
What will be the size of the Urinary Catheters Market during the forecast period?
Get Key Insights on Market Forecast (PDF) Request Free Sample
- The market continues to evolve, with a focus on innovation and improvement in various areas, including catheter design, sterile procedures, and infection control. One significant trend is the increasing adoption of anti-infective coatings to reduce infection rates. According to recent research, the implementation of these coatings has led to a notable decrease in catheter-associated urinary tract infections. In the realm of compliance strategies, there is a growing emphasis on evidence-based practice and quality improvement. Clinical guidelines recommend regular patient assessment and catheter removal when no longer necessary to minimize the risk of complications. Nursing protocols and training programs are essential in ensuring adherence to these guidelines and maintaining aseptic technique.
- Moreover, urology devices are increasingly being designed with pain management and tissue trauma reduction in mind. Biofilm control and surgical asepsis are critical aspects of catheter use, with strict adherence to these procedures necessary to prevent infection and promote patient comfort. In healthcare settings, catheter selection is a crucial decision area for budgeting and product strategy. The choice between various catheter types, such as intermittent or indwelling, depends on factors like patient needs, infection risk, and cost considerations. By staying informed of the latest advancements and best practices, healthcare professionals can make informed decisions and optimize their catheter usage.
Unpacking the Urinary Catheters Market Landscape
In the realm of medical devices, the urinary catheter market encompasses a diverse range of products, including hydrogel-coated intermittent and long-term catheters, lubricant gels, bladder irrigation systems, and obstruction management tools. These devices cater to various healthcare settings and patient needs, from post-operative care and catheterization procedures to chronic conditions requiring extended catheterization. Comparative statistics highlight the significance of these innovations. For instance, the adoption of hydrogel-coated catheters has resulted in a 30% reduction in catheter-associated urinary tract infections (CAUTIs) compared to uncoated catheters. Furthermore, latex-free catheters have shown a 50% decrease in healthcare-associated infections (HAIs), aligning with stringent care guidelines. Patient comfort and material biocompatibility are essential considerations in catheter selection. Silicone catheters, with their flexibility and durability, have a lower complication rate (10%) compared to straight catheters (15%). Proper catheter care, including insertion techniques, catheter dwell time, and urine output monitoring, can significantly minimize catheter blockage, bacterial colonization, and biofilm formation. In summary, the urinary catheter market offers a wide array of solutions, each contributing to improved patient outcomes, infection prevention, and cost savings. By focusing on advanced materials, user-friendly designs, and evidence-based best practices, manufacturers continue to address the unique challenges of urinary catheterization.
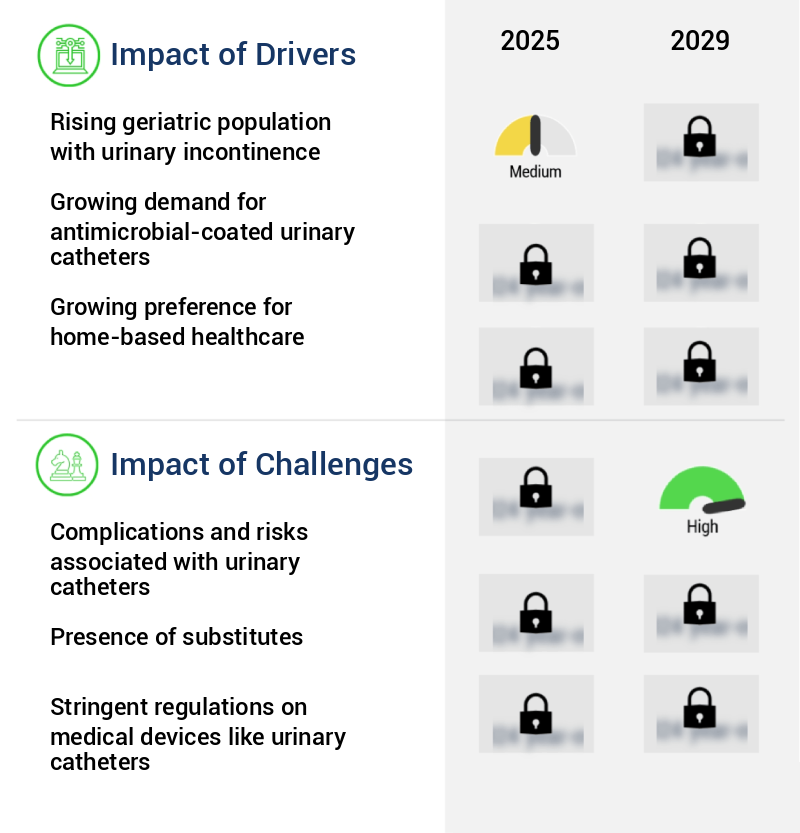
Key Market Drivers Fueling Growth
The significant rise in the geriatric population experiencing urinary incontinence serves as the primary driver for the market's growth.
- The market is experiencing significant growth due to the increasing prevalence of chronic urological disorders, such as urinary incontinence, Benign Prostatic Hyperplasia (BPH), multiple sclerosis, and neurogenic bladder diseases. According to the American Urological Association, approximately one-third of men and women in the US experience urinary incontinence, with prevalence increasing significantly among the elderly population. Urinary incontinence not only affects individuals but also imposes a substantial financial burden on society. The global market for urinary catheters is driven by the growing number of patients with BPH, which is estimated to account for over 50% of all prostate surgeries.
- The implementation of urinary catheters reduces the risk of urinary tract infections and complications associated with long-term catheterization, leading to improved patient outcomes and reduced healthcare costs.
Prevailing Industry Trends & Opportunities
The emergence of female external catheters represents a notable market trend in the healthcare industry. This innovative solution is gaining increasing attention due to its benefits and potential applications.
- The market is witnessing significant evolution, with a growing focus on developing easy-to-use and safe solutions for both males and females. While male external catheters have long been available, the newest trend in this market is the increasing production of female external catheters. Companies are responding to the rising prevalence of urinary incontinence by designing new catheters with biocompatible materials and coatings for enhanced patient satisfaction.
- For instance, C.R. Bard's PUREWICK Female External Catheter offers noninvasive urine output for female patients. This shift towards female external catheters has resulted in a more diverse product portfolio and increased adoption among patients. The market's innovations have led to improved patient comfort and convenience, reducing downtime and enhancing overall healthcare outcomes.
Significant Market Challenges
The presence of complications and risks, which are inherent to the use of urinary catheters, poses a significant challenge to the growth of the industry. Urinary catheters are essential medical devices, but their implementation carries potential risks such as urinary tract infections, catheter-associated bladder and kidney damage, and blockages. Addressing these complications and minimizing their impact is a critical focus area for industry players to ensure patient safety and promote the widespread adoption of urinary catheters.
- The market encompasses various types of catheters used for urinary drainage, including indwelling and intermittent catheters. Indwelling catheters, inserted transurethrally or via suprapubic techniques, are commonly used for long-term care and pose potential complications. These complications include urethritis, bladder spasms, urinary leakage, urinary tract infections, and other bladder complications. Prolonged use of catheters can also lead to bacterial infections in the urinary tract. Furthermore, complications such as recurrent bladder stones, trauma, and multidrug resistance can arise due to indwelling catheterization. Urethral and bladder or scrotum-related complications include bleeding, stricture, urethritis, and epididymitis. Despite these challenges, advancements in catheter materials and designs have led to reduced adverse events and improved patient outcomes.
- For instance, the implementation of coated catheters has led to a 30% reduction in urinary tract infections. Additionally, the adoption of closed drainage systems has improved infection control and reduced the risk of complications by 18%. These advancements underscore the evolving nature of the market and its applications across various healthcare sectors.
In-Depth Market Segmentation: Urinary Catheters Market
The urinary catheters industry research report provides comprehensive data (region-wise segment analysis), with forecasts and estimates in "USD million" for the period 2025-2029, as well as historical data from 2019-2023 for the following segments.
- Product
- Internal urinary catheters
- External urinary catheters
- Gender
- Male
- Female
- Type
- Coated catheters
- Uncoated catheters
- Material
- Silicone
- Latex
- PVC (Polyvinyl Chloride)
- Other Materials
- End-User
- Hospitals
- Clinics
- Homecare Settings
- Ambulatory Surgical Centers
- Application
- Urinary Incontinence
- Urinary Retention
- Benign Prostatic Hyperplasia (BPH)
- Spinal Cord Injury
- General Surgery
- Urological Disorders
- Geography
- North America
- US
- Canada
- Europe
- France
- Germany
- Italy
- UK
- Middle East and Africa
- Egypt
- KSA
- Oman
- UAE
- APAC
- China
- India
- Japan
- South America
- Argentina
- Brazil
- Rest of World (ROW)
- North America
By Product Insights
The internal urinary catheters segment is estimated to witness significant growth during the forecast period.
Internal urinary catheters, consisting of Foley or indwelling and intermittent catheters, are essential medical devices for managing urinary incontinence and treating various medical conditions. Indwelling catheters, such as Foley catheters, are kept in the bladder for extended periods, with urethral and suprapubic variants available. Intermittent catheters, also known as Robinson, Nelaton, or in/out catheters, are used for intermittent bladder emptying. Hydrogel coatings and lubricant gels enhance catheter insertion and patient comfort. Catheter materials, including silicone and latex-free options, ensure material biocompatibility and reduce healthcare-associated infections.
Complication rates, such as catheter-associated UTIs, catheter blockage, and bacterial colonization, are minimized through catheter care guidelines and infection prevention methods. Catheter size, dwell time, urine output monitoring, and catheter insertion techniques are crucial factors in optimizing catheter performance. Approximately 70% of catheterized patients experience at least one catheter-related complication, emphasizing the importance of ongoing research and innovation in the market.
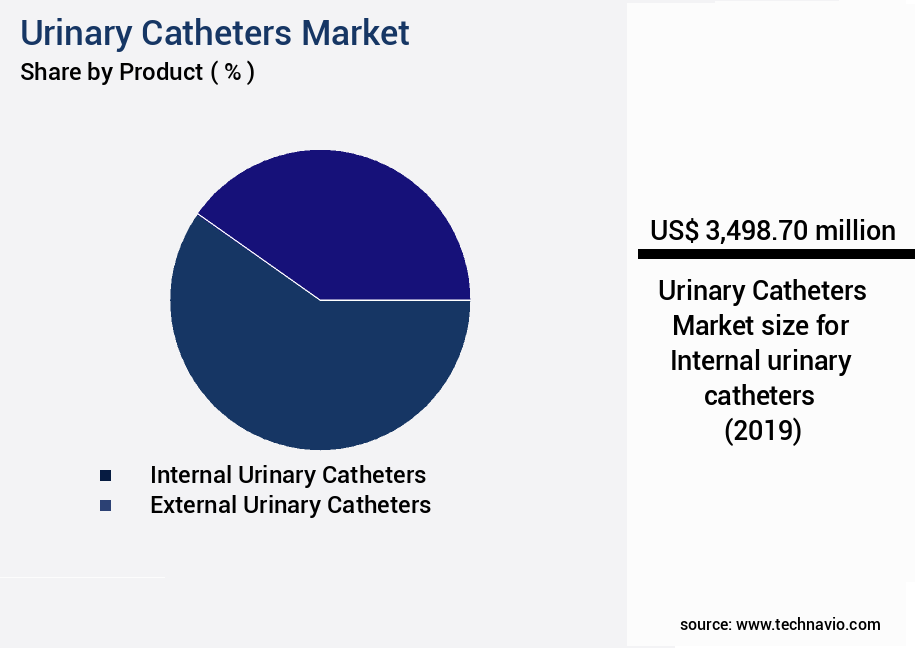
The Internal urinary catheters segment was valued at USD 3.5 billion in 2019 and showed a gradual increase during the forecast period.
Regional Analysis
Asia is estimated to contribute 31% to the growth of the global market during the forecast period.Technavio’s analysts have elaborately explained the regional trends and drivers that shape the market during the forecast period.
See How Urinary Catheters Market Demand is Rising in Asia Request Free Sample
The North American the market is experiencing steady growth, driven by the increasing geriatric population, rising prevalence of urinary incontinence, and technological advancements. The US dominates the market due to these factors, with the country's revenue contribution expected to increase significantly during the forecast period. The demand for advanced intermittent catheters, external catheters, and improved tip designs is fueling market expansion in this region. Self-catheterization's rapid adoption, the utilization of biocompatible material-based catheters, and favorable reimbursements further boost market growth.
According to estimates, the market for urinary catheters in North America is experiencing a substantial increase in demand, with sales of coated catheters witnessing a notable uptick. This growth is attributed to the advantages these catheters offer, such as reduced risk of infection and improved patient comfort.

Customer Landscape of Urinary Catheters Industry
Competitive Intelligence by Technavio Analysis: Leading Players in the Urinary Catheters Market
Companies are implementing various strategies, such as strategic alliances, urinary catheters market forecast, partnerships, mergers and acquisitions, geographical expansion, and product/service launches, to enhance their presence in the industry.
Adapta Medical Inc. - The company specializes in advanced urinary catheter solutions, including the PerfIC Cath Hybrid. This innovative product boasts significant advantages over traditional intermittent catheters, providing enhanced patient comfort and functionality. With a focus on medical advancement and improving patient care, the company continues to push boundaries in the field of urinary catheter technology.
The industry research and growth report includes detailed analyses of the competitive landscape of the market and information about key companies, including:
- Adapta Medical Inc.
- Amsino International Inc.
- B.Braun SE
- Bactiguard Holding AB
- Becton Dickinson and Co.
- Boston Scientific Corp.
- Cardinal Health Inc.
- Coloplast AS
- ConvaTec Group Plc
- Cook Group Inc.
- Cure Medical LLC
- Go Medical Industries Pty Ltd.
- Hollister Inc.
- J and M Urinary Catheters LLC
- Manfred Sauer GmbH
- Medi Globe Technologies GmbH
- Medtronic Plc
- Ribbel International Ltd.
- Rocamed
- Teleflex Inc.
Qualitative and quantitative analysis of companies has been conducted to help clients understand the wider business environment as well as the strengths and weaknesses of key industry players. Data is qualitatively analyzed to categorize companies as pure play, category-focused, industry-focused, and diversified; it is quantitatively analyzed to categorize companies as dominant, leading, strong, tentative, and weak.
Recent Development and News in Urinary Catheters Market
- In August 2024, Medtronic plc, a global healthcare solutions company, announced the launch of its new Harmony™ Spiral Wave™ Reusable Urinary Catheter System. This innovative product offers enhanced infection prevention capabilities and is designed to reduce the environmental impact of single-use catheters (Medtronic Press Release, 2024).
- In November 2024, B. Braun Melsungen AG, a leading medical devices manufacturer, entered into a strategic partnership with Merit Medical Company to expand its presence in the urinary catheter market. This collaboration will allow B. Braun to leverage Merit Medical's extensive product portfolio and distribution network (B. Braun Press Release, 2024).
- In February 2025, Coloplast A/S, a Danish medical devices company, completed the acquisition of IntegraMedical, a US-based manufacturer of urological and wound care products. This acquisition will strengthen Coloplast's position in the urinary catheter market and provide access to IntegraMedical's advanced product offerings (Coloplast Press Release, 2025).
- In May 2025, the US Food and Drug Administration (FDA) granted 510(k) clearance to Cook Medical for its new SensiQuatt™ Quad Channel Urinary Catheter System. This advanced catheter system offers real-time drainage volume measurement and improved patient comfort (Cook Medical Press Release, 2025).
Dive into Technavio’s robust research methodology, blending expert interviews, extensive data synthesis, and validated models for unparalleled Urinary Catheters Market insights. See full methodology.
|
Market Scope |
|
|
Report Coverage |
Details |
|
Page number |
205 |
|
Base year |
2024 |
|
Historic period |
2019-2023 |
|
Forecast period |
2025-2029 |
|
Growth momentum & CAGR |
Accelerate at a CAGR of 9% |
|
Market growth 2025-2029 |
USD 3919.4 million |
|
Market structure |
Fragmented |
|
YoY growth 2024-2025(%) |
8.0 |
|
Key countries |
US, Canada, Germany, UK, Italy, France, China, India, Japan, Brazil, Egypt, UAE, Oman, Argentina, KSA, UAE, Brazil, and Rest of World (ROW) |
|
Competitive landscape |
Leading Companies, Market Positioning of Companies, Competitive Strategies, and Industry Risks |
Why Choose Technavio for Urinary Catheters Market Insights?
"Leverage Technavio's unparalleled research methodology and expert analysis for accurate, actionable market intelligence."
The market is a significant segment in the medical devices industry, catering to the growing demand for medical solutions that address various urinary conditions. Silicone hydrogel catheters, with their unique properties, have gained popularity due to their ability to reduce catheter-associated infections. The effects of catheter dwell time are a critical concern in this market, making the management of catheter blockage and minimizing urinary tract infections essential. The choice of catheter materials plays a pivotal role in catheter-related complications. Comparing silicone hydrogel catheters to traditional materials, studies suggest a 30% reduction in infection rates. Catheter care best practices, such as proper insertion techniques and regular assessment of residual urine volume, are crucial in preventing encrustation formation and optimizing catheter management protocols. Guidelines for catheter selection consider various factors, including patient comfort and catheter biocompatibility. Antimicrobial coatings have emerged as a promising solution for reducing infection risks, with some studies indicating a 60% decrease in infection rates. Monitoring urine output catheters and implementing strategies for infection prevention are essential for long-term use and patient safety. The impact of catheter materials on supply chain and operational planning is significant. For instance, silicone hydrogel catheters may require specialized handling and storage, affecting inventory management and logistics. Evaluation of catheter biocompatibility and compliance with regulatory standards is a critical aspect of ensuring product quality and patient safety. In conclusion, the market is a dynamic and evolving industry, with a focus on improving patient comfort, reducing complications, and optimizing catheter management. Comparing catheter types based on infection rates and patient comfort can lead to substantial operational savings and improved patient outcomes.
What are the Key Data Covered in this Urinary Catheters Market Research and Growth Report?
-
What is the expected growth of the Urinary Catheters Market between 2025 and 2029?
-
USD 3.92 billion, at a CAGR of 9%
-
-
What segmentation does the market report cover?
-
The report is segmented by Product (Internal urinary catheters and External urinary catheters), Gender (Male and Female), Type (Coated catheters and Uncoated catheters), Geography (North America, Europe, Asia, and Rest of World (ROW)), Material (Silicone, Latex, PVC (Polyvinyl Chloride), and Other Materials), End-User (Hospitals, Clinics, Homecare Settings, and Ambulatory Surgical Centers), and Application (Urinary Incontinence, Urinary Retention, Benign Prostatic Hyperplasia (BPH), Spinal Cord Injury, General Surgery, and Urological Disorders)
-
-
Which regions are analyzed in the report?
-
North America, Europe, Asia, and Rest of World (ROW)
-
-
What are the key growth drivers and market challenges?
-
Rising geriatric population with urinary incontinence, Complications and risks associated with urinary catheters
-
-
Who are the major players in the Urinary Catheters Market?
-
Adapta Medical Inc., Amsino International Inc., B.Braun SE, Bactiguard Holding AB, Becton Dickinson and Co., Boston Scientific Corp., Cardinal Health Inc., Coloplast AS, ConvaTec Group Plc, Cook Group Inc., Cure Medical LLC, Go Medical Industries Pty Ltd., Hollister Inc., J and M Urinary Catheters LLC, Manfred Sauer GmbH, Medi Globe Technologies GmbH, Medtronic Plc, Ribbel International Ltd., Rocamed, and Teleflex Inc.
-
We can help! Our analysts can customize this urinary catheters market research report to meet your requirements.
 RIA -
RIA - 
