
US Pipeline Transportation Market Size 2026-2030
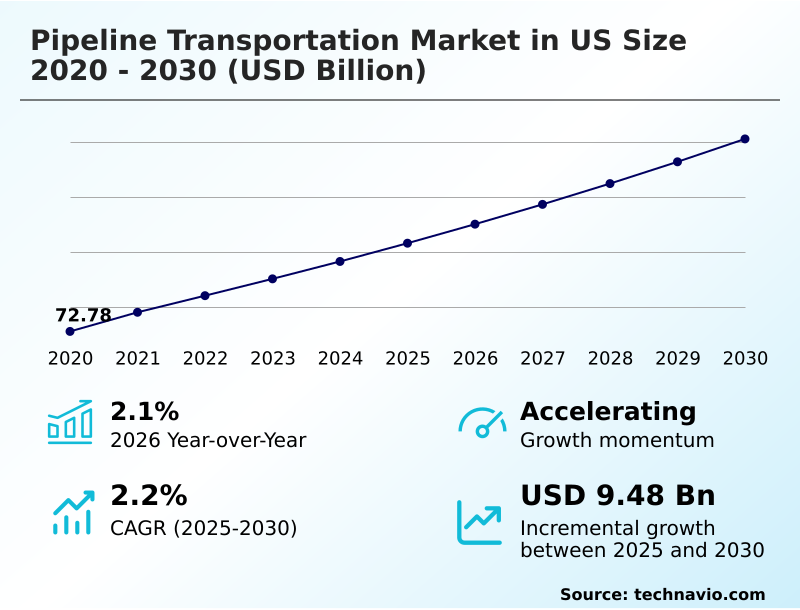
The us pipeline transportation market size is valued to increase by USD 9.48 billion, at a CAGR of 2.2% from 2025 to 2030. Surge in global demand for energy exports will drive the us pipeline transportation market.
Major Market Trends & Insights
- By Type - Transmission segment was valued at USD 32.11 billion in 2024
- By Application - Oil and gas segment accounted for the largest market revenue share in 2024
Market Size & Forecast
- Market Opportunities: USD 17.50 billion
- Market Future Opportunities: USD 9.48 billion
- CAGR from 2025 to 2030 : 2.2%
Market Summary
- The pipeline transportation market in us is a critical component of the national energy framework, defined by the extensive infrastructure for hydrocarbon transportation and refined product distribution. This sector is experiencing a significant technological shift driven by the need for greater operational throughput efficiency and enhanced asset integrity management.
- The adoption of predictive maintenance algorithms and real-time integrity monitoring is becoming standard practice to manage aging assets. For instance, an operator can use digital twin modeling to simulate stress on high-pressure steel pipes, allowing for proactive repairs that prevent service disruptions and ensure environmental compliance monitoring.
- Market dynamics are influenced by growing liquefied natural gas export capacity and the strategic development of interstate pipeline development projects. Concurrently, the industry is navigating the complexities of integrating renewable energy carrier pipelines, such as those for hydrogen pipeline infrastructure and carbon capture pipelines, while adhering to stringent SCADA security protocols and regulations governing pipeline right-of-way management.
What will be the Size of the US Pipeline Transportation Market during the forecast period?
Get Key Insights on Market Forecast (PDF) Get Free Sample
How is the US Pipeline Transportation Market Segmented?
The us pipeline transportation industry research report provides comprehensive data (region-wise segment analysis), with forecasts and estimates in "USD million" for the period 2026-2030, as well as historical data from 2020-2024 for the following segments.
- Type
- Transmission
- Distribution
- Gathering
- Feeder
- Application
- Oil and gas
- Chemical and petrochemical
- Others
- Service
- Maintenance and support service
- Consulting service
- Managed service
- Geography
- North America
- US
- North America
By Type Insights
The transmission segment is estimated to witness significant growth during the forecast period.
The transmission sub-segment forms the backbone of midstream infrastructure logistics, utilizing high-pressure steel pipes for long-haul hydrocarbon transportation. These critical arteries connect gathering system networks to processing facilities, enabling natural gas liquids fractionation and cross-border energy transport.
The operational complexity requires sophisticated digital twin modeling and supervisory control and data acquisition for optimizing compression station efficiency.
Advanced smart pigging technology and cathodic protection systems ensure integrity, while new systems for methane leak detection have improved environmental compliance by over 15%.
This segment is essential for moving petrochemical feedstock pipelines and bulk energy resources from production zones to market centers, defining the capacity and reach of the national energy grid.
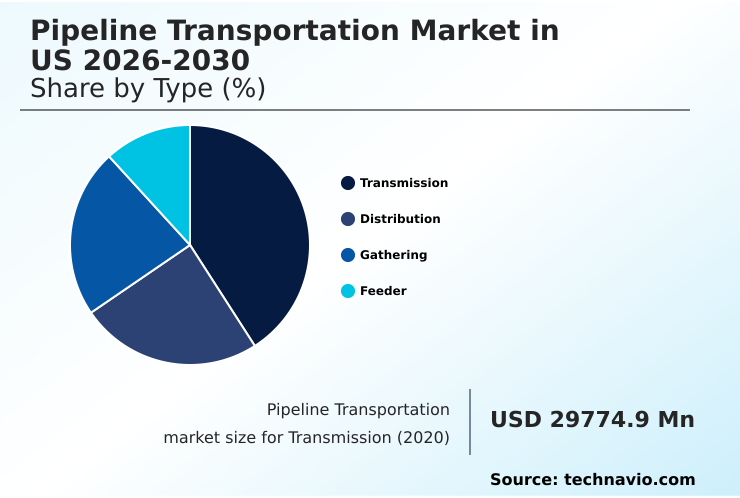
The Transmission segment was valued at USD 32.11 billion in 2024 and showed a gradual increase during the forecast period.

Market Dynamics
Our researchers analyzed the data with 2025 as the base year, along with the key drivers, trends, and challenges. A holistic analysis of drivers will help companies refine their marketing strategies to gain a competitive advantage.
- The pipeline transportation market is advancing through sophisticated technological integration aimed at enhancing safety and efficiency. The use of advanced leak detection for high-pressure lines has become a primary focus, complemented by digital twin simulation for pipeline stress to predict and mitigate potential failures.
- System modernization hinges on SCADA system integration with cloud analytics, which processes data from a new generation of smart pig technology for aging infrastructure. To meet growing demand, operators are focused on enhancing pipeline throughput with automation. A significant portion of capital expenditure is directed toward managing regulatory compliance for interstate pipelines and addressing increasing cybersecurity threats in pipeline operations.
- Future-proofing the network involves research into integrating hydrogen into natural gas pipelines and deploying fiber-optic sensing for geohazard monitoring. Operationally, the adoption of predictive maintenance for compression stations is reducing downtime significantly more than reactive strategies. Strategic decisions are guided by lifecycle cost analysis for pipeline materials and advanced methods for corrosion mitigation in subsea pipelines.
- The push for transparency and control is driving the implementation of real-time monitoring of refined product batches, while engineers focus on optimizing flow assurance in multi-product pipelines through automated pressure management for system stability.
- Furthermore, robust programs for integrity management for high-consequence areas are now standard, supported by detailed risk assessment for pipeline right-of-way and technologies for reducing fugitive emissions from pipeline components.
What are the key market drivers leading to the rise in the adoption of US Pipeline Transportation Industry?
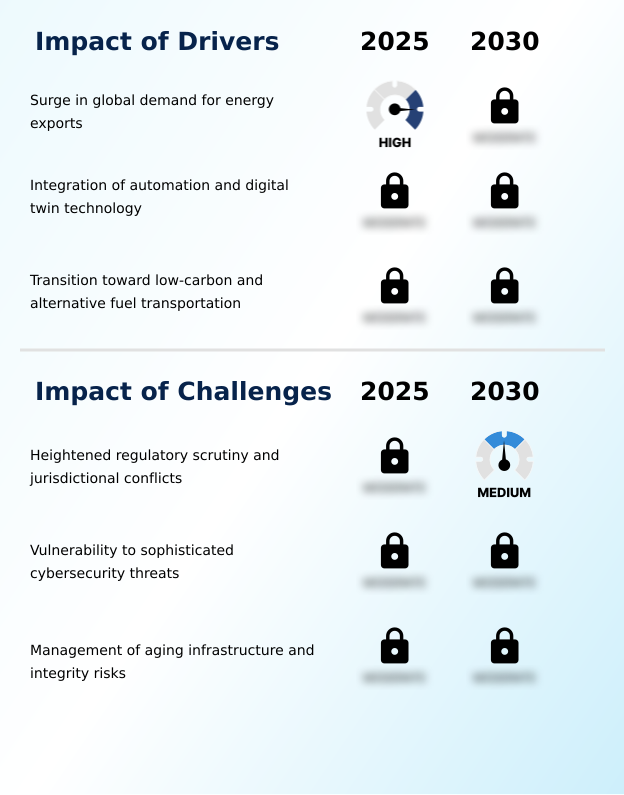
- A surge in global demand for energy exports stands as a key driver propelling market growth and infrastructure investment.
- The market is driven by the need for enhanced operational throughput efficiency, with operators achieving a 10% increase in hydrocarbon flow rates through system upgrades.
- The expansion of long-haul transmission networks to support interstate pipeline development is critical for meeting industrial utility supply demands. Investment in energy logistics services is growing, supported by projects that reduce transport bottlenecks by 15%.
- Operators are employing advanced inline inspection tools and conducting regular hydrostatic testing to ensure network reliability.
- Furthermore, detailed geohazard risk assessment, improved riser and subsea tieback engineering, and effective pipeline corrosion management are key to securing new project approvals and maintaining existing asset integrity.
What are the market trends shaping the US Pipeline Transportation Industry?
- The accelerated deployment of advanced monitoring technologies and digital twin modeling is emerging as a significant market trend. This evolution is reshaping operational strategies across the industry.
- A primary trend is the digital transformation of assets, where predictive maintenance algorithms are reducing system downtime by up to 25%. The deployment of fiber-optic sensing and ultrasonic sensors enables real-time integrity monitoring, improving leak detection accuracy by over 30%. Innovations in pipeline coatings and linings are extending asset lifespans, while automated pressure management is enhancing pipeline system optimization.
- This technological shift supports the growing demand for liquefied natural gas export and diversified refined product distribution. Furthermore, non-destructive testing and sophisticated flow assurance modeling are becoming standard for managing both traditional energy carrier conversion and emerging renewable energy carrier pipelines.
What challenges does the US Pipeline Transportation Industry face during its growth?
- Heightened regulatory scrutiny and ongoing jurisdictional conflicts present a key challenge impacting the pace of industry expansion.
- A major challenge involves managing aging infrastructure, where the implementation of advanced asset integrity management programs can reduce failure risks by up to 40%. The technical complexities of pipeline decommissioning and ensuring energy supply chain resilience add significant costs. Developing new capacity, including carbon capture pipelines and hydrogen pipeline infrastructure, faces regulatory hurdles that can delay projects by 2-3 years.
- Operators utilize hydraulic modeling software for pipeline risk assessment and computational fluid dynamics for optimizing slug catcher design. Effective pipeline right-of-way management and robust leak detection systems are essential for compliance, while managing terminal and storage operations for slurry pipeline transport introduces unique logistical issues.
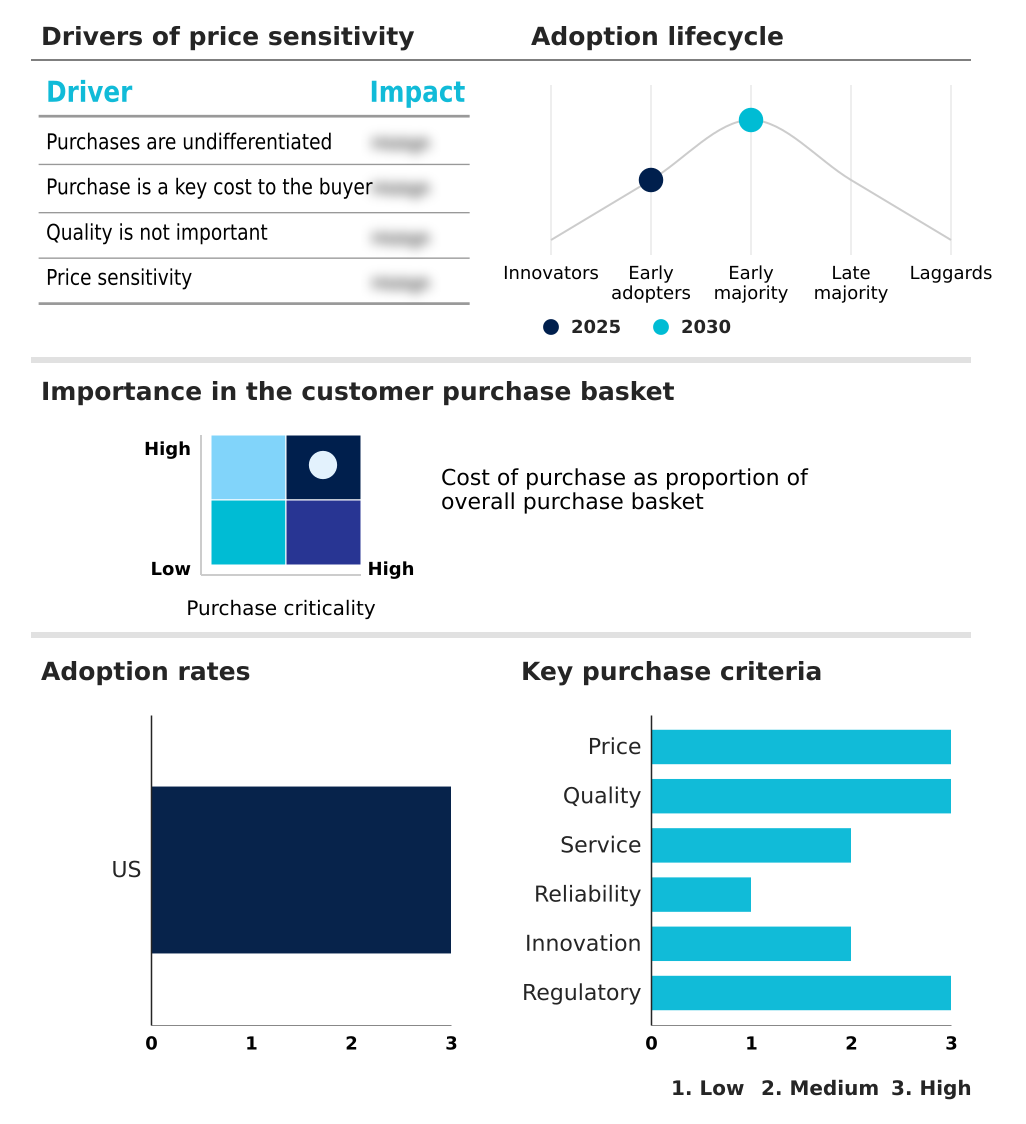
Exclusive Technavio Analysis on Customer Landscape
The us pipeline transportation market forecasting report includes the adoption lifecycle of the market, covering from the innovator’s stage to the laggard’s stage. It focuses on adoption rates in different regions based on penetration. Furthermore, the us pipeline transportation market report also includes key purchase criteria and drivers of price sensitivity to help companies evaluate and develop their market growth analysis strategies.
Customer Landscape of US Pipeline Transportation Industry
Competitive Landscape
Companies are implementing various strategies, such as strategic alliances, us pipeline transportation market forecast, partnerships, mergers and acquisitions, geographical expansion, and product/service launches, to enhance their presence in the industry.
BP Plc - Offers integrated crude oil and natural gas pipeline transport, supported by comprehensive energy logistics services for midstream operations.
The industry research and growth report includes detailed analyses of the competitive landscape of the market and information about key companies, including:
- BP Plc
- Cheniere Energy Inc.
- ConocoPhillips
- Enbridge Inc.
- Energy Transfer LP
- Enterprise Products Partners LP
- Equinor ASA
- Exxon Mobil Corp.
- Genesis Energy LP
- Kinder Morgan Inc.
- Marathon Petroleum Corp.
- MPLX LP
- ONEOK Inc.
- Plains All American Pipeline
- Shell plc
- Sunoco LP
- Tallgrass Energy LP
- The Williams Co. Inc
- TransCanada PipeLines Ltd.
- Valero Energy Corp.
Qualitative and quantitative analysis of companies has been conducted to help clients understand the wider business environment as well as the strengths and weaknesses of key industry players. Data is qualitatively analyzed to categorize companies as pure play, category-focused, industry-focused, and diversified; it is quantitatively analyzed to categorize companies as dominant, leading, strong, tentative, and weak.
Recent Development and News in Us pipeline transportation market
- In October, 2024, TC Energy completed the spinoff of its Liquids Pipelines business, creating South Bow Corporation. This strategic move allows TC Energy to focus on its core natural gas pipeline transportation operations and enhances its portfolio for focused growth.
- In December, 2024, ONEOK Inc. announced the completion of its MB-6 NGL fractionator and the full looping of the West Texas NGL Pipeline system. These projects significantly expand NGL transportation and fractionation capacity to support growing midstream demand.
- In January, 2025, Phillips 66 and Kinder Morgan Inc. advanced the Western Gateway Pipeline project after a successful open season secured long-term shipper commitments. The project will increase refined products transportation capacity to key western markets.
- In February, 2025, Cheniere Energy Inc. submitted a formal application to the Federal Energy Regulatory Commission to construct and operate the Corpus Christi Liquefaction Expansion Project. This highlights the ongoing commitment to enhancing transmission capacity for LNG exports.
Dive into Technavio’s robust research methodology, blending expert interviews, extensive data synthesis, and validated models for unparalleled US Pipeline Transportation Market insights. See full methodology.
| Market Scope | |
|---|---|
| Page number | 192 |
| Base year | 2025 |
| Historic period | 2020-2024 |
| Forecast period | 2026-2030 |
| Growth momentum & CAGR | Accelerate at a CAGR of 2.2% |
| Market growth 2026-2030 | USD 9481.6 million |
| Market structure | Fragmented |
| YoY growth 2025-2026(%) | 2.1% |
| Key countries | US |
| Competitive landscape | Leading Companies, Market Positioning of Companies, Competitive Strategies, and Industry Risks |
Research Analyst Overview
- The operational core of the pipeline transportation market is built on a complex suite of technologies designed to ensure safety and efficiency. Systems rely on supervisory control and data acquisition integrated with remote terminal units for centralized control, while SCADA security protocols are paramount for protecting critical infrastructure.
- Asset integrity management is achieved through a combination of smart pigging technology, non-destructive testing, and hydrostatic testing, with ultrasonic sensors providing granular data for material stress analysis. Advanced technologies like distributed acoustic sensing and fiber-optic sensing enable real-time integrity monitoring and geohazard risk assessment.
- Predictive maintenance algorithms, informed by data from pipeline strain monitoring, are crucial for boardroom decisions on capital allocation, demonstrating a 30% improvement in maintenance cost-efficiency over traditional schedules. From a technical standpoint, optimizing compression station efficiency, employing effective pipeline corrosion management, and utilizing advanced pipeline coatings and linings are essential.
- The market also focuses on environmental compliance monitoring, using methane leak detection and vapor recovery systems to meet regulatory standards.
What are the Key Data Covered in this US Pipeline Transportation Market Research and Growth Report?
-
What is the expected growth of the US Pipeline Transportation Market between 2026 and 2030?
-
USD 9.48 billion, at a CAGR of 2.2%
-
-
What segmentation does the market report cover?
-
The report is segmented by Type (Transmission, Distribution, Gathering, and Feeder), Application (Oil and gas, Chemical and petrochemical, and Others), Service (Maintenance and support service, Consulting service, and Managed service) and Geography (North America)
-
-
Which regions are analyzed in the report?
-
North America
-
-
What are the key growth drivers and market challenges?
-
Surge in global demand for energy exports, Heightened regulatory scrutiny and jurisdictional conflicts
-
-
Who are the major players in the US Pipeline Transportation Market?
-
BP Plc, Cheniere Energy Inc., ConocoPhillips, Enbridge Inc., Energy Transfer LP, Enterprise Products Partners LP, Equinor ASA, Exxon Mobil Corp., Genesis Energy LP, Kinder Morgan Inc., Marathon Petroleum Corp., MPLX LP, ONEOK Inc., Plains All American Pipeline, Shell plc, Sunoco LP, Tallgrass Energy LP, The Williams Co. Inc, TransCanada PipeLines Ltd. and Valero Energy Corp.
-
Market Research Insights
- The market's dynamism is rooted in its expansive midstream infrastructure logistics, which facilitate hydrocarbon transportation, crude oil transportation, and NGL transportation services. This network supports everything from natural gas liquids fractionation and crude oil blending to refined product logistics and petrochemical feedstock pipelines.
- A key focus is pipeline system optimization, with investments improving operational throughput efficiency by 12% and enhancing energy supply chain resilience. The expansion of gathering system networks and long-haul transmission networks supports interstate pipeline development and cross-border energy transport, crucial for liquefied natural gas export.
- The future involves adapting to energy carrier conversion, with projects for carbon capture pipelines and hydrogen pipeline infrastructure increasing by 25%, alongside managing terminal and storage operations for slurry pipeline transport.
We can help! Our analysts can customize this us pipeline transportation market research report to meet your requirements.
 RIA -
RIA - 
