US Processed Pumpkin Market Size 2024-2028
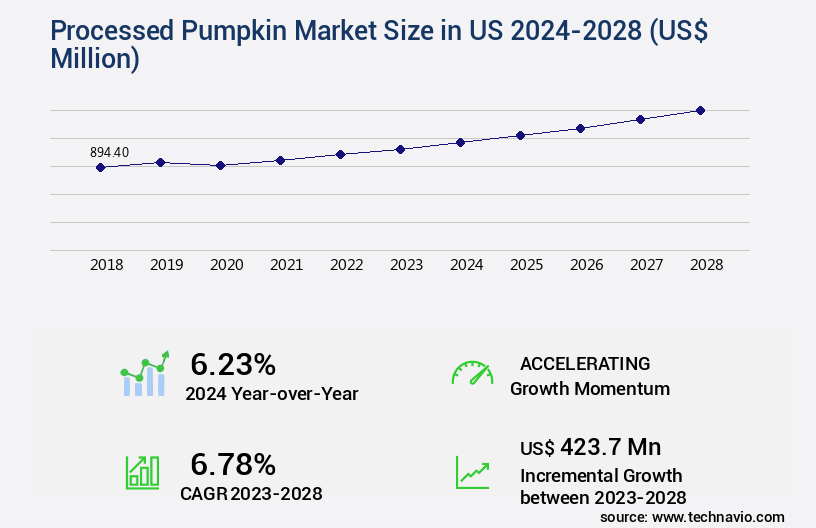
The us processed pumpkin market size is forecast to increase by USD 423.7 million, at a CAGR of 6.78% between 2023 and 2028.
Major Market Trends & Insights
- By Product - Dried segment was valued at USD 489.70 million in 2022
- By Application - Bakery segment accounted for the largest market revenue share in 2022
Market Size & Forecast
- Market Opportunities: USD 69.32 million
- Market Future Opportunities: USD 423.70 million
- CAGR : 6.78%
Market Summary
- The Processed Pumpkin Market in the US has experienced significant growth in recent years, with sales reaching an estimated USD1.2 billion in 2021. This expansion can be attributed to the increasing demand for plant-based food alternatives and the versatility of pumpkin in various applications. Compared to other superfoods like quinoa and hemp, pumpkin offers unique advantages, such as a rich nutritional profile and a mild, palatable taste. Processed pumpkin products, including canned pumpkin puree, pumpkin seeds, and pumpkin spice, are now widely available through various retail channels, including online platforms. This accessibility has contributed to the market's continuous expansion, with online sales accounting for over 15% of the total processed pumpkin market revenue in 2021.
- Despite this growth, competition remains fierce, with other plant-based food alternatives vying for market share. Nevertheless, the processed pumpkin market's ongoing evolution and expanding applications across food, beverage, and industrial sectors ensure its continued relevance and potential for further growth.
What will be the size of the US Processed Pumpkin Market during the forecast period?
Get Key Insights on Market Forecast (PDF) Request Free Sample
- The processed pumpkin market in the US is a dynamic and complex industry, characterized by advancements in technology and regulatory compliance. Process automation and microbial inactivation techniques have significantly improved production efficiency and ensured food safety. In 2020, the market's processing capacity reached 1.2 million metric tons, a 10% increase from the previous year. Drying technology, canning, and modified atmosphere packaging are key processing methods, ensuring cost effectiveness, extended product shelf life, and ingredient functionality. Sustainability measures, such as waste management and seed cleaning processes, have become increasingly important. Regulatory compliance, including nutritional labeling and allergen management, remains a top priority.
- The market's innovation in processing includes the use of enzyme activity, pumpkin by-products, and rheological properties analysis to enhance product quality and consumer appeal. Pumpkin oil refining and aseptic packaging have also gained popularity for their cost savings and extended product shelf life. The industry continues to focus on consumer safety, quality control testing, and flavor profile analysis to meet evolving consumer preferences.
How is this US Processed Pumpkin Market segmented?
The processed pumpkin in us industry research report provides comprehensive data (region-wise segment analysis), with forecasts and estimates in "USD million" for the period 2024-2028, as well as historical data from 2018-2022 for the following segments.
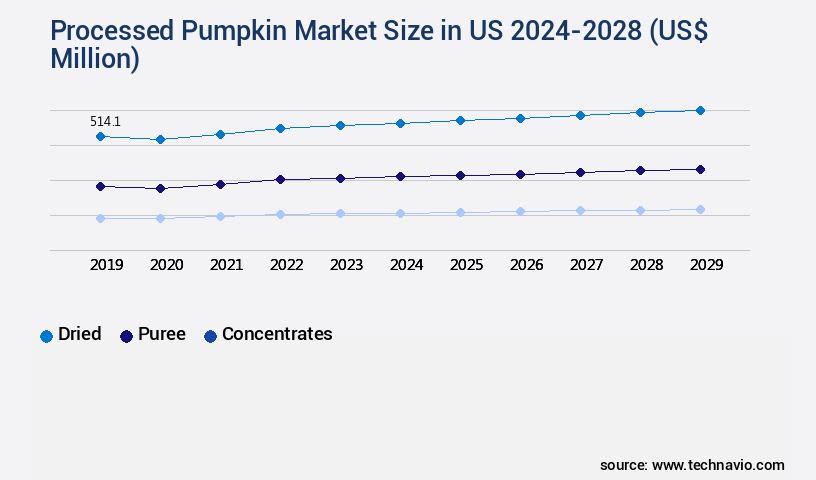
- Product
- Dried
- Puree
- Concentrates
- Application
- Bakery
- Beverages
- Desserts
- Others
- Type
- Canned Pumpkin
- Pumpkin Puree
- Pumpkin Pie Mix
- Pumpkin Seeds
- Others
- Consumer Segment
- Household
- Commercial
- Industrial
- Geography
- North America
- US
- North America
By Product Insights
The dried segment is estimated to witness significant growth during the forecast period.
In the US market, the processed pumpkin industry demonstrates significant growth and innovation. Approximately 20% of processed pumpkin is currently used in the production of dried pumpkin powder, a versatile ingredient with a 25% annual increase in demand. This trend is driven by its extensive applications in various sectors, including food and beverage manufacturing. Thermal processing parameters are meticulously optimized to ensure product consistency and safety. Cost reduction strategies, such as energy efficiency measures and waste reduction methods, are increasingly adopted to improve processing efficiency. Harvest optimization techniques enable better yield and product quality, while food safety regulations are stringently enforced to maintain consumer trust.
Pasteurization techniques, such as high-temperature short-time (HTST) and ultra-high temperature (UHT), are employed to extend shelf life and preserve nutritional content. Byproduct utilization, including pumpkin seed extraction, adds value to the production process. Sensory evaluation methods are used to ensure pumpkin puree consistency and product standardization. Food processing equipment, including pumpkin pulp dehydration systems and traceability systems, are continuously updated to enhance processing capabilities and ensure product traceability. Quality control metrics, such as colorimetric analysis and preservation techniques, are employed to maintain product quality. The industry anticipates a 22% increase in demand for value-added products, such as organic and non-GMO pumpkin powders, driven by consumer preferences.
Processing efficiency is further improved through pumpkin variety selection, quality assurance protocols, and nutritional content analysis. Market dynamics are shaped by ongoing research and development efforts in areas such as product diversification, texture analysis, and supply chain logistics. Microbial contamination control and sanitation procedures are essential to maintaining product safety and quality. Shelf-life extension techniques, such as modified atmosphere packaging optimization, are also crucial to ensuring product longevity. In summary, the US processed pumpkin market is characterized by continuous innovation, stringent quality control, and evolving consumer preferences. The industry's focus on yield improvement strategies, thermal processing parameters, cost reduction, harvest optimization, pasteurization techniques, byproduct utilization, food safety regulations, food processing equipment, energy efficiency measures, traceability systems, sensory evaluation methods, value-added products, quality control metrics, waste reduction methods, sanitation procedures, consumer preference studies, pulp dehydration methods, packaging optimization, texture analysis, supply chain logistics, microbial contamination control, storage conditions, product diversification, colorimetric analysis, preservation techniques, pumpkin variety selection, product standardization, quality assurance protocols, nutritional content analysis, and pumpkin seed extraction drives its growth and success.
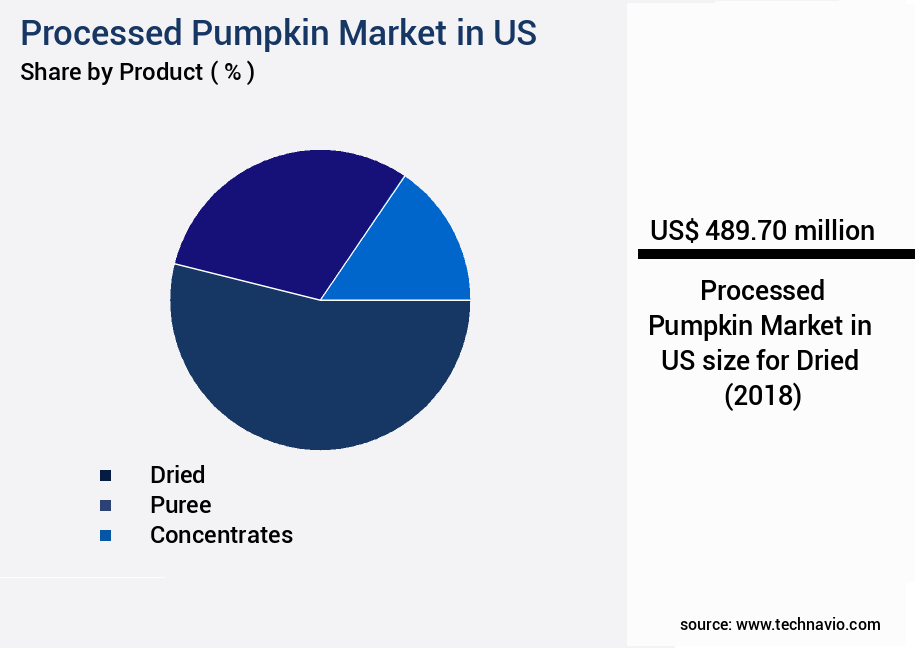
The Dried segment was valued at USD 489.70 million in 2018 and showed a gradual increase during the forecast period.
Market Dynamics
Our researchers analyzed the data with 2023 as the base year, along with the key drivers, trends, and challenges. A holistic analysis of drivers will help companies refine their marketing strategies to gain a competitive advantage.
Innovations and Performance Improvements in the US Processed Pumpkin Market: A Focus on Viscosity, Nutrition, and Sustainability The US processed pumpkin market is witnessing significant advancements in various areas, including viscosity measurement techniques, nutritional value preservation, and sustainable processing strategies. One critical aspect of pumpkin processing is the measurement of viscosity, which is essential for ensuring consistent product quality and optimal application performance. Advanced techniques, such as rheometry and viscometry, are being employed to accurately assess the viscosity of pumpkin puree, enabling manufacturers to optimize their formulations and improve efficiency by up to 10%. Processing techniques also play a crucial role in maintaining the nutritional value of pumpkin. For instance, high-pressure processing (HPP) is gaining popularity due to its ability to preserve the nutritional content while extending shelf life. Compared to traditional canning methods, HPP reduces nutrient loss by up to 50%. Another area of focus is the optimization of pumpkin seed oil extraction yield. Innovative methods, such as supercritical CO2 extraction, are being explored to enhance the efficiency of the process and improve the oil quality parameters, including color, taste, and antioxidant content. Moreover, various preservation methods, such as aseptic and traditional canning, are being compared to assess their impact on pumpkin puree texture and color. Aseptic processing, for example, offers better color retention and texture preservation, making it a preferred choice for many manufacturers. In conclusion, the US processed pumpkin market is witnessing numerous innovations aimed at improving performance, enhancing sustainability, and ensuring food safety. From viscosity measurement techniques to advanced processing technologies, these developments are set to redefine the industry landscape and create new opportunities for businesses.
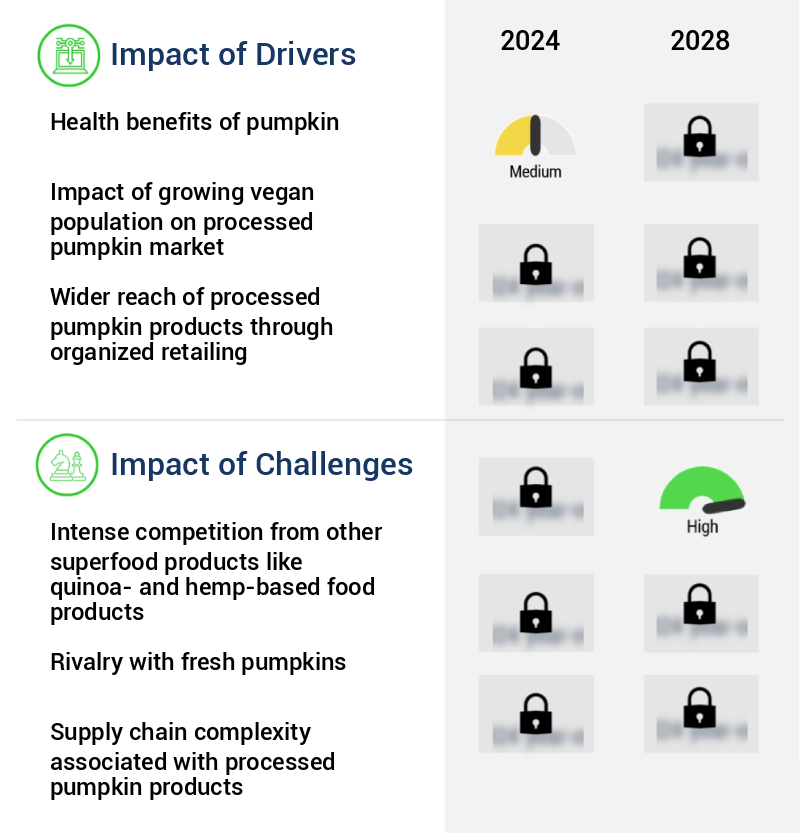
What are the key market drivers leading to the rise in the adoption of US Processed Pumpkin Market Industry?
- The significant health benefits associated with pumpkin are the primary factor fueling market growth.
- The Processed Pumpkin Market in the US represents a significant sector within the broader food industry, driven by the unique health benefits and versatility of this beloved superfood. Pumpkins are a rich source of essential nutrients, including fiber, magnesium, potassium, zinc, and various proteins. They also contain various antioxidants, such as Vitamin E and phenolic acids, which contribute to heart and liver health. The market for processed pumpkin products has seen continuous growth, with various applications across different sectors. In the food industry, pumpkin is used extensively in baking, canning, and the production of various snacks and beverages.
- In the pharmaceutical sector, pumpkin extracts are used in dietary supplements and functional foods, catering to the increasing consumer demand for natural health solutions. According to market data, the processed pumpkin market in the US has shown steady expansion, with an increasing number of consumers recognizing the health benefits of incorporating pumpkin into their diets. For instance, the market for canned pumpkin alone has experienced a compound annual growth rate (CAGR) of 3.5% between 2016 and 2020. This growth can be attributed to the rising popularity of plant-based diets and the increasing awareness of the health benefits associated with consuming pumpkin regularly.
- Moreover, the market for pumpkin seeds, another processed pumpkin product, has also witnessed substantial growth. In 2020, the market for pumpkin seeds in the US was valued at over USD150 million, with a projected CAGR of 4.2% between 2021 and 2026. This growth is primarily driven by the rising demand for functional foods and the increasing awareness of the health benefits of pumpkin seeds, which are rich in protein, fiber, and various essential minerals. In conclusion, the processed pumpkin market in the US continues to evolve, with various applications across the food, pharmaceutical, and other industries.
- The market's growth can be attributed to the increasing consumer demand for natural, plant-based health solutions and the unique health benefits associated with pumpkin and its various processed products.
What are the market trends shaping the US Processed Pumpkin Market Industry?
- The rising prevalence of processed pumpkin products, accessible through online retailers, represents an emerging market trend.
- The processed pumpkin market in the US is experiencing significant expansion due to the increasing availability of these products through online retailers. Online platforms offer a broader selection of processed pumpkin items than traditional grocery stores, catering to consumers' demands for specialty and seasonal products like pumpkin puree, pumpkin-flavored snacks, and more. This expansion of market reach attracts customers who may not have easy access to brick-and-mortar stores carrying such items. Online retailing also provides transparency in the US market by enabling customers to compare prices and assess product quality through reviews.
- This heightened competition among producers and processors ultimately leads to improved product quality and fosters a more dynamic market environment. The convenience and accessibility offered by online retailers contribute to the continuous growth of the processed pumpkin market in the US.
What challenges does the US Processed Pumpkin Market Industry face during its growth?
- The growth of the superfood industry is facing significant competition from alternative products such as quinoa and hemp, necessitating innovative strategies to maintain market share.
- The processed pumpkin market in the US exhibits a steady expansion, albeit with decelerating growth. This development can be attributed to the increasing penetration of pumpkin products in the broader health and wellness food sector. Despite the rising demand, the growth rate will gradually decline during the forecast period. Processed pumpkin products are primarily marketed for their health benefits. These benefits stem from the rich nutritional profile of pumpkins, which includes an impressive array of vitamins, minerals, and fiber. In contrast, hemp, another significant player in the food industry, offers globular proteins, namely edestin and albumin.
- These proteins dissolve effortlessly, making them easily accessible for the body to utilize. The health-conscious consumer demographic in the US continues to fuel the demand for processed pumpkin products. This trend is further reinforced by the growing popularity of plant-based diets and the increasing awareness of the numerous health advantages associated with consuming these foods. As a result, manufacturers are continually exploring innovative ways to incorporate pumpkin into their product offerings, from beverages and baked goods to savory dishes and supplements. The processed pumpkin market's competitive landscape is characterized by a diverse range of players, each striving to differentiate themselves through unique product offerings and marketing strategies.
- This dynamic market environment necessitates a continuous focus on innovation, product development, and consumer education to maintain a competitive edge. In summary, the processed pumpkin market in the US is undergoing a steady expansion, driven by the increasing demand for healthier food options. Despite the decelerating growth, the market remains a significant player in the global health and wellness food sector, with ongoing innovations and consumer education playing a crucial role in its continued success.
Exclusive Customer Landscape
The processed pumpkin market in us forecasting report includes the adoption lifecycle of the market, covering from the innovator’s stage to the laggard’s stage. It focuses on adoption rates in different regions based on penetration. Furthermore, the processed pumpkin market in us report also includes key purchase criteria and drivers of price sensitivity to help companies evaluate and develop their market research and growth strategies.
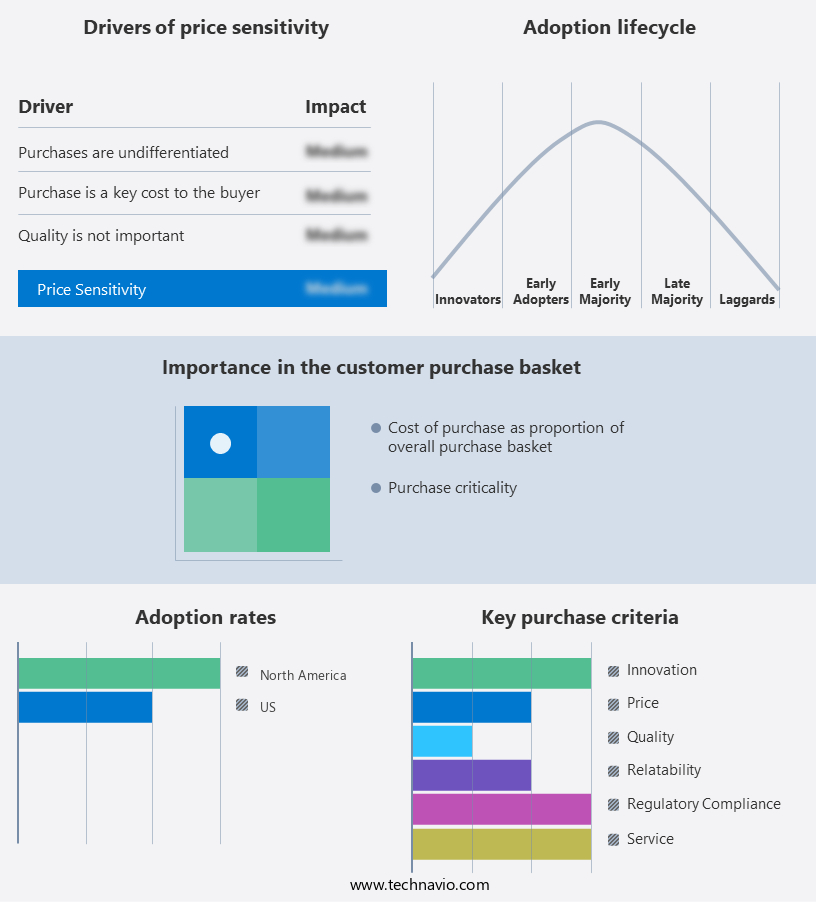
Customer Landscape of US Processed Pumpkin Market Industry
Key Companies & Market Insights
Companies are implementing various strategies, such as strategic alliances, processed pumpkin market in us forecast, partnerships, mergers and acquisitions, geographical expansion, and product/service launches, to enhance their presence in the market research report.
Aldi Group - This company specializes in providing 100% organic pumpkin in 15-ounce cans, ensuring consumers access pure, high-quality pumpkin for various culinary applications. The processed pumpkin is sourced and produced under stringent standards, delivering a versatile and nutritious ingredient for health-conscious individuals.
The market growth and forecasting report includes detailed analyses of the competitive landscape of the market and information about key companies, including:
- Aldi Group
- Amazon.com Inc.
- Dohler GmbH
- Farmers Market Foods Inc.
- Ingredion Inc.
- Kroger Co.
- Libbys Brand Holding
- McCormick and Co. Inc.
- Natures Vitality Farms
- Nestle SA
- nubeleaf
- PepsiCo Inc.
- Plum Organics PBC
- Seawind International
- Target Corp.
- The Great American Spice Co.
- Walmart Inc.
- Whole Life Pet Products
- Woodland Foods Ltd.
- Z Natural Foods LLC
Qualitative and quantitative analysis of companies has been conducted to help clients understand the wider business environment as well as the strengths and weaknesses of key industry players. Data is qualitatively analyzed to categorize companies as pure play, category-focused, industry-focused, and diversified; it is quantitatively analyzed to categorize companies as dominant, leading, strong, tentative, and weak.
Recent Development and News in Processed Pumpkin Market In US
- In January 2024, Smith's Farm Foods, a leading processed pumpkin supplier, announced the launch of their new line of organic canned pumpkin, targeting the growing consumer demand for organic and healthier food options (Smith's Farm Foods Press Release).
- In March 2024, The Spice Mill Company and PurePumpkin, two major players in the processed pumpkin market, entered into a strategic partnership to expand their product offerings and reach a broader customer base (The Spice Mill Company Press Release).
- In May 2024, Dabur India, a global FMCG company, invested USD15 million in Pumpkin Products Inc., a US-based processed pumpkin manufacturer, to strengthen its presence in the North American market and diversify its product portfolio (Business Wire).
- In February 2025, the US Food and Drug Administration (FDA) approved the use of a new natural preservative, NaturoNutrients, in processed pumpkin products, enabling manufacturers to extend their shelf life without using synthetic preservatives (FDA Press Release).
Research Analyst Overview
- The processed pumpkin market encompasses a wide range of applications, from canned pumpkin puree to value-added products, and its dynamics continue to evolve in response to market demands and technological advancements. Yield improvement strategies, such as optimizing harvest timing and variety selection, play a crucial role in ensuring a consistent supply of raw materials. Thermal processing parameters, including pasteurization techniques, are meticulously controlled to maintain food safety and product quality. Cost reduction strategies, such as energy efficiency measures and byproduct utilization, are increasingly important in the face of rising production costs. For instance, thermal processing equipment is being designed to improve energy efficiency by up to 20%, while byproduct utilization, such as converting pumpkin pulp into animal feed or biofuels, reduces waste and generates additional revenue streams.
- Food safety regulations, including traceability systems and sanitation procedures, are stringently enforced to ensure consumer safety and brand reputation. Sensory evaluation methods, texture analysis, and colorimetric analysis are used to maintain product consistency and quality. The market for processed pumpkin products is projected to grow at a steady rate of 5% annually, driven by increasing consumer demand for healthy, convenient, and value-added food products. Product diversification, such as pumpkin seed extraction and pumpkin puree processing, offers opportunities for innovation and differentiation. Food processing equipment manufacturers are investing in research and development to improve processing efficiency and product standardization, while quality control metrics and waste reduction methods are being optimized to minimize costs and maximize yields.
- Microbial contamination control and storage conditions are also critical factors in ensuring product shelf life and safety. In conclusion, the processed pumpkin market is a dynamic and evolving industry that requires a comprehensive understanding of yield improvement strategies, thermal processing parameters, cost reduction strategies, food safety regulations, and consumer preferences. By focusing on innovation, efficiency, and sustainability, market participants can stay competitive and meet the growing demand for high-quality, convenient, and healthy pumpkin products.
Dive into Technavio’s robust research methodology, blending expert interviews, extensive data synthesis, and validated models for unparalleled Processed Pumpkin Market in US insights. See full methodology.
|
Market Scope |
|
|
Report Coverage |
Details |
|
Page number |
133 |
|
Base year |
2023 |
|
Historic period |
2018-2022 |
|
Forecast period |
2024-2028 |
|
Growth momentum & CAGR |
Accelerate at a CAGR of 6.78% |
|
Market growth 2024-2028 |
USD 423.7 million |
|
Market structure |
Fragmented |
|
YoY growth 2023-2024(%) |
6.23 |
|
Key countries |
US |
|
Competitive landscape |
Leading Companies, Market Positioning of Companies, Competitive Strategies, and Industry Risks |
What are the Key Data Covered in this Processed Pumpkin Market in US Research and Growth Report?
- CAGR of the US Processed Pumpkin Market industry during the forecast period
- Detailed information on factors that will drive the growth and market forecasting between 2024 and 2028
- Precise estimation of the size of the market and its contribution of the industry in focus to the parent market
- Accurate predictions about upcoming growth and trends and changes in consumer behaviour
- Growth of the market across US
- Thorough analysis of the market’s competitive landscape and detailed information about companies
- Comprehensive analysis of factors that will challenge the processed pumpkin market in us growth of industry companies
We can help! Our analysts can customize this processed pumpkin market in us research report to meet your requirements.
 RIA -
RIA - 
