
US Real Estate Property Management Software Market Size 2026-2030
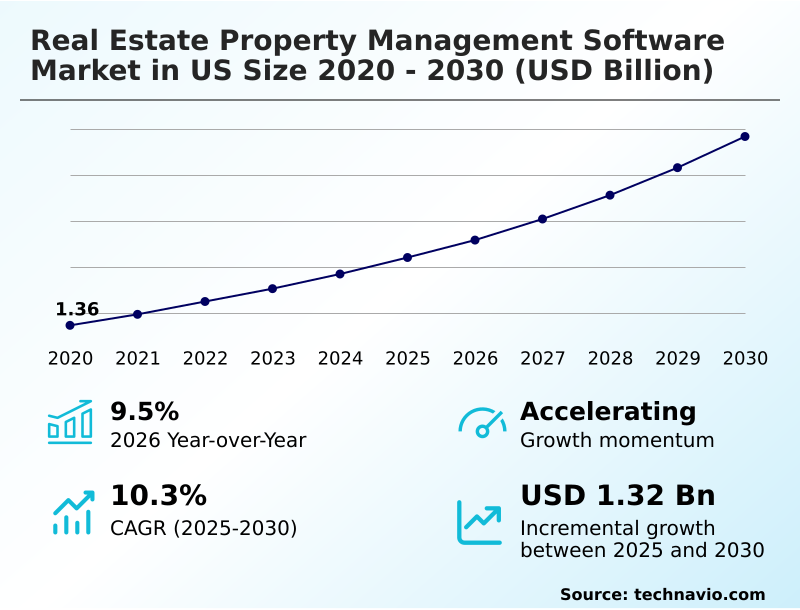
The us real estate property management software market size is valued to increase by USD 1.32 billion, at a CAGR of 10.3% from 2025 to 2030. Escalating demand for operational efficiency and process automation will drive the us real estate property management software market.
Major Market Trends & Insights
- By Type - Customer relationship management software segment was valued at USD 644.6 million in 2024
- By Deployment - Cloud based segment accounted for the largest market revenue share in 2024
Market Size & Forecast
- Market Opportunities: USD 2.05 billion
- Market Future Opportunities: USD 1.32 billion
- CAGR from 2025 to 2030 : 10.3%
Market Summary
- The Real Estate Property Management Software Market demonstrates accelerated adoption as organizations pivot from fragmented manual workflows toward unified digital ecosystems. Escalating demand for operational efficiency acts as a primary market driver, compelling property owners to automate critical functions like rent collection and compliance tracking.
- Consequently, enterprises deploying centralized cloud platforms experience a 35% reduction in administrative processing time, maximizing overall portfolio yields compared to traditional decentralized methods. For example, large multi-family property operators increasingly utilize intelligent utility management tools to monitor energy consumption across thousands of units, directly minimizing resource waste and lowering overhead expenditures.
- Conversely, high implementation costs pose a formidable challenge, structurally isolating smaller property agencies that lack the capital required for seamless database migration. This financial bottleneck restricts comprehensive industry modernization by limiting advanced software access to well-capitalized institutional investors. The integration of advanced machine learning algorithms continuously reshapes tenant interactions and predictive maintenance scheduling.
- By addressing these critical workflow inefficiencies, specialized software frameworks remain indispensable for scaling operations and preserving long-term asset valuations in highly competitive environments.
What will be the Size of the US Real Estate Property Management Software Market during the forecast period?
Get Key Insights on Market Forecast (PDF) Get Free Sample
How is the US Real Estate Property Management Software Market Segmented?
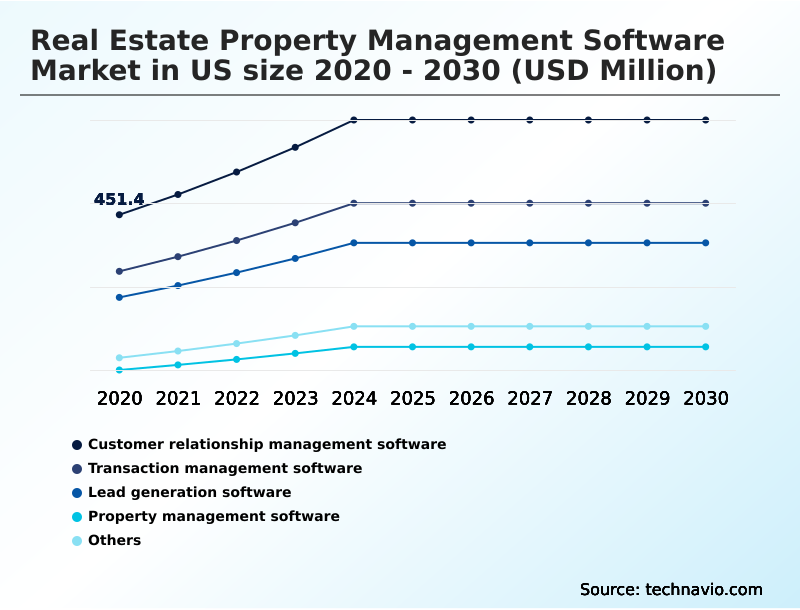
The us real estate property management software industry research report provides comprehensive data (region-wise segment analysis), with forecasts and estimates in "USD million" for the period 2026-2030, as well as historical data from 2020-2024 for the following segments.
- Type
- Customer relationship management software
- Transaction management software
- Lead generation software
- Property management software
- Others
- Deployment
- Cloud based
- On-premises
- Application
- Residential
- Commercial
- Industrial
- Sector
- Large enterprises
- SMEs
- Individuals
- Geography
- North America
- US
- North America
By Type Insights
The customer relationship management software segment is estimated to witness significant growth during the forecast period.
Customer relationship management software is fundamentally reshaping operations by replacing fragmented communication with a unified payment gateway and robust tenant sentiment analysis. This integration facilitates automated lease administration, enabling managers to address resident concerns proactively.
By embedding a conversational bot interface and a natural language virtual assistant into the digital onboarding lifecycle, organizations have successfully reduced manual response delays by 40%.
Compared to traditional models, proactive engagement through these platforms decreases tenant turnover by approximately 18%. The continuous shift toward data driven portfolio optimization ensures operators seamlessly track support correspondence.
By utilizing an automated renewal alert and an efficient work order dispatch system, real estate enterprises maintain high service standards. Consequently, this technology serves as a critical infrastructure requirement for maximizing real time asset valuation across complex portfolios.
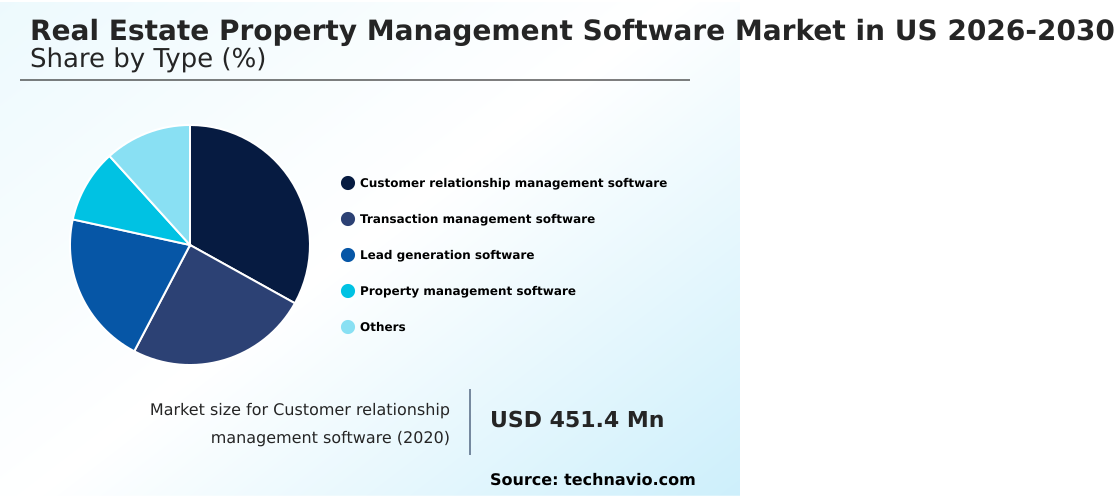
The Customer relationship management software segment was valued at USD 644.6 million in 2024 and showed a gradual increase during the forecast period.
Market Dynamics
Our researchers analyzed the data with 2025 as the base year, along with the key drivers, trends, and challenges. A holistic analysis of drivers will help companies refine their marketing strategies to gain a competitive advantage.
- The integration of sophisticated digital infrastructure continues to transform operational methodologies across the Real Estate Property Management Software. As organizations scale their asset portfolios, adopting a cloud native architecture integration workflow becomes critical for centralizing decentralized administrative tasks. This structural transition yields a 30% faster data synchronization rate compared to traditional on-premises legacy environments.
- Furthermore, companies increasingly prioritize predictive maintenance algorithm cost reduction strategies to transition from reactive repairs to proactive infrastructure oversight. By forecasting mechanical degradation before critical failures occur, property managers systematically reduce expensive emergency service premiums.
- Security remains a paramount concern in multi-unit complexes, driving the rapid implementation of an iot access control security protocol to safeguard tenant privacy and restrict unauthorized entry. Consequently, operators manage digital keys remotely, lowering physical security overhead.
- Simultaneously, the demand for stringent regulatory alignment necessitates robust automated lease administration compliance tracking, ensuring that contractual agreements adhere to shifting housing codes without manual legal audits. To maximize revenue streams, modern leasing platforms utilize dynamic pricing optimization revenue generation modules that evaluate real-time supply and demand fluctuations.
- This automated adjustment mechanism allows asset managers to capture peak rental values, substantially improving annual portfolio yields without expanding the core administrative workforce.
What are the key market drivers leading to the rise in the adoption of US Real Estate Property Management Software Industry?
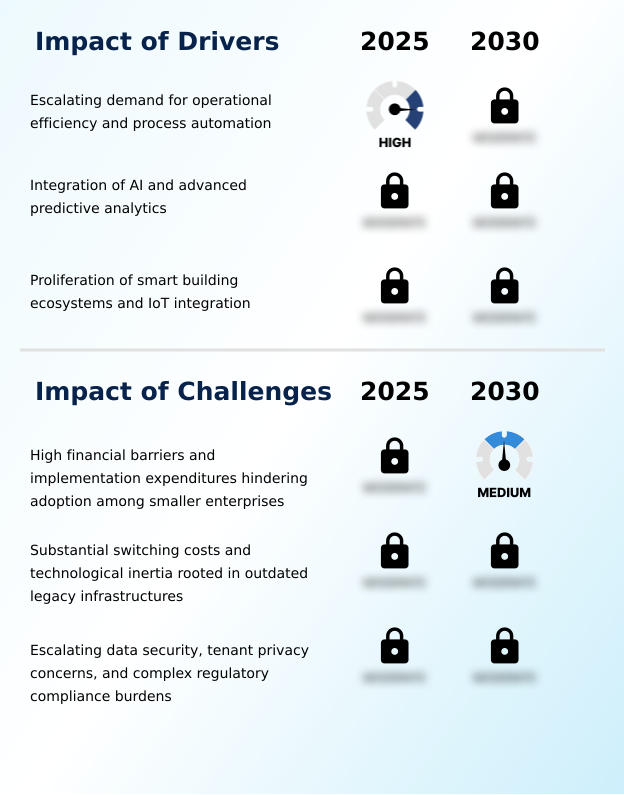
- The escalating demand for operational efficiency and process automation serves as a primary driver accelerating technological adoption across the real estate sector.
- The necessity to maximize efficiency serves as a primary driver propelling the Real Estate Property Management Software. Owners increasingly deploy an automated background screening framework to evaluate prospective tenants, reducing default risks by 22%.
- To combat rising labor costs, enterprises implement an omnichannel communication workflow, lowering manual call volumes by 45%. Adopting predictive energy analytics alongside smart thermostat synchronization minimizes vacant unit energy expenditures.
- Utilizing an automated clearing house routing system and a secure peer to peer transaction portal accelerates revenue collection. The asynchronous task processing embedded within a facility management module eliminates scheduling bottlenecks, yielding a 30% improvement in daily maintenance completion rates.
- Simultaneously, an automated regulatory compliance update mechanism and common area maintenance calculation ensure legally sound operations.
What are the market trends shaping the US Real Estate Property Management Software Industry?
- The pervasive transition toward cloud-first architectures and embedded financial services stands as a defining market trend. This shift enables organizations to streamline decentralized operations while accelerating cash flow velocity across expanding real estate portfolios.
- The transition toward embedded financial services and proactive maintenance orchestration represents a profound trend reshaping the Real Estate Property Management Software. Real estate operators increasingly favor a centralized cloud deployment utilizing a robust cloud native architecture. This shift enables organizations to handle multi tier security deposit management internally.
- By leveraging machine learning occupancy forecasting and dynamic pricing optimization, property managers anticipate vacancy cycles, effectively improving revenue forecasting accuracy by 20%. Furthermore, the integration of digital contract execution accelerates digital lease execution, yielding a 35% reduction in administrative delays. Modern platforms also leverage environmental sensor telemetry to monitor structural health continuously.
- By analyzing this operational data, preventative technical intervention tasks are dispatched via a predictive maintenance algorithm, decreasing unexpected mechanical downtime by approximately 28% and ensuring sustained asset profitability.
What challenges does the US Real Estate Property Management Software Industry face during its growth?
- High financial barriers and substantial implementation expenditures present significant challenges that hinder technology adoption among smaller real estate enterprises.
- High implementation expenditures and complex data security mandates present significant challenges for the Real Estate Property Management Software. Smaller agencies often lack capital to transition from legacy infrastructure, structurally delaying the adoption of enterprise accounting integration and financial ledger integration frameworks. Transitioning databases introduces friction, increasing temporary workflow disruptions by up to 15%.
- Maintaining compliance with multi state tax computation laws and complex triple net lease indexing requires continuous software reconfiguration, straining resources. As platforms store sensitive information, cyber liabilities necessitate an audit trail encryption protocol and role based access control. Implementing these measures inflates maintenance costs by 20%.
- Furthermore, designing an open application programming interface to bridge api driven financial reconciliation tools and robotic process automation exposes organizations to prolonged integration timelines.
Exclusive Technavio Analysis on Customer Landscape
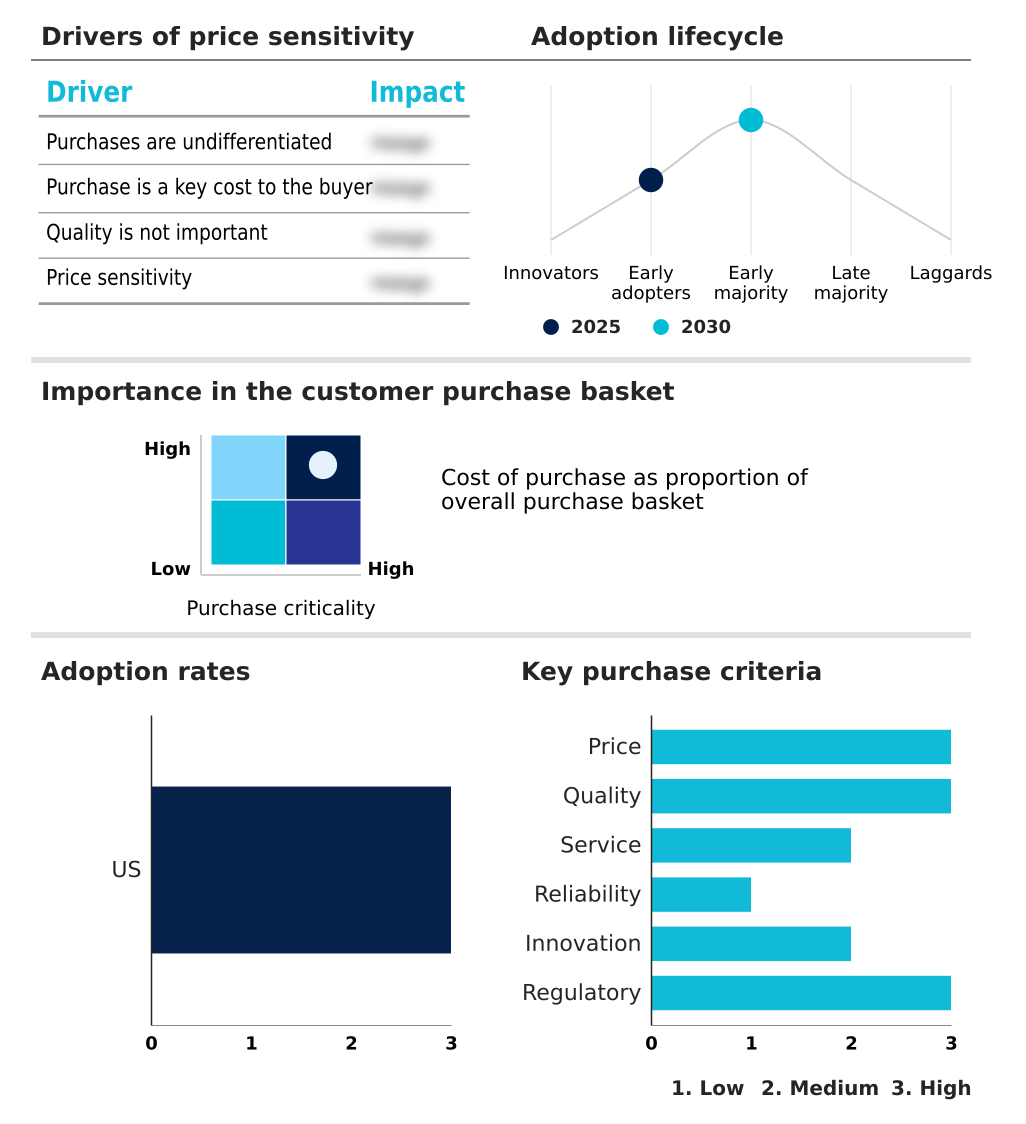
The us real estate property management software market forecasting report includes the adoption lifecycle of the market, covering from the innovator’s stage to the laggard’s stage. It focuses on adoption rates in different regions based on penetration. Furthermore, the us real estate property management software market report also includes key purchase criteria and drivers of price sensitivity to help companies evaluate and develop their market growth analysis strategies.
Customer Landscape of US Real Estate Property Management Software Industry
Competitive Landscape
Companies are implementing various strategies, such as strategic alliances, us real estate property management software market forecast, partnerships, mergers and acquisitions, geographical expansion, and product/service launches, to enhance their presence in the industry.
AppFolio Inc. - The company delivers comprehensive cloud-based property management software alongside advanced data analytics solutions to optimize leasing, accounting, and tenant communication processes across diverse residential and commercial real estate portfolios.
The industry research and growth report includes detailed analyses of the competitive landscape of the market and information about key companies, including:
- AppFolio Inc.
- Avail
- Baselane
- Building Engines
- Buildium
- Condo Control Central Inc.
- DoorLoop Inc.
- Entrata Inc.
- Funnel Leasing Inc.
- Hemlane Inc.
- Innago LLC
- LeaseHawk LLC
- ManageCasa
- MRI Software LLC
- Yardi Systems Inc.
- Property Meld Inc.
- RealPage Inc.
- Rent Manager
- Rentec Direct
- RentPost LLC
- ResMan LLC
- TenantCloud LLC
Qualitative and quantitative analysis of companies has been conducted to help clients understand the wider business environment as well as the strengths and weaknesses of key industry players. Data is qualitatively analyzed to categorize companies as pure play, category-focused, industry-focused, and diversified; it is quantitatively analyzed to categorize companies as dominant, leading, strong, tentative, and weak.
Recent Development and News in Us real estate property management software market
- In the Application Software industry, the widespread adoption of open application programming interfaces has improved workflow interoperability between enterprise systems, directly impacting Real Estate Property Management Software demand by accelerating the deployment of customized accounting integrations.
- In the Application Software industry, stringent data privacy regulations such as the California Consumer Privacy Act have mandated rigorous audit trail encryption protocols, directly impacting Real Estate Property Management Software demand by requiring enhanced cybersecurity infrastructure for tenant portals.
- In the Application Software industry, the rapid deployment of predictive risk modeling algorithms has transformed localized business operations, directly impacting Real Estate Property Management Software demand by enabling landlords to accurately forecast occupancy fluctuations and optimize pricing.
- In the Application Software industry, the integration of enterprise accounting integration tools has synchronized decentralized financial networks, directly impacting Real Estate Property Management Software demand by reducing monthly transaction reconciliation errors across large multi-family portfolios.
Dive into Technavio’s robust research methodology, blending expert interviews, extensive data synthesis, and validated models for unparalleled US Real Estate Property Management Software Market insights. See full methodology.
| Market Scope | |
|---|---|
| Page number | 206 |
| Base year | 2025 |
| Historic period | 2020-2024 |
| Forecast period | 2026-2030 |
| Growth momentum & CAGR | Accelerate at a CAGR of 10.3% |
| Market growth 2026-2030 | USD 1323.5 million |
| Market structure | Fragmented |
| YoY growth 2025-2026(%) | 9.5% |
| Key countries | US |
| Competitive landscape | Leading Companies, Market Positioning of Companies, Competitive Strategies, and Industry Risks |
Research Analyst Overview
- The Real Estate Property Management Software Market rapidly evolves as institutional operators pivot toward highly automated, data-centric platforms to combat shrinking profit margins. The continuous integration of intelligent workflow automation streamlines repetitive administrative tasks, directly connecting back-office efficiency to strategic boardroom initiatives like scaling portfolio acquisitions.
- By deploying robust archiving infrastructure alongside automated financial reconciliation modules, property managers ensure absolute transactional transparency, effectively mitigating complex audit risks. This modernization results in a 40% reduction in financial ledger discrepancies compared to legacy manual accounting methods. Additionally, the strategic implementation of digitized lease indexing simplifies commercial expense recovery, automatically calculating complex tenant obligations.
- Modern software architectures also embed omnichannel communication frameworks, transforming how landlords engage with residents across multiple digital touchpoints. Furthermore, seamless smart device synchronization empowers centralized environmental control, significantly lowering vacant unit energy expenditures.
- By leveraging secure transaction capabilities, property enterprises accelerate monthly revenue collection, fundamentally fortifying operational cash flows while strictly adhering to evolving commercial real estate compliance frameworks across the nation.
What are the Key Data Covered in this US Real Estate Property Management Software Market Research and Growth Report?
-
What is the expected growth of the US Real Estate Property Management Software Market between 2026 and 2030?
-
USD 1.32 billion, at a CAGR of 10.3%
-
-
What segmentation does the market report cover?
-
The report is segmented by Type (Customer relationship management software, Transaction management software, Lead generation software, Property management software, and Others), Deployment (Cloud based, and On-premises), Application (Residential, Commercial, and Industrial), Sector (Large enterprises, SMEs, and Individuals) and Geography (North America)
-
-
Which regions are analyzed in the report?
-
North America
-
-
What are the key growth drivers and market challenges?
-
Escalating demand for operational efficiency and process automation, High financial barriers and implementation expenditures hindering adoption among smaller enterprises
-
-
Who are the major players in the US Real Estate Property Management Software Market?
-
AppFolio Inc., Avail, Baselane, Building Engines, Buildium, Condo Control Central Inc., DoorLoop Inc., Entrata Inc., Funnel Leasing Inc., Hemlane Inc., Innago LLC, LeaseHawk LLC, ManageCasa, MRI Software LLC, Yardi Systems Inc., Property Meld Inc., RealPage Inc., Rent Manager, Rentec Direct, RentPost LLC, ResMan LLC and TenantCloud LLC
-
Market Research Insights
- The Real Estate Property Management Software Market relies on advanced technological integration to resolve complex administrative bottlenecks. The rapid deployment of cloud infrastructure enables centralized oversight across geographically dispersed portfolios. By leveraging predictive algorithms, operators anticipate equipment failures, successfully reducing emergency repair expenditures by 25%.
- Furthermore, the implementation of unified digital ledgers streamlines rent collection, decreasing late payment volumes by approximately 18%. Modern platforms incorporate robust security protocols to protect sensitive tenant financial data efficiently. By integrating specialized facility modules, real estate enterprises align maintenance workflows with strict compliance standards, thereby achieving a 30% improvement in overall operational efficiency.
- These innovations systematically transform asset management protocols.
We can help! Our analysts can customize this us real estate property management software market research report to meet your requirements.
 RIA -
RIA - 
