US Yogurt Market Size 2024-2028
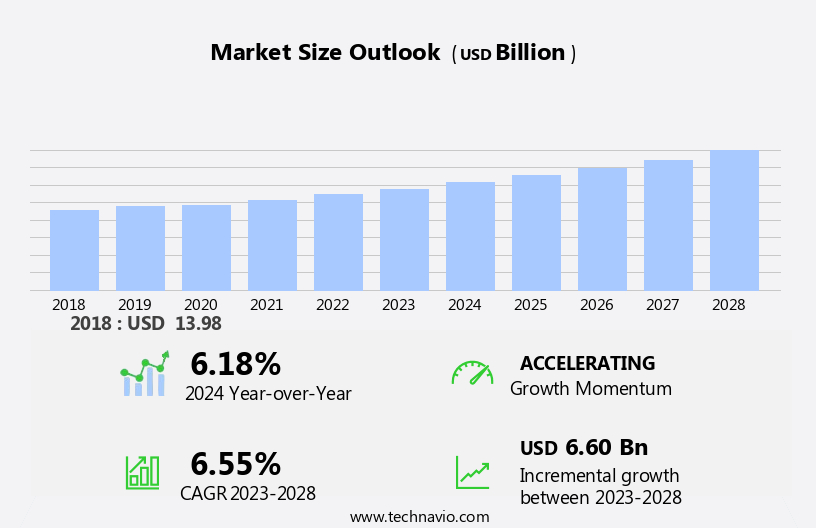
The US yogurt market size is forecast to increase by USD 6.60 billion at a CAGR of 6.55% between 2023 and 2028. The market is experiencing significant growth due to the health benefits it offers, particularly its role as a source of bone-building calcium. This trend is driving the demand for various types of yogurt, including those made from cow's milk as well as non-dairy options derived from plant sources such as almonds, soy, coconuts, peas, and cashews. As consumer preferences shift towards vegan and lactose-free alternatives, the market for non-dairy yogurts is expected to expand. However, the market faces challenges from stringent regulations related to yogurt labeling and production standards. To meet these requirements, manufacturers are focusing on using natural ingredients and clear labeling to appeal to health-conscious consumers.
The market is experiencing significant growth, driven by the demand for both flavoured and non-flavoured options. Consumers are increasingly opting for conventional yogurt, such as set yogurt and yogurt drinks, available in plastic bottles and tetra packs. With a focus on healthy eating, products range from regular to low fat and fat free varieties. The nutritional advantages of yogurt, including benefits for osteoporosis, type 2 diabetes, and colon cancer, highlight its role in promoting healthy digestion and bone health. Innovative fruit flavors cater to the on-the-go snack market, while the rise of e-commerce facilitates access to health snacks, including organic yogurt options.
Market Segmentation
The market research report provides comprehensive data (region-wise segment analysis), with forecasts and estimates in "USD billion" for the period 2024-2028, as well as historical data from 2018-2022 for the following segments.
- Flavor
- Plain
- Flavored
- Product
- Spoonable yogurt
- Drinkable yogurt
- Distribution Channel
- Offline
- Online
- Geography
- US
- North America
- US
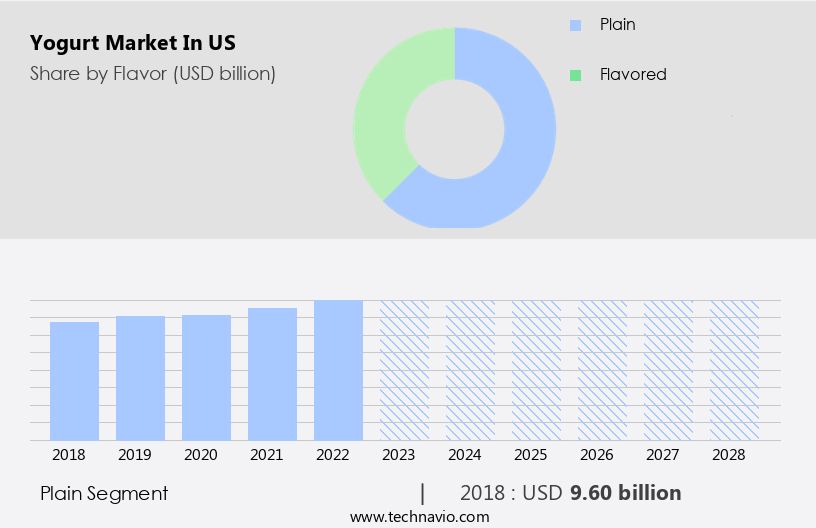
By Flavor Insights
The Plain segment is estimated to witness significant growth during the forecast period. In the United States yogurt market, the plain yogurt segment caters to health-conscious consumers and culinary enthusiasts who value simplicity, versatility, and natural taste. Although flavored yogurts hold a significant market share, plain yogurt continues to maintain a loyal customer base. This unflavored dairy product serves as a blank canvas for consumers to add fruits, nuts, granola, or honey, creating personalized snacks and meals. Moreover, plain yogurt is a key ingredient in various savory dishes, dressings, and marinades due to its neutral flavor and creamy texture. The versatility of plain yogurt extends to various cuisines, making it an attractive option for consumers seeking wholesome and adaptable food choices.
Additionally, its nutritional benefits, such as fiber, protein, and digestive health, align with the preferences of those following low calorie diets. Cane sugar, a common sweetener, can be avoided by choosing natural sweeteners or opting for unsweetened plain yogurt. Probiotics, another essential component of yogurt, contribute to overall digestive health and wellness. The capacity to customize and the network layouts of milk-based products like plain yogurt make it a valuable addition to any diet.
Get a glance at the market share of various segments Request Free Sample
The plain segment was valued at USD 9.60 billion in 2018 and showed a gradual increase during the forecast period.
Our market researchers analyzed the data with 2023 as the base year, along with the key drivers, trends, and challenges. A holistic analysis of drivers will help companies refine their marketing strategies to gain a competitive advantage.
Market Driver
Health benefits of yogurt is the key driver of the market. In the United States, the yogurt market has experienced significant growth due to increasing consumer interest in health and nutrition. Yogurt is a fermented milk product made with a combination of Lactobacillus bulgaricus and Streptococcus thermophilus, which produces lactic acid that thickens the milk and gives it a distinctive sour taste. As a result, yogurt is a nutrient-dense food, offering a good amount of protein, calcium, potassium, vitamins, and minerals. Moreover, it contains fewer calories than many other dairy products. The rise of plant-based foods, including non-dairy yogurts made from alternatives like almond milk and coconut milk, has also contributed to the market's expansion.
Furthermore, the growing number of vegans and flexitarians in America has fueled this trend. Oatly, a leading non-dairy yogurt brand, has gained popularity among health-conscious consumers seeking plant-based alternatives to traditional dairy products. Strawberries and mixed berries are popular flavors for both dairy and non-dairy yogurts, adding to their appeal. In summary, the yogurt market in the US is thriving due to the health benefits of the product, the increasing preference for plant-based foods, and the expanding consumer base of vegans and flexitarians.
Market Trends
Increasing use of superfruits in yogurts is the upcoming trend in the market. In the United States, the yogurt market is experiencing growth due to increasing health awareness among consumers. With rising concerns over health issues such as diabetes, obesity, and allergies, there is a growing preference for nutritious and natural food options. As a result, the demand for yogurt, particularly those fortified with bone-building calcium, is on the rise. Moreover, the trend towards plant-based diets is influencing the yogurt industry, leading to an increase in the production of vegan yogurts made from non-dairy sources like almonds, soy, coconuts, peas, cashews, and oat milk. These plant-based alternatives cater to consumers with dietary restrictions or preferences, ensuring they do not miss out on the health benefits of yogurt.
Furthermore, manufacturers are also incorporating superfruits and berries, such as acai, goji berry, noni, pomegranate, and grapes, into their Greek yogurt offerings to add value and nutritional benefits. These superfruits and berries are rich in antioxidants, vitamins, and minerals, making them an attractive addition to yogurt products. In conclusion, the market is thriving due to the growing health consciousness among consumers, the increasing popularity of plant-based diets, and the addition of value-added ingredients like superfruits and berries. These trends are expected to continue driving the growth of the yogurt market in the United States.
Market Challenge
Stringent regulations related to yogurt is a key challenge affecting the market growth. In market, suppliers and companies encounter various challenges, including adhering to regulations set by authorities. These regulations encompass permits and import-export guidelines, product labeling, new product introductions, and product expiration dates.
Furthermore, to uphold food safety and quality, US regulatory bodies, led by the Food and Drug Administration (FDA,) have established standards for yogurt producers. In June 2021, the FDA amended the yogurt standard of identity, revoking the definitions for low-fat and non-fat yogurt. The production and commerce of dairy products, including whey proteins, necessitate rigorous documentation and registration processes in the US. Soy milk, cashew milk, blueberry, raspberry, flaxseed, oats, vanilla, and other yogurt varieties cater to health-conscious consumers seeking a healthy gut, lower blood pressure, and an improved immune system. Key ingredients like these are gaining popularity in the market.
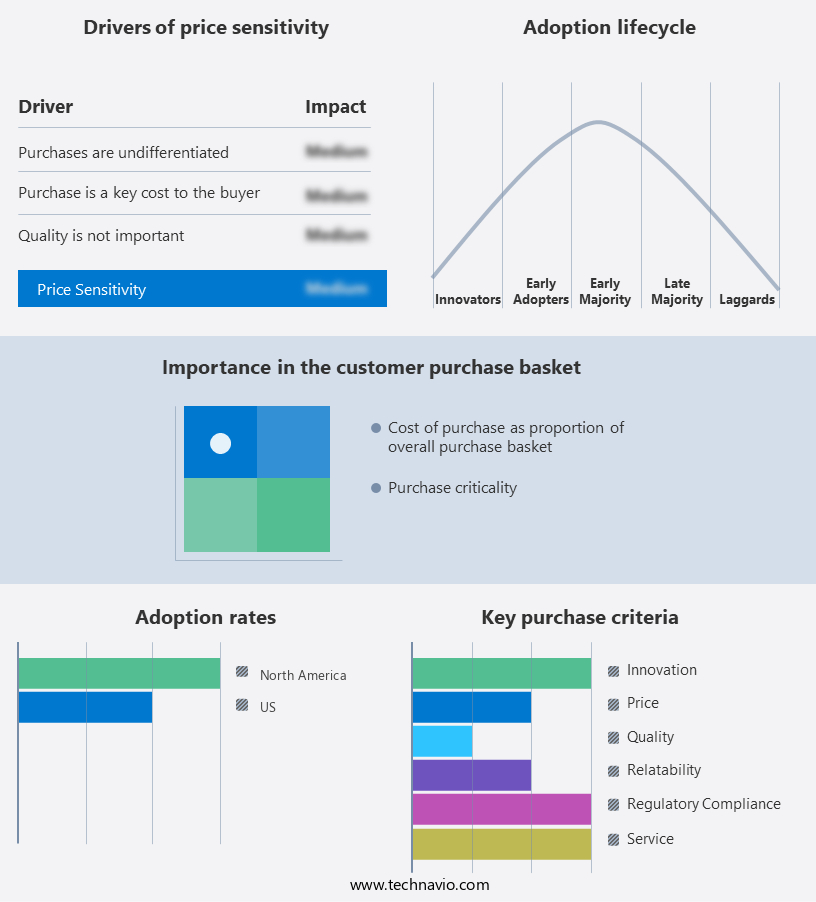
Exclusive Customer Landscape
The market forecasting report includes the adoption lifecycle of the market, covering from the innovator's stage to the laggard's stage. It focuses on adoption rates in different regions based on penetration. Furthermore, the report also includes key purchase criteria and drivers of price sensitivity to help companies evaluate and develop their market growth analysis strategies.
Customer Landscape
Key Companies & Market Insights
Companies are implementing various strategies, such as strategic alliances, partnerships, mergers and acquisitions, geographical expansion, and product/service launches, to enhance their presence in the market.
Dairy Farmers of America Inc.: The company offers yogurts such as Vanilla Bean Frozen yogurt, Peachy Keen yogurt, and Coconut Fudge yogurt under its brand Kemps.
The market research and growth report includes detailed analyses of the competitive landscape of the market and information about key companies, including:
- Anderson Erickson Dairy Co.
- Auburn Dairy Products Inc.
- Cabot Creamery
- Chobani Global Holdings LLC
- Danone
- Fage International SA
- Fonterra Cooperative Group Ltd.
- General Mills Inc.
- Groupe Lactalis
- Kite Hill
- Kroger Co.
- Menchies Group Inc.
- Regenerative Plant Based Inc.
- Royal FrieslandCampina NV
- Sovos Brands Inc.
- SPRINGFIELD CREAMERY
- The Hain Celestial Group Inc.
- Tillamook County Creamery Association
- Nestle SA
Qualitative and quantitative analysis of companies has been conducted to help clients understand the wider business environment as well as the strengths and weaknesses of key market players. Data is qualitatively analyzed to categorize companies as pure play, category-focused, industry-focused, and diversified; it is quantitatively analyzed to categorize companies as dominant, leading, strong, tentative, and weak.
Research Analyst Overview
The market is evolving with a focus on direct selling, wholesale, and retail sales to meet diverse consumer needs. With a rise in busy lifestyles, many are turning to low-calorie, high-protein, and healthier desserts options. Plant-based yogurt has gained traction, featuring exotic flavors and innovative flavors like Pine Coco Green Yogurt Blended. This segment includes drinking yogurt and dairy drinks that contain no artificial sweeteners and incorporate real fruit puree. As awareness of digestive health grows, products targeting digestive disorders and ulcers are on the rise. Yogurt sales are boosted by versatile snacks, including breakfast bowls, smoothies, and ice-cream substitutes. Specialty and online stores provide varied packaging options for clean eating and mindful eating, appealing to those focused on calorie counting and reducing their carbon footprint, especially in urban areas. Popular flavors like strawberry and vanilla continue to delight consumers.
Furthermore, they are low in calories and offer numerous health benefits, such as promoting a healthy gut, lowering blood pressure, improving immune system function, and bone-building calcium. Flaxseed and oats are often added to enhance texture and nutritional value. Vanilla is a popular flavor, but many consumers enjoy the natural taste of fruit-flavored varieties. Non-dairy yogurts are also available in frozen forms, providing a refreshing alternative to ice cream. Probiotics, which support immune systems and aid in digestion, are a crucial component of these yogurts. The changing lifestyle trends, including obesity and diabetes, have made nutrient-dense, high-quality diet options increasingly important to health-conscious consumers. Yogurt brands offer a range of options, from self-serve models to full-service stores, promotional activities, and online platforms with rewards programs. Lactose intolerance and milk allergies are no longer barriers to enjoying yogurt, as plant-based alternatives provide delicious, allergy-friendly options for all.
|
Market Scope |
|
|
Report Coverage |
Details |
|
Page number |
138 |
|
Base year |
2023 |
|
Historic period |
2018-2022 |
|
Forecast period |
2024-2028 |
|
Growth momentum & CAGR |
Accelerate at a CAGR of 6.55% |
|
Market growth 2024-2028 |
USD 6.60 billion |
|
Market structure |
Fragmented |
|
YoY growth 2023-2024(%) |
6.18 |
|
Key companies profiled |
Anderson Erickson Dairy Co., Auburn Dairy Products Inc., Cabot Creamery, Chobani Global Holdings LLC, Dairy Farmers of America Inc., Danone, Fage International SA, Fonterra Cooperative Group Ltd., General Mills Inc., Groupe Lactalis, Kite Hill, Kroger Co., Menchies Group Inc., Regenerative Plant Based Inc., Royal FrieslandCampina NV, Sovos Brands Inc., SPRINGFIELD CREAMERY, The Hain Celestial Group Inc., Tillamook County Creamery Association, and Nestle SA |
|
Market dynamics |
Parent market analysis, market growth inducers and obstacles, market forecast, fast-growing and slow-growing segment analysis, COVID-19 impact and recovery analysis and future consumer dynamics, market condition analysis for the forecast period |
|
Customization purview |
If our market report has not included the data that you are looking for, you can reach out to our analysts and get segments customized. |
|
Competitive landscape |
Leading Companies, Market Positioning of Companies, Competitive Strategies, and Industry Risks |
What are the Key Data Covered in this Market Report?
- CAGR of the market during the forecast period
- Detailed information on factors that will drive the market growth and forecasting between 2024 and 2028
- Precise estimation of the size of the market and its contribution of the market in focus to the parent market
- Accurate predictions about upcoming market growth and trends and changes in consumer behaviour
- Growth of the market across US and North America
- Thorough analysis of the market's competitive landscape and detailed information about companies
- Comprehensive analysis of factors that will challenge the growth of market companies
We can help! Our analysts can customize this market research report to meet your requirements Get in touch
 RIA -
RIA - 
