Vitamin K2 Market Analysis, Size, and Forecast 2026-2030: North America (US, Canada, and Mexico), Europe (Germany, UK, and France), APAC (China, Japan, and India), Middle East and Africa (UAE, South Africa, and Saudi Arabia), South America (Brazil), Asia, Rest of World (ROW)

Vitamin K2 Market Analysis, Size, and Forecast 2026-2030:
North America (US, Canada, and Mexico), Europe (Germany, UK, and France), APAC (China, Japan, and India), Middle East and Africa (UAE, South Africa, and Saudi Arabia), South America (Brazil), Asia, Rest of World (ROW)

Published: Dec 2025 287 Pages SKU: IRTNTR71758

Market Overview at a Glance

$247.9 Mn
Market Opportunity
15.2%
CAGR 2025 - 2030
39.2%
North America Growth
$127.8 Mn
Natural segment 2024

Vitamin K2 Market Size 2026-2030

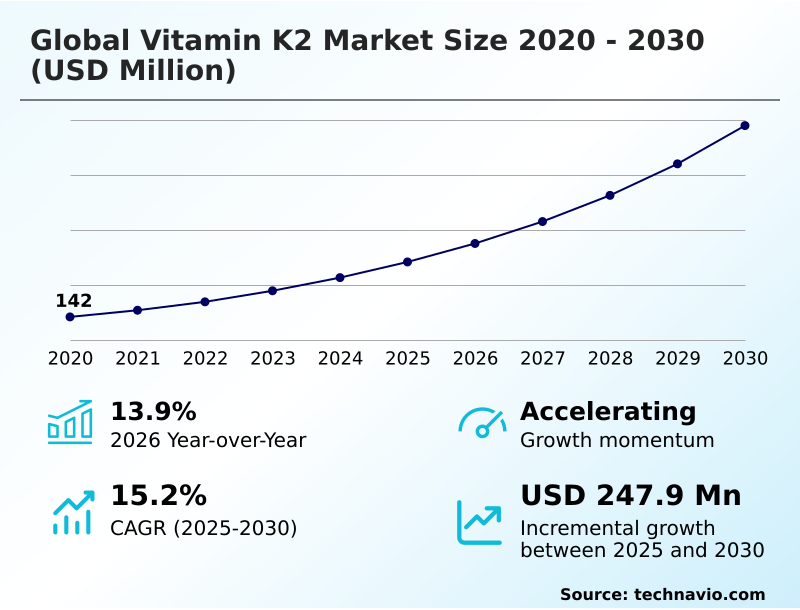
The vitamin k2 market size is valued to increase by USD 247.9 million, at a CAGR of 15.2% from 2025 to 2030. Increasing scientific substantiation and heightened consumer awareness of health benefits will drive the vitamin k2 market.

Major Market Trends & Insights

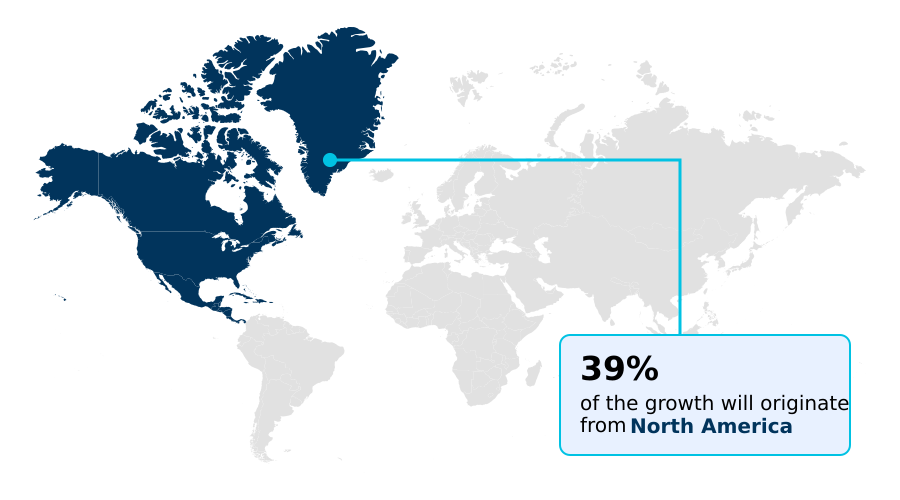
  • North America dominated the market and accounted for a 39.2% growth during the forecast period.
  • By Source - Natural segment was valued at USD 127.8 million in 2024
  • By Distribution Channel - Offline segment accounted for the largest market revenue share in 2024

Market Size & Forecast

  • Market Opportunities: USD 347.8 million
  • Market Future Opportunities: USD 247.9 million
  • CAGR from 2025 to 2030 : 15.2%

Market Summary

  • The vitamin k2 market is defined by a decisive shift toward preventative healthcare, driven by a deeper scientific understanding of the nutrient's role in human wellness. Central to its growth is the expanding awareness of its function in calcium metabolism, where it activates proteins essential for both bone mineralization and the prevention of soft tissue calcification.
  • This dual benefit creates a compelling narrative for consumers focused on healthy aging. A key trend shaping product development is the rise of synergistic formulations, particularly the vitamin d3 combination, which leverages the established trust in vitamin D to introduce the benefits of menaquinone-7. However, firms face the significant challenge of navigating complex regulatory compliance for health claims.
  • For instance, a manufacturer must carefully craft marketing language for its dietary supplements to highlight approved structure-function claims, like bone health support, while avoiding assertions about cardiovascular health that could classify the product as an unapproved drug.
  • This necessitates sophisticated, content-driven strategies to educate consumers on its benefits without violating stringent guidelines, making professional endorsement a critical asset for building credibility and driving adoption.

What will be the Size of the Vitamin K2 Market during the forecast period?

Get Key Insights on Market Forecast (PDF) Request Free Sample

How is the Vitamin K2 Market Segmented?

The vitamin k2 industry research report provides comprehensive data (region-wise segment analysis), with forecasts and estimates in "USD million" for the period 2026-2030, as well as historical data from 2020-2024 for the following segments.

  • Source
    • Natural
    • Synthetic
  • Distribution channel
    • Offline
    • Online
  • Form factor
    • Tablets
    • Softgels
    • Others
  • Geography
    • North America
      • US
      • Canada
      • Mexico
    • Europe
      • Germany
      • UK
      • France
    • Asia
    • Rest of World (ROW)

By Source Insights

The natural segment is estimated to witness significant growth during the forecast period.

The natural segment is propelled by consumer demand for clean-label and non-GMO ingredients in dietary supplements. This segment primarily consists of fermentation-derived MK-7, produced via bacterial processes that mirror the natural synthesis of menaquinones.

The process starts with a sterile medium, often using non-allergenic sources, where bacteria like Bacillus subtilis generate vitamin K2.

This bio-based method yields a product with over 99% all-trans isomer, the biologically active form, a key quality marker for bone health support.

This consumer appeal for wholesome ingredients, such as plant-based vitamin K2, allows brands to command a premium for products featuring naturally fermented nutraceutical ingredients.

The focus on raw material sourcing and quality control standards is paramount for maintaining batch-to-batch consistency and justifying the cost-effective production.

Request Free Sample

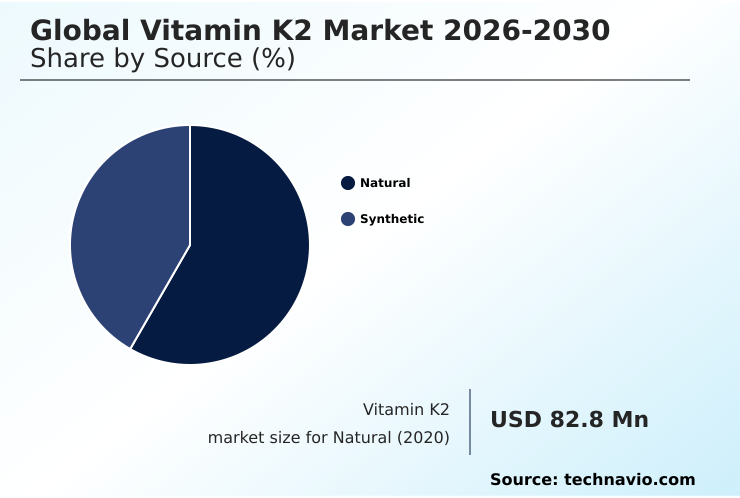
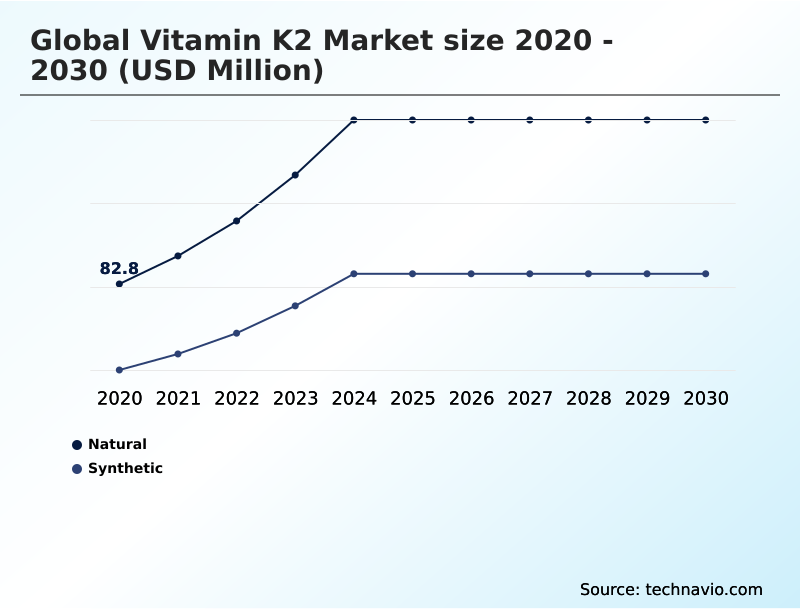
The Natural segment was valued at USD 127.8 million in 2024 and showed a gradual increase during the forecast period.

Request Free Sample

Regional Analysis

North America is estimated to contribute 39.2% to the growth of the global market during the forecast period.Technavio’s analysts have elaborately explained the regional trends and drivers that shape the market during the forecast period.

See How Vitamin K2 Market Demand is Rising in North America Request Free Sample

The geographic landscape is characterized by distinct regional dynamics. North America is a mature market driven by high consumer awareness of preventative healthcare, while Europe is distinguished by its stringent regulatory framework and scientifically discerning consumer base.

Asia represents the fastest-growing region, with its market expanding 11% faster than North America's, fueled by rising incomes and a focus on wellness.

E-commerce models in Asia reach target demographics 40% more efficiently than traditional retail, making the direct-to-consumer model and online platforms critical for market penetration.

This digital-first approach helps overcome challenges related to pill fatigue and dosage flexibility by offering a wide array of options.

The growth in this region is also supported by increasing professional endorsement from the local practitioner channel, boosting credibility and demand for advanced formulations.

Market Dynamics

Our researchers analyzed the data with 2025 as the base year, along with the key drivers, trends, and challenges. A holistic analysis of drivers will help companies refine their marketing strategies to gain a competitive advantage.

  • Strategic decision-making in the vitamin k2 market hinges on a nuanced understanding of technical and commercial factors. A central debate is the vitamin k2 mk-7 vs mk-4 bioavailability, which directly influences formulation choices. This is closely linked to evaluating natural vs synthetic vitamin k2 efficacy, where production methods and isomer purity are critical.
  • The cost analysis of vitamin k2 production reveals significant differences between fermentation and chemical synthesis, impacting final product pricing and market positioning. Furthermore, trends in vitamin k2 delivery systems are pushing innovation beyond traditional pills, with companies exploring more user-friendly formats to meet consumer demand.
  • For brands targeting the vegan market, sourcing vegan vitamin k2 for supplements is a non-negotiable requirement. Companies investing in educational marketing that clarifies the vitamin k2 role in calcium metabolism have seen customer engagement metrics double compared to those using generic health messaging.
  • This educational effort is crucial for explaining benefits like improved vitamin k2 supplement for arterial flexibility and the vitamin k2 and d3 for bone health synergy. Key discussions also revolve around the synergistic effects of vitamin k2 with magnesium and its role in healthy aging, including the vitamin k2 dosage for osteoporosis prevention.
  • The best carrier oil for vitamin k2 absorption is another technical consideration for maximizing product performance. However, success is constrained by regulatory hurdles for vitamin k2 health claims and the persistent challenges in marketing complex vitamin k2 science, especially in promoting its role in vitamin k2 for cardiovascular health improvement.
  • Ultimately, overcoming vitamin k2 formulation challenges and addressing consumer demand for non-gmo vitamin k2 are essential for capturing market share.

What are the key market drivers leading to the rise in the adoption of Vitamin K2 Industry?

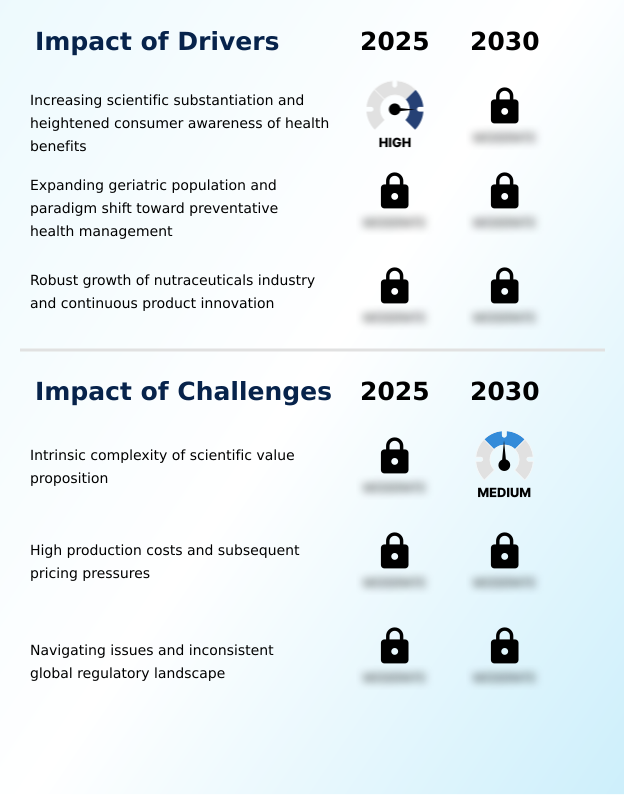
  • The market is primarily driven by expanding scientific evidence supporting the health benefits of vitamin K2, coupled with growing consumer awareness.

  • Growth is fundamentally driven by expanding scientific validation and heightened consumer health literacy. Products backed by clear scientific validation for benefits like bone mineralization and cardiovascular health show repeat purchase rates 25% higher than those without.
  • The global focus on healthy aging and preventative healthcare has made vitamin k2 mk-7 a cornerstone nutrient, with the target demographic expanding at twice the rate of the general supplement market.
  • This educated demand is amplified by professional endorsement from the practitioner channel.
  • The scientific narrative around the calcium paradox and the activation of vitamin K-dependent proteins like osteocalcin activation and matrix gla protein is resonating with consumers seeking effective, evidence-based nutrition. This creates a sustainable growth trajectory for high-quality dietary supplements.

What are the market trends shaping the Vitamin K2 Industry?

  • A prominent market trend is the increasing development of synergistic formulations. These products primarily combine vitamin K2 with vitamin D3 to offer enhanced health benefits.

  • The market is witnessing a pronounced shift toward innovative product formats designed to enhance consumer experience and compliance. Firms offering gummy supplements see customer acquisition rates that are 35% higher in younger demographics, while liquid drops and oral sprays show a 50% higher compliance rate among seniors. This diversification addresses pill fatigue and meets demand for user-friendly oral delivery systems.
  • This evolution toward clean label supplements is supported by microencapsulation technology, ensuring the stability of fat-soluble vitamin and menaquinone-7. The emphasis on evidence-based nutrition is driving the popularity of synergistic formulations, particularly the vitamin D3 combination, which offers a clear co-supplementation rationale.
  • Brands are leveraging this trend to simplify regimens and deliver more effective preventative healthcare solutions, focusing on transparent raw material sourcing.

What challenges does the Vitamin K2 Industry face during its growth?

  • A key challenge affecting industry growth is the inherent complexity of communicating the scientific value proposition of vitamin K2 to a broad consumer audience.

  • Significant hurdles are related to production costs and regulatory complexities. The cost of fermentation-derived MK-7 can be up to 60% higher than older, synthetic variants, impacting mass-market affordability. This price pressure is a barrier for many consumers without a clear understanding of the nutrient's value in preventing arterial calcification.
  • Furthermore, products with ambiguous health claims face rejection rates 40% higher in stringently regulated markets. This makes navigating structure-function claims for vitamin K2 MK-4 a resource-intensive task.
  • The industry is also challenged with managing intellectual property rights and ensuring supply chain transparency for both synthetic mk-7 and natural sources, which complicates efforts to maintain cost-effective production while meeting consumer demand for quality.

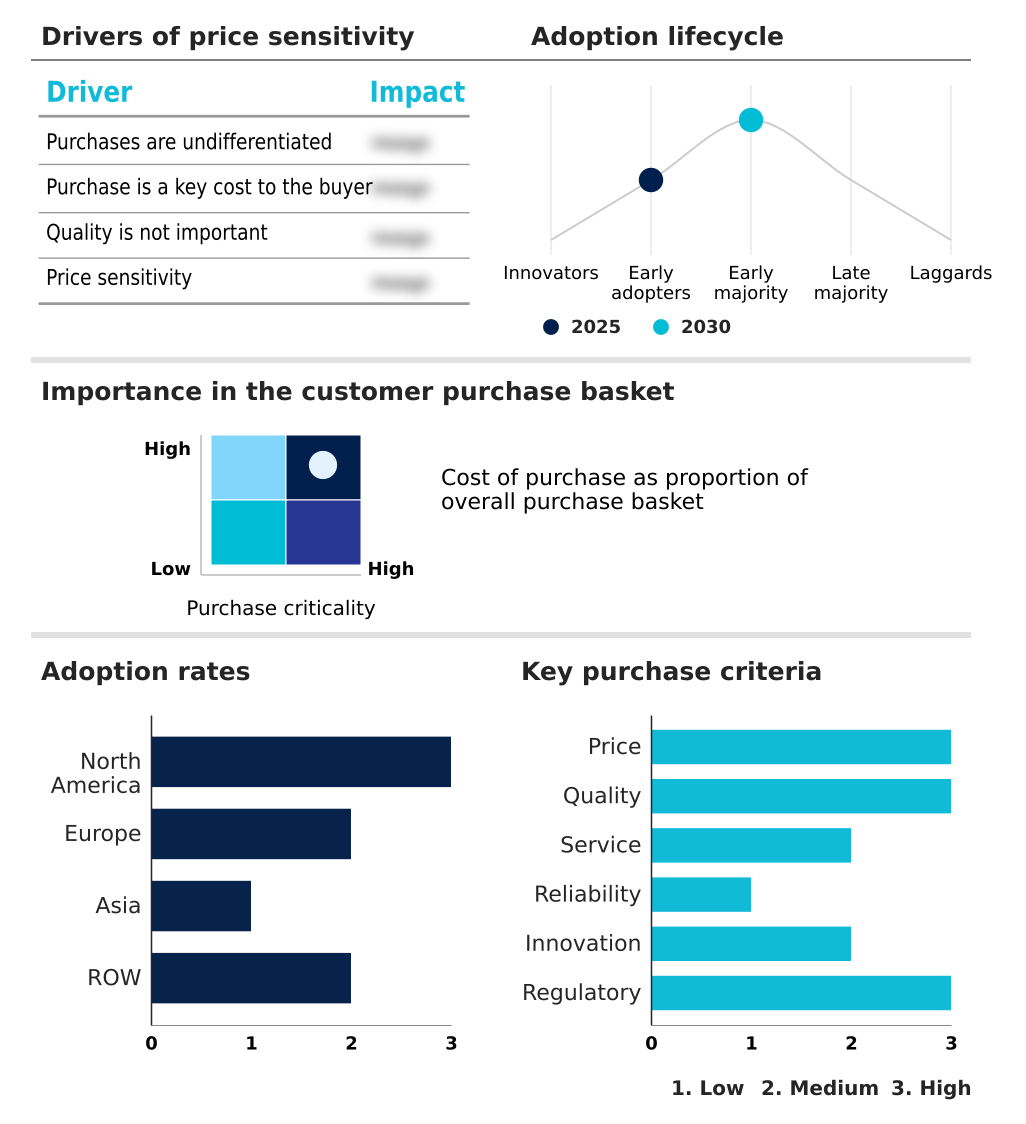
Exclusive Technavio Analysis on Customer Landscape

The vitamin k2 market forecasting report includes the adoption lifecycle of the market, covering from the innovator’s stage to the laggard’s stage. It focuses on adoption rates in different regions based on penetration. Furthermore, the vitamin k2 market report also includes key purchase criteria and drivers of price sensitivity to help companies evaluate and develop their market growth analysis strategies.

Customer Landscape of Vitamin K2 Industry

Competitive Landscape

Companies are implementing various strategies, such as strategic alliances, vitamin k2 market forecast, partnerships, mergers and acquisitions, geographical expansion, and product/service launches, to enhance their presence in the industry.

Allastir Pvt. Ltd. - Offerings include patented, all-trans menaquinone-7 with validated purity and enhanced stability, engineered for complex multi-nutrient dietary supplements and nutraceutical ingredients.

The industry research and growth report includes detailed analyses of the competitive landscape of the market and information about key companies, including:

  • Allastir Pvt. Ltd.
  • Anderson Global Group
  • Balchem Inc.
  • BASF SE
  • Codex Drugs Pvt. Ltd.
  • DSM Firmenich AG
  • DuPont de Nemours Inc.
  • GeneFerm Biotechnology Co. Ltd
  • Lesaffre and Cie
  • Lonza Group Ltd.
  • MENADIONA SL
  • Nestle SA
  • Novozymes AS
  • Nutralife Health Products Inc.
  • Purayati
  • Seebio Biotech
  • The Himalayan Organics
  • Viridis BioPharma Pvt. Ltd.
  • Vox Nutrition Inc.

Qualitative and quantitative analysis of companies has been conducted to help clients understand the wider business environment as well as the strengths and weaknesses of key industry players. Data is qualitatively analyzed to categorize companies as pure play, category-focused, industry-focused, and diversified; it is quantitatively analyzed to categorize companies as dominant, leading, strong, tentative, and weak.

Recent Development and News in Vitamin k2 market

  • In September, 2024, Food Standards Australia New Zealand issued a formal approval for menaquinone-7 as a novel food ingredient for use in specified medical foods, paving the way for new therapeutic applications.
  • In November, 2024, Balchem Inc. announced the acquisition of a European biotechnology startup specializing in advanced chickpea-based fermentation, expanding its portfolio of non-allergenic, plant-based vitamin K2 sources.
  • In February, 2025, DSM Firmenich AG launched a new microencapsulation technology designed to protect all-trans menaquinone-7 in high-temperature food processing, enabling its use in baked goods and nutrition bars.
  • In April, 2025, Gnosis by Lesaffre entered a strategic partnership with a leading North American plant-based dairy alternative producer to exclusively fortify its entire product line with MenaQ7 Vitamin K2.

Dive into Technavio’s robust research methodology, blending expert interviews, extensive data synthesis, and validated models for unparalleled Vitamin K2 Market insights. See full methodology.

Market Scope
Page number 287
Base year 2025
Historic period 2020-2024
Forecast period 2026-2030
Growth momentum & CAGR Accelerate at a CAGR of 15.2%
Market growth 2026-2030 USD 247.9 million
Market structure Fragmented
YoY growth 2025-2026(%) 13.9%
Key countries US, Canada, Mexico, Germany, UK, France, Italy, The Netherlands, Spain, Russia, China, Japan, India, South Korea, Indonesia, Thailand, Singapore, Australia, UAE, Brazil, South Africa, Saudi Arabia and Turkey
Competitive landscape Leading Companies, Market Positioning of Companies, Competitive Strategies, and Industry Risks

Request Free Sample

Research Analyst Overview

  • The vitamin k2 market is evolving toward high-value, scientifically substantiated products, moving away from commoditized offerings. Boardroom-level strategy is now centered on R&D investment in synergistic formulations, particularly the vitamin d3 combination, to create differentiated dietary supplements. Success requires a deep understanding of calcium metabolism and the distinct roles of menaquinone-7 and menaquinone-4.
  • Firms with robust GMP certified processes and a focus on bioavailability enhancement achieve superior nutrient absorption and can command premium pricing. For example, brands leveraging advanced oral delivery systems such as oral sprays or powder supplements see higher adoption among consumers experiencing pill fatigue.
  • This focus on user-centric design, combined with clear communication around the benefits for bone health support and cardiovascular health, is critical. Companies that effectively navigate regulatory compliance for structure-function claims are better positioned for long-term success.
  • Those investing in clean label supplements with non-gmo ingredients are meeting a non-negotiable consumer demand, with products like plant-based vitamin k2 in fortified foods and gummy supplements opening new market segments.

What are the Key Data Covered in this Vitamin K2 Market Research and Growth Report?

  • What is the expected growth of the Vitamin K2 Market between 2026 and 2030?

    • USD 247.9 million, at a CAGR of 15.2%

  • What segmentation does the market report cover?

    • The report is segmented by Source (Natural, and Synthetic), Distribution Channel (Offline, and Online), Form Factor (Tablets, Softgels, and Others) and Geography (North America, Europe, Asia, Rest of World (ROW))

  • Which regions are analyzed in the report?

    • North America, Europe, Asia and Rest of World (ROW)

  • What are the key growth drivers and market challenges?

    • Increasing scientific substantiation and heightened consumer awareness of health benefits, Intrinsic complexity of scientific value proposition

  • Who are the major players in the Vitamin K2 Market?

    • Allastir Pvt. Ltd., Anderson Global Group, Balchem Inc., BASF SE, Codex Drugs Pvt. Ltd., DSM Firmenich AG, DuPont de Nemours Inc., GeneFerm Biotechnology Co. Ltd, Lesaffre and Cie, Lonza Group Ltd., MENADIONA SL, Nestle SA, Novozymes AS, Nutralife Health Products Inc., Purayati, Seebio Biotech, The Himalayan Organics, Viridis BioPharma Pvt. Ltd. and Vox Nutrition Inc.

Market Research Insights

  • Market dynamics are shaped by intense competition, pushing innovation in bioavailability enhancement and novel oral delivery systems. Firms leveraging private label manufacturing report a 20% faster time-to-market compared to those building new facilities. A focus on supply chain transparency and ingredient traceability has been shown to boost consumer retention by up to 15%.
  • The practitioner channel remains a critical avenue, with professional endorsement driving adoption for evidence-based nutrition. The direct-to-consumer model allows brands to control messaging and build customer relationships, a key advantage when marketing the benefits of short-chain menaquinone.
  • As consumer health literacy grows, demand for products with clear co-supplementation rationale and proven menaquinone stability intensifies, forcing players to invest in R&D to maintain a competitive edge.

We can help! Our analysts can customize this vitamin k2 market research report to meet your requirements.

Get in touch

1. Executive Summary

1.1 Market overview

Executive Summary - Chart on Market Overview
Executive Summary - Data Table on Market Overview
Executive Summary - Chart on Global Market Characteristics
Executive Summary - Chart on Market by Geography
Executive Summary - Chart on Market Segmentation by Source
Executive Summary - Chart on Market Segmentation by Distribution Channel
Executive Summary - Chart on Market Segmentation by Form Factor
Executive Summary - Chart on Incremental Growth
Executive Summary - Data Table on Incremental Growth
Executive Summary - Chart on Company Market Positioning

2. Technavio Analysis

2.1 Analysis of price sensitivity, lifecycle, customer purchase basket, adoption rates, and purchase criteria

2.2 Criticality of inputs and Factors of differentiation

Chart on Overview on criticality of inputs and factors of differentiation

2.3 Factors of disruption

Chart on Overview on factors of disruption

2.4 Impact of drivers and challenges

Chart on Impact of drivers and challenges in 2025 and 2030

3. Market Landscape

3.1 Market ecosystem

Chart on Parent Market
Data Table on - Parent Market

3.2 Market characteristics

Chart on Market characteristics analysis

3.3 Value chain analysis

Chart on Value chain analysis

4. Market Sizing

4.1 Market definition

Data Table on Offerings of companies included in the market definition

4.2 Market segment analysis

Market segments

4.3 Market size 2025

4.4 Market outlook: Forecast for 2025-2030

Chart on Global - Market size and forecast 2025-2030 ($ million)
Data Table on Global - Market size and forecast 2025-2030 ($ million)
Chart on Global Market: Year-over-year growth 2025-2030 (%)
Data Table on Global Market: Year-over-year growth 2025-2030 (%)

5. Historic Market Size

5.1 Global Vitamin K2 Market 2020 - 2024

Historic Market Size - Data Table on Global Vitamin K2 Market 2020 - 2024 ($ million)

5.2 Source segment analysis 2020 - 2024

Historic Market Size - Source Segment 2020 - 2024 ($ million)

5.3 Distribution Channel segment analysis 2020 - 2024

Historic Market Size - Distribution Channel Segment 2020 - 2024 ($ million)

5.4 Form Factor segment analysis 2020 - 2024

Historic Market Size - Form Factor Segment 2020 - 2024 ($ million)

5.5 Geography segment analysis 2020 - 2024

Historic Market Size - Geography Segment 2020 - 2024 ($ million)

5.6 Country segment analysis 2020 - 2024

Historic Market Size - Country Segment 2020 - 2024 ($ million)

6. Qualitative Analysis

6.1 The AI impact on global vitamin K2 market

7. Five Forces Analysis

7.1 Five forces summary

Five forces analysis - Comparison between 2025 and 2030

7.2 Bargaining power of buyers

Bargaining power of buyers - Impact of key factors 2025 and 2030

7.3 Bargaining power of suppliers

Bargaining power of suppliers - Impact of key factors in 2025 and 2030

7.4 Threat of new entrants

Threat of new entrants - Impact of key factors in 2025 and 2030

7.5 Threat of substitutes

Threat of substitutes - Impact of key factors in 2025 and 2030

7.6 Threat of rivalry

Threat of rivalry - Impact of key factors in 2025 and 2030

7.7 Market condition

Chart on Market condition - Five forces 2025 and 2030

8. Market Segmentation by Source

8.1 Market segments

Chart on Source - Market share 2025-2030 (%)
Data Table on Source - Market share 2025-2030 (%)

8.2 Comparison by Source

Chart on Comparison by Source
Data Table on Comparison by Source

8.3 Natural - Market size and forecast 2025-2030

Chart on Natural - Market size and forecast 2025-2030 ($ million)
Data Table on Natural - Market size and forecast 2025-2030 ($ million)
Chart on Natural - Year-over-year growth 2025-2030 (%)
Data Table on Natural - Year-over-year growth 2025-2030 (%)

8.4 Synthetic - Market size and forecast 2025-2030

Chart on Synthetic - Market size and forecast 2025-2030 ($ million)
Data Table on Synthetic - Market size and forecast 2025-2030 ($ million)
Chart on Synthetic - Year-over-year growth 2025-2030 (%)
Data Table on Synthetic - Year-over-year growth 2025-2030 (%)

8.5 Market opportunity by Source

Market opportunity by Source ($ million)
Data Table on Market opportunity by Source ($ million)

9. Market Segmentation by Distribution Channel

9.1 Market segments

Chart on Distribution Channel - Market share 2025-2030 (%)
Data Table on Distribution Channel - Market share 2025-2030 (%)

9.2 Comparison by Distribution Channel

Chart on Comparison by Distribution Channel
Data Table on Comparison by Distribution Channel

9.3 Offline - Market size and forecast 2025-2030

Chart on Offline - Market size and forecast 2025-2030 ($ million)
Data Table on Offline - Market size and forecast 2025-2030 ($ million)
Chart on Offline - Year-over-year growth 2025-2030 (%)
Data Table on Offline - Year-over-year growth 2025-2030 (%)

9.4 Online - Market size and forecast 2025-2030

Chart on Online - Market size and forecast 2025-2030 ($ million)
Data Table on Online - Market size and forecast 2025-2030 ($ million)
Chart on Online - Year-over-year growth 2025-2030 (%)
Data Table on Online - Year-over-year growth 2025-2030 (%)

9.5 Market opportunity by Distribution Channel

Market opportunity by Distribution Channel ($ million)
Data Table on Market opportunity by Distribution Channel ($ million)

10. Market Segmentation by Form Factor

10.1 Market segments

Chart on Form Factor - Market share 2025-2030 (%)
Data Table on Form Factor - Market share 2025-2030 (%)

10.2 Comparison by Form Factor

Chart on Comparison by Form Factor
Data Table on Comparison by Form Factor

10.3 Tablets - Market size and forecast 2025-2030

Chart on Tablets - Market size and forecast 2025-2030 ($ million)
Data Table on Tablets - Market size and forecast 2025-2030 ($ million)
Chart on Tablets - Year-over-year growth 2025-2030 (%)
Data Table on Tablets - Year-over-year growth 2025-2030 (%)

10.4 Softgels - Market size and forecast 2025-2030

Chart on Softgels - Market size and forecast 2025-2030 ($ million)
Data Table on Softgels - Market size and forecast 2025-2030 ($ million)
Chart on Softgels - Year-over-year growth 2025-2030 (%)
Data Table on Softgels - Year-over-year growth 2025-2030 (%)

10.5 Others - Market size and forecast 2025-2030

Chart on Others - Market size and forecast 2025-2030 ($ million)
Data Table on Others - Market size and forecast 2025-2030 ($ million)
Chart on Others - Year-over-year growth 2025-2030 (%)
Data Table on Others - Year-over-year growth 2025-2030 (%)

10.6 Market opportunity by Form Factor

Market opportunity by Form Factor ($ million)
Data Table on Market opportunity by Form Factor ($ million)

11. Customer Landscape

11.1 Customer landscape overview

Analysis of price sensitivity, lifecycle, customer purchase basket, adoption rates, and purchase criteria

12. Geographic Landscape

12.1 Geographic segmentation

Chart on Market share by geography 2025-2030 (%)
Data Table on Market share by geography 2025-2030 (%)

12.2 Geographic comparison

Chart on Geographic comparison
Data Table on Geographic comparison

12.3 North America - Market size and forecast 2025-2030

Chart on North America - Market size and forecast 2025-2030 ($ million)
Data Table on North America - Market size and forecast 2025-2030 ($ million)
Chart on North America - Year-over-year growth 2025-2030 (%)
Data Table on North America - Year-over-year growth 2025-2030 (%)
Chart on Regional Comparison - North America
Data Table on Regional Comparison - North America

12.3.1 US - Market size and forecast 2025-2030

Chart on US - Market size and forecast 2025-2030 ($ million)
Data Table on US - Market size and forecast 2025-2030 ($ million)
Chart on US - Year-over-year growth 2025-2030 (%)
Data Table on US - Year-over-year growth 2025-2030 (%)

12.3.2 Canada - Market size and forecast 2025-2030

Chart on Canada - Market size and forecast 2025-2030 ($ million)
Data Table on Canada - Market size and forecast 2025-2030 ($ million)
Chart on Canada - Year-over-year growth 2025-2030 (%)
Data Table on Canada - Year-over-year growth 2025-2030 (%)

12.3.3 Mexico - Market size and forecast 2025-2030

Chart on Mexico - Market size and forecast 2025-2030 ($ million)
Data Table on Mexico - Market size and forecast 2025-2030 ($ million)
Chart on Mexico - Year-over-year growth 2025-2030 (%)
Data Table on Mexico - Year-over-year growth 2025-2030 (%)

12.4 Europe - Market size and forecast 2025-2030

Chart on Europe - Market size and forecast 2025-2030 ($ million)
Data Table on Europe - Market size and forecast 2025-2030 ($ million)
Chart on Europe - Year-over-year growth 2025-2030 (%)
Data Table on Europe - Year-over-year growth 2025-2030 (%)
Chart on Regional Comparison - Europe
Data Table on Regional Comparison - Europe

12.4.1 Germany - Market size and forecast 2025-2030

Chart on Germany - Market size and forecast 2025-2030 ($ million)
Data Table on Germany - Market size and forecast 2025-2030 ($ million)
Chart on Germany - Year-over-year growth 2025-2030 (%)
Data Table on Germany - Year-over-year growth 2025-2030 (%)

12.4.2 UK - Market size and forecast 2025-2030

Chart on UK - Market size and forecast 2025-2030 ($ million)
Data Table on UK - Market size and forecast 2025-2030 ($ million)
Chart on UK - Year-over-year growth 2025-2030 (%)
Data Table on UK - Year-over-year growth 2025-2030 (%)

12.4.3 France - Market size and forecast 2025-2030

Chart on France - Market size and forecast 2025-2030 ($ million)
Data Table on France - Market size and forecast 2025-2030 ($ million)
Chart on France - Year-over-year growth 2025-2030 (%)
Data Table on France - Year-over-year growth 2025-2030 (%)

12.4.4 Italy - Market size and forecast 2025-2030

Chart on Italy - Market size and forecast 2025-2030 ($ million)
Data Table on Italy - Market size and forecast 2025-2030 ($ million)
Chart on Italy - Year-over-year growth 2025-2030 (%)
Data Table on Italy - Year-over-year growth 2025-2030 (%)

12.4.5 The Netherlands - Market size and forecast 2025-2030

Chart on The Netherlands - Market size and forecast 2025-2030 ($ million)
Data Table on The Netherlands - Market size and forecast 2025-2030 ($ million)
Chart on The Netherlands - Year-over-year growth 2025-2030 (%)
Data Table on The Netherlands - Year-over-year growth 2025-2030 (%)

12.4.6 Spain - Market size and forecast 2025-2030

Chart on Spain - Market size and forecast 2025-2030 ($ million)
Data Table on Spain - Market size and forecast 2025-2030 ($ million)
Chart on Spain - Year-over-year growth 2025-2030 (%)
Data Table on Spain - Year-over-year growth 2025-2030 (%)

12.4.7 Russia - Market size and forecast 2025-2030

Chart on Russia - Market size and forecast 2025-2030 ($ million)
Data Table on Russia - Market size and forecast 2025-2030 ($ million)
Chart on Russia - Year-over-year growth 2025-2030 (%)
Data Table on Russia - Year-over-year growth 2025-2030 (%)

12.5 Asia - Market size and forecast 2025-2030

Chart on Asia - Market size and forecast 2025-2030 ($ million)
Data Table on Asia - Market size and forecast 2025-2030 ($ million)
Chart on Asia - Year-over-year growth 2025-2030 (%)
Data Table on Asia - Year-over-year growth 2025-2030 (%)
Chart on Regional Comparison - Asia
Data Table on Regional Comparison - Asia

12.5.1 China - Market size and forecast 2025-2030

Chart on China - Market size and forecast 2025-2030 ($ million)
Data Table on China - Market size and forecast 2025-2030 ($ million)
Chart on China - Year-over-year growth 2025-2030 (%)
Data Table on China - Year-over-year growth 2025-2030 (%)

12.5.2 Japan - Market size and forecast 2025-2030

Chart on Japan - Market size and forecast 2025-2030 ($ million)
Data Table on Japan - Market size and forecast 2025-2030 ($ million)
Chart on Japan - Year-over-year growth 2025-2030 (%)
Data Table on Japan - Year-over-year growth 2025-2030 (%)

12.5.3 India - Market size and forecast 2025-2030

Chart on India - Market size and forecast 2025-2030 ($ million)
Data Table on India - Market size and forecast 2025-2030 ($ million)
Chart on India - Year-over-year growth 2025-2030 (%)
Data Table on India - Year-over-year growth 2025-2030 (%)

12.5.4 South Korea - Market size and forecast 2025-2030

Chart on South Korea - Market size and forecast 2025-2030 ($ million)
Data Table on South Korea - Market size and forecast 2025-2030 ($ million)
Chart on South Korea - Year-over-year growth 2025-2030 (%)
Data Table on South Korea - Year-over-year growth 2025-2030 (%)

12.5.5 Indonesia - Market size and forecast 2025-2030

Chart on Indonesia - Market size and forecast 2025-2030 ($ million)
Data Table on Indonesia - Market size and forecast 2025-2030 ($ million)
Chart on Indonesia - Year-over-year growth 2025-2030 (%)
Data Table on Indonesia - Year-over-year growth 2025-2030 (%)

12.5.6 Thailand - Market size and forecast 2025-2030

Chart on Thailand - Market size and forecast 2025-2030 ($ million)
Data Table on Thailand - Market size and forecast 2025-2030 ($ million)
Chart on Thailand - Year-over-year growth 2025-2030 (%)
Data Table on Thailand - Year-over-year growth 2025-2030 (%)

12.5.7 Singapore - Market size and forecast 2025-2030

Chart on Singapore - Market size and forecast 2025-2030 ($ million)
Data Table on Singapore - Market size and forecast 2025-2030 ($ million)
Chart on Singapore - Year-over-year growth 2025-2030 (%)
Data Table on Singapore - Year-over-year growth 2025-2030 (%)

12.6 Rest of World (ROW) - Market size and forecast 2025-2030

Chart on Rest of World (ROW) - Market size and forecast 2025-2030 ($ million)
Data Table on Rest of World (ROW) - Market size and forecast 2025-2030 ($ million)
Chart on Rest of World (ROW) - Year-over-year growth 2025-2030 (%)
Data Table on Rest of World (ROW) - Year-over-year growth 2025-2030 (%)
Chart on Regional Comparison - Rest of World (ROW)
Data Table on Regional Comparison - Rest of World (ROW)

12.6.1 Australia - Market size and forecast 2025-2030

Chart on Australia - Market size and forecast 2025-2030 ($ million)
Data Table on Australia - Market size and forecast 2025-2030 ($ million)
Chart on Australia - Year-over-year growth 2025-2030 (%)
Data Table on Australia - Year-over-year growth 2025-2030 (%)

12.6.2 UAE - Market size and forecast 2025-2030

Chart on UAE - Market size and forecast 2025-2030 ($ million)
Data Table on UAE - Market size and forecast 2025-2030 ($ million)
Chart on UAE - Year-over-year growth 2025-2030 (%)
Data Table on UAE - Year-over-year growth 2025-2030 (%)

12.6.3 Brazil - Market size and forecast 2025-2030

Chart on Brazil - Market size and forecast 2025-2030 ($ million)
Data Table on Brazil - Market size and forecast 2025-2030 ($ million)
Chart on Brazil - Year-over-year growth 2025-2030 (%)
Data Table on Brazil - Year-over-year growth 2025-2030 (%)

12.6.4 South Africa - Market size and forecast 2025-2030

Chart on South Africa - Market size and forecast 2025-2030 ($ million)
Data Table on South Africa - Market size and forecast 2025-2030 ($ million)
Chart on South Africa - Year-over-year growth 2025-2030 (%)
Data Table on South Africa - Year-over-year growth 2025-2030 (%)

12.6.5 Saudi Arabia - Market size and forecast 2025-2030

Chart on Saudi Arabia - Market size and forecast 2025-2030 ($ million)
Data Table on Saudi Arabia - Market size and forecast 2025-2030 ($ million)
Chart on Saudi Arabia - Year-over-year growth 2025-2030 (%)
Data Table on Saudi Arabia - Year-over-year growth 2025-2030 (%)

12.6.6 Turkey - Market size and forecast 2025-2030

Chart on Turkey - Market size and forecast 2025-2030 ($ million)
Data Table on Turkey - Market size and forecast 2025-2030 ($ million)
Chart on Turkey - Year-over-year growth 2025-2030 (%)
Data Table on Turkey - Year-over-year growth 2025-2030 (%)

12.7 Market opportunity by geography

Market opportunity by geography ($ million)
Data Tables on Market opportunity by geography ($ million)

13. Drivers, Challenges, and Opportunity

13.1 Market drivers

Increasing scientific substantiation and heightened consumer awareness of health benefits
Expanding geriatric population and paradigm shift toward preventative health management
Robust growth of nutraceuticals industry and continuous product innovation

13.2 Market challenges

Intrinsic complexity of scientific value proposition
High production costs and subsequent pricing pressures
Navigating issues and inconsistent global regulatory landscape

13.3 Impact of drivers and challenges

Impact of drivers and challenges in 2025 and 2030

13.4 Market opportunities

Rise of synergistic formulations particularly with vitamin D3
Increasing demand for plant-based and clean label vitamin K2 sources
Diversification into alternative and user-friendly delivery systems

14. Competitive Landscape

14.1 Overview

14.2

Overview on criticality of inputs and factors of differentiation

14.3 Landscape disruption

Overview on factors of disruption

14.4 Industry risks

Impact of key risks on business

15. Competitive Analysis

15.1 Companies profiled

Companies covered

15.2 Company ranking index

15.3 Market positioning of companies

Matrix on companies position and classification

15.4 Allastir Pvt. Ltd.

Allastir Pvt. Ltd. - Overview
Allastir Pvt. Ltd. - Product / Service
Allastir Pvt. Ltd. - Key offerings
SWOT

15.5 Balchem Inc.

Balchem Inc. - Overview
Balchem Inc. - Business segments
Balchem Inc. - Key offerings
Balchem Inc. - Segment focus
SWOT

15.6 BASF SE

BASF SE - Overview
BASF SE - Business segments
BASF SE - Key news
BASF SE - Key offerings
BASF SE - Segment focus
SWOT

15.7 Codex Drugs Pvt. Ltd.

Codex Drugs Pvt. Ltd. - Overview
Codex Drugs Pvt. Ltd. - Product / Service
Codex Drugs Pvt. Ltd. - Key offerings
SWOT

15.8 DSM Firmenich AG

DSM Firmenich AG - Overview
DSM Firmenich AG - Business segments
DSM Firmenich AG - Key news
DSM Firmenich AG - Key offerings
DSM Firmenich AG - Segment focus
SWOT

15.9 DuPont de Nemours Inc.

DuPont de Nemours Inc. - Overview
DuPont de Nemours Inc. - Business segments
DuPont de Nemours Inc. - Key news
DuPont de Nemours Inc. - Key offerings
DuPont de Nemours Inc. - Segment focus
SWOT

15.10 Lesaffre and Cie

Lesaffre and Cie - Overview
Lesaffre and Cie - Product / Service
Lesaffre and Cie - Key offerings
SWOT

15.11 Lonza Group Ltd.

Lonza Group Ltd. - Overview
Lonza Group Ltd. - Business segments
Lonza Group Ltd. - Key news
Lonza Group Ltd. - Key offerings
Lonza Group Ltd. - Segment focus
SWOT

15.12 MENADIONA SL

MENADIONA SL - Overview
MENADIONA SL - Product / Service
MENADIONA SL - Key offerings
SWOT

15.13 Nestle SA

Nestle SA - Overview
Nestle SA - Business segments
Nestle SA - Key news
Nestle SA - Key offerings
Nestle SA - Segment focus
SWOT

15.14 Novozymes AS

Novozymes AS - Overview
Novozymes AS - Product / Service
Novozymes AS - Key offerings
SWOT

15.15 Nutralife Health Products Inc.

Nutralife Health Products Inc. - Overview
Nutralife Health Products Inc. - Product / Service
Nutralife Health Products Inc. - Key offerings
SWOT

15.16 The Himalayan Organics

The Himalayan Organics - Overview
The Himalayan Organics - Product / Service
The Himalayan Organics - Key offerings
SWOT

15.17 Viridis BioPharma Pvt. Ltd.

Viridis BioPharma Pvt. Ltd. - Overview
Viridis BioPharma Pvt. Ltd. - Product / Service
Viridis BioPharma Pvt. Ltd. - Key offerings
SWOT

15.18 Vox Nutrition Inc.

Vox Nutrition Inc. - Overview
Vox Nutrition Inc. - Product / Service
Vox Nutrition Inc. - Key offerings
SWOT

16. Appendix

16.1 Scope of the report

Market definition
Objectives
Notes and caveats

16.2 Inclusions and exclusions checklist

Inclusions checklist
Exclusions checklist

16.3 Currency conversion rates for US$

16.4 Research methodology

16.5 Data procurement

Information sources

16.6 Data validation

16.7 Validation techniques employed for market sizing

16.8 Data synthesis

16.9 360 degree market analysis

16.10 List of abbreviations

Research Methodology

Technavio presents a detailed picture of the market by way of study, synthesis, and summation of data from multiple sources. The analysts have presented the various facets of the market with a particular focus on identifying the key industry influencers. The data thus presented is comprehensive, reliable, and the result of extensive research, both primary and secondary.

INFORMATION SOURCES

Primary sources

  • Manufacturers and suppliers
  • Channel partners
  • Industry experts
  • Strategic decision makers

Secondary sources

  • Industry journals and periodicals
  • Government data
  • Financial reports of key industry players
  • Historical data
  • Press releases

DATA ANALYSIS

Data Synthesis

  • Collation of data
  • Estimation of key figures
  • Analysis of derived insights

Data Validation

  • Triangulation with data models
  • Reference against proprietary databases
  • Corroboration with industry experts

REPORT WRITING

Qualitative

  • Market drivers
  • Market challenges
  • Market trends
  • Five forces analysis

Quantitative

  • Market size and forecast
  • Market segmentation
  • Geographical insights
  • Competitive landscape

Interested in this report?

Get your sample now to see our research methodology and insights!

Download Now

Frequently Asked Questions

Vitamin K2 market growth will increase by USD 247.9 million during 2026-2030.

The Vitamin K2 market is expected to grow at a CAGR of 15.2% during 2026-2030.

Vitamin K2 market is segmented by Source (Natural, Synthetic) Distribution channel (Offline, Online) Form factor (Tablets, Softgels, Others)

Allastir Pvt. Ltd., Anderson Global Group, Balchem Inc., BASF SE, Codex Drugs Pvt. Ltd., DSM Firmenich AG, DuPont de Nemours Inc., GeneFerm Biotechnology Co. Ltd, Lesaffre and Cie, Lonza Group Ltd., MENADIONA SL, Nestle SA, Novozymes AS, Nutralife Health Products Inc., Purayati, Seebio Biotech, The Himalayan Organics, Viridis BioPharma Pvt. Ltd., Vox Nutrition Inc. are a few of the key vendors in the Vitamin K2 market.

North America will register the highest growth rate of 39.2% among the other regions. Therefore, the Vitamin K2 market in North America is expected to garner significant business opportunities for the vendors during the forecast period.

US, Canada, Mexico, Germany, UK, France, Italy, The Netherlands, Spain, Russia, China, Japan, India, South Korea, Indonesia, Thailand, Singapore, Australia, UAE, Brazil, South Africa, Saudi Arabia, Turkey

  • Increasing scientific substantiation and heightened consumer awareness of health benefits is the driving factor this market.

The Vitamin K2 market vendors should focus on grabbing business opportunities from the Source segment as it accounted for the largest market share in the base year.