
Voice User Interface Market Size 2025-2029
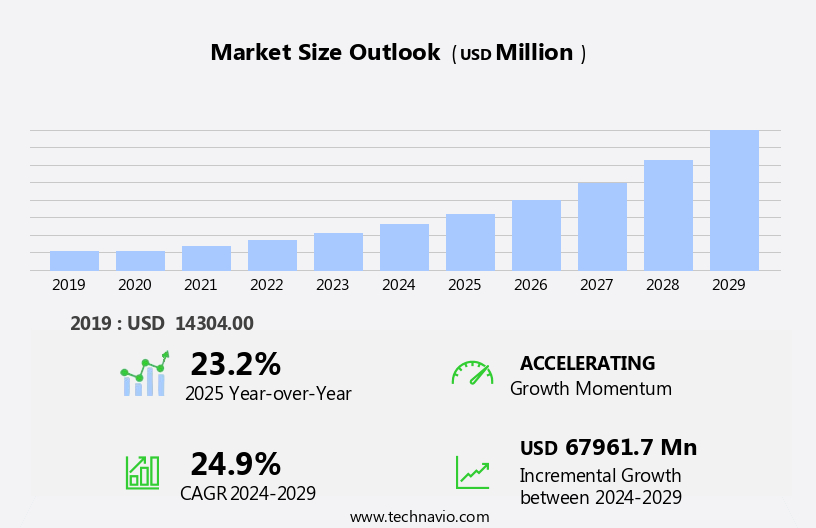
The voice user interface market size is forecast to increase by USD 67.96 billion, at a CAGR of 24.9% between 2024 and 2029.
- The Voice User Interface (VUI) market is experiencing significant growth, driven by the increasing digital transformation across various industries and the rising demand for smart homes and the development of smart cities. Companies are recognizing the potential of VUIs to enhance user experience and streamline business operations, leading to increased adoption. However, this market is not without challenges. Cybersecurity concerns are at the forefront, as the use of voice interfaces raises questions about data privacy and security. Malicious actors could potentially intercept, manipulate, or eavesdrop on voice commands, posing a significant risk.
- To capitalize on the opportunities presented by the VUI market while mitigating these challenges, companies must prioritize robust security measures and user privacy protections. By doing so, they can build trust with consumers and establish a strong market presence.
What will be the Size of the Voice User Interface Market during the forecast period?
Explore in-depth regional segment analysis with market size data - historical 2019-2023 and forecasts 2025-2029 - in the full report.
Request Free Sample
The market continues to evolve, driven by advancements in natural language processing (NLP) and artificial intelligence (AI) technologies. NLP techniques, including convolutional neural networks (CNNs) and recurrent neural networks (RNNs), enable more accurate speech recognition and understanding. Edge computing and virtual assistants are revolutionizing automotive applications, while contextual awareness and software integration enhance user experience (UX) in mobile applications. Language modeling and entity recognition are key components of advanced voice search, improving accuracy and relevance. Home automation and wearable devices are integrating voice interfaces for seamless control and interaction. User experience (UX) and customer service are benefiting from voice recognition and deep learning, offering more personalized and efficient interactions.
Deep learning and transformer networks are advancing model training and evaluation, while model training and data augmentation optimize performance. Speech synthesis and noise cancellation enhance the user experience, and hardware acceleration and cloud computing facilitate scalability. Voice biometrics and far-field speech recognition are expanding accessibility technologies, while speaker diarization and dialogue management improve call center efficiency. Echo cancellation and intent recognition ensure clear communication and accurate understanding. The market dynamics of voice user interfaces are continually unfolding, with ongoing research and development in areas such as sentiment analysis, acoustic modeling, F1-score, and model evaluation. The integration of these technologies across various sectors is transforming the way we interact with technology and improving overall user experience.
How is this Voice User Interface Industry segmented?
The voice user interface industry research report provides comprehensive data (region-wise segment analysis), with forecasts and estimates in "USD million" for the period 2025-2029, as well as historical data from 2019-2023 for the following segments.
- Type
- Solution
- Service
- Application
- Smart speakers
- Interactive voice response
- Voice controlled devices
- Smart phones and tablets
- Others
- Technology
- Speech recognition
- Natural language processing (NLP)
- Text-to-speech (TTS) conversion
- Voice biometrics and authentication
- Geography
- North America
- US
- Canada
- Europe
- France
- Germany
- Italy
- UK
- APAC
- China
- India
- Japan
- South Korea
- Rest of World (ROW)
- North America
By Type Insights
The solution segment is estimated to witness significant growth during the forecast period.
The market experienced significant growth in 2024, with the solution segment leading the way. This segment encompasses various speech recognition systems, such as Siri, Alexa, and Google Assistant, and caters to industrial, commercial, and individual consumers. The market's expansion is primarily fueled by the increasing market penetration of connected devices and the ongoing digital transformation. The voice user interface enhances user experience by enabling multitasking, allowing users to focus on one task while executing another through voice commands. For instance, while driving, a user can adjust the car's sound, temperature, and lighting using voice commands from Siri or Amazon Alexa.
Advancements in natural language processing, deep learning, and neural networks have led to improved voice recognition capabilities and contextual awareness. These technologies have also enabled sentiment analysis, intent recognition, and entity recognition, making voice user interfaces more intelligent and efficient. Edge computing and hardware acceleration have further boosted performance, enabling real-time processing and reducing latency. The automotive industry has been a significant adopter of voice user interfaces, with applications ranging from infotainment systems to advanced driver assistance systems. Mobile applications, call centers, healthcare, and home automation are other major industries leveraging voice user interfaces for enhanced user experience and productivity.
Accessibility technologies have also gained prominence, enabling voice user interfaces to cater to users with disabilities, making technology more inclusive. Machine learning and cloud computing have played a crucial role in model training, evaluation, and model improvement, driving innovation and market growth. Voice search and deep learning have transformed the way users interact with technology, enabling more accurate and natural interactions. Echo cancellation, noise reduction, and speaker diarization have improved voice recognition accuracy, especially in noisy environments. Voice biometrics and transformer networks have added an extra layer of security, making voice user interfaces more secure and reliable. Data annotation and voice cloning have enabled more accurate and personalized user experiences, enhancing overall market value.
In conclusion, the market is witnessing significant growth, driven by technological advancements, digital transformation, and increasing market penetration of connected devices. The market's future looks promising, with continued innovation and adoption across various industries and applications.
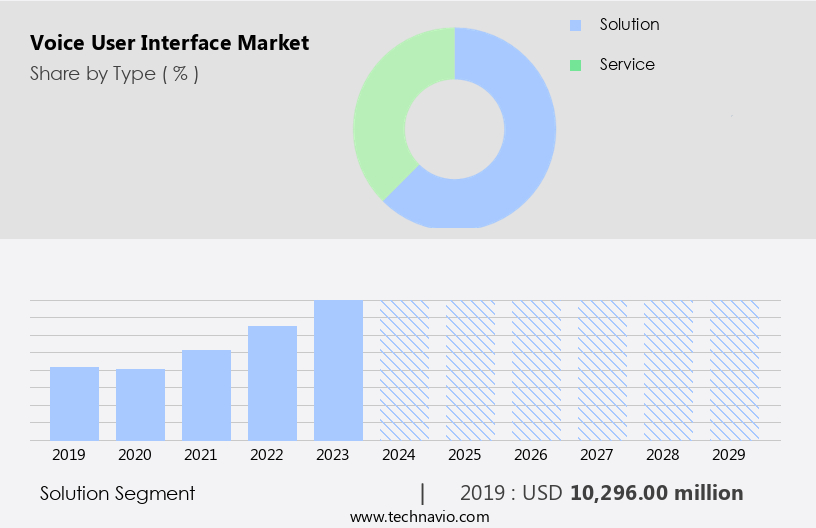
The Solution segment was valued at USD 10.3 billion in 2019 and showed a gradual increase during the forecast period.
Regional Analysis
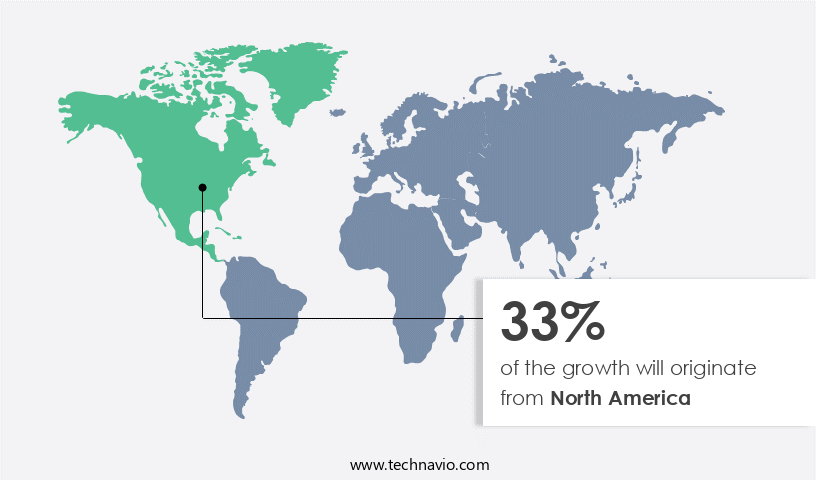
North America is estimated to contribute 33% to the growth of the global market during the forecast period.Technavio’s analysts have elaborately explained the regional trends and drivers that shape the market during the forecast period.
The market in the US and Canada is experiencing significant growth, driven by end-user industries such as automotive, retail, healthcare, media and entertainment, hospitality, and BFSI. These sectors are integrating voice user interfaces to enhance their competitive edge and streamline operations. Additionally, individual consumers are embracing voice technology for home automation and personal use. Companies like Amazon, with their popular Echo and Alexa devices, are leading the market in the region. Advancements in natural language processing, deep learning, and machine learning are fueling the development of more sophisticated virtual assistants and smart speakers. Neural networks, including convolutional and recurrent types, are essential in improving speech recognition and contextual awareness.
Edge computing and hardware acceleration enable real-time processing, while data augmentation and model training enhance the performance of voice recognition systems. Sentiment analysis and intent recognition are crucial for personalized user experiences, while accessibility technologies cater to individuals with disabilities. Voice search and far-field speech recognition are transforming how users interact with digital content. In the automotive sector, voice user interfaces are being integrated into cars for hands-free control and improved safety. Voice biometrics, speaker diarization, and dialogue management are essential components of advanced voice user interfaces. Cloud computing and model evaluation ensure efficient and accurate processing and analysis of voice data.
Noise cancellation and echo cancellation technologies improve voice recognition performance in various environments. In the healthcare sector, voice user interfaces are being used for telemedicine consultations, medication reminders, and patient monitoring. In the retail industry, voice shopping and voice ordering are gaining popularity. Wearable devices and smart home appliances are also integrating voice user interfaces for convenience and ease of use. The market is a dynamic and evolving landscape, with continuous innovation and advancements in technology driving its growth. Companies are investing in research and development to create more sophisticated and personalized voice user interfaces, enhancing the overall user experience.
Market Dynamics
Our researchers analyzed the data with 2024 as the base year, along with the key drivers, trends, and challenges. A holistic analysis of drivers will help companies refine their marketing strategies to gain a competitive advantage.
In the ever-evolving digital landscape, the market continues to gain momentum as a revolutionary technology. This market encompasses innovative solutions that enable seamless interaction between users and devices through spoken commands. Natural Language Processing (NLP), Artificial Intelligence (AI), and Machine Learning (ML) technologies power voice assistants, transforming how we access information and control smart devices. Voice search, in-car systems, and virtual assistants are key applications driving market growth. Consumers increasingly prefer hands-free, voice-activated interactions, making this market a game-changer for businesses aiming to enhance user experience. Voice biometrics, personalization, and integration with other technologies further expand its potential. The market is poised to disrupt industries, from e-commerce and entertainment to education and healthcare, offering limitless opportunities for innovation.
What are the key market drivers leading to the rise in the adoption of Voice User Interface Industry?
- The relentless advancement of digital transformation serves as the primary catalyst for market growth.
- The market is experiencing significant growth due to digital transformation in various industries, including Internet services, telecommunication, BFSI, healthcare, and media and entertainment. The telecommunications sector's introduction of fourth-generation (4G) and fifth-generation (5G) technology enables users to connect with high-speed Internet, leading to an increased preference for advanced technologies. Voice recognition, a crucial component of voice user interfaces, is driven by advancements in neural networks, speech synthesis, noise cancellation, model training, and human-computer interaction (HCI). These technologies offer features such as text messaging, free calling, video conferencing, and TV on the phone using voice assistants.
- Moreover, voice user interfaces are increasingly being adopted for accessibility technologies and call centers to enhance user experience and improve efficiency. Data augmentation and acoustic modeling are essential techniques used in intent recognition and f1-score measurement to ensure accuracy and effectiveness. Voice user interfaces are revolutionizing human-computer interaction, making it more immersive, harmonious, and accessible.
What are the market trends shaping the Voice User Interface Industry?
- The increasing demand for smart homes and the development of smart cities represent a significant market trend. These advancements in technology aim to enhance convenience, efficiency, and connectivity in both residential and urban environments.
- Voice user interface technology is revolutionizing the way we interact with electronic devices, particularly in the realm of home automation. This technology enables devices to understand and respond to human commands, offering a more immersive and harmonious user experience. The market for voice user interfaces is experiencing significant growth, with healthcare applications and customer service being key areas of focus. Language modeling and entity recognition are crucial components of voice user interface technology, enabling accurate voice recognition and understanding of user commands. Deep learning algorithms and echo cancellation techniques are also essential for improving voice search functionality and reducing character error rates.
- Smart speakers and wearable devices are popular applications of voice user interface technology. In the healthcare sector, voice user interfaces are being used to manage chronic conditions, schedule appointments, and provide medication reminders. In the realm of home automation, voice user interfaces are being integrated into appliances to control lighting, temperature, and security systems. The user experience (UX) of voice user interfaces is a critical factor in their adoption. A high level of accuracy, ease of use, and seamless integration with existing systems are essential for ensuring a positive user experience. As voice user interfaces become more sophisticated, they are expected to become an integral part of our daily lives, offering convenience and efficiency in various applications.
- Voice user interfaces are also being used to enhance customer service, enabling businesses to provide quick and effective responses to customer queries. By reducing response times and improving accuracy, voice user interfaces are helping to improve customer satisfaction and loyalty. Overall, the market for voice user interfaces is expected to continue growing as more businesses and consumers recognize the benefits of this technology. With advancements in language modeling, entity recognition, and other related technologies, voice user interfaces are poised to become an essential tool for managing various aspects of our personal and professional lives.
What challenges does the Voice User Interface Industry face during its growth?
- The voice user interface in cybersecurity represents a significant challenge that can hinder industry growth due to the complexities involved in securing these systems against potential threats.
- In the market, data privacy and security are significant concerns due to the reliance on the Internet and network connectivity. As voice user interfaces become more prevalent, the potential risks associated with increased data sharing over mobile and cloud networks become increasingly apparent. Network security in high-security zones is a major issue, as these areas may be vulnerable to cyberattacks, potentially posing a threat to national security. To address these challenges, advancements in voice user interface technology include hardware acceleration, model evaluation, speaker diarization, dialogue management, cloud computing, machine learning, voice biometrics, transformer networks, data annotation, voice cloning, and far-field speech recognition.
- These technologies aim to enhance security and improve user experience by reducing false positives, improving accuracy, and minimizing background noise. Moreover, the use of advanced security measures, such as encryption and multi-factor authentication, can help mitigate the risks associated with voice user interfaces. Machine learning algorithms and voice biometrics can be employed to authenticate users, ensuring that only authorized individuals have access to sensitive information. Additionally, transformer networks and dialogue management systems can be utilized to create more immersive and harmonious interactions, reducing the need for manual intervention and minimizing the potential for human error. Overall, the market is continuously evolving to address the challenges of data privacy and security, ensuring that users can enjoy the benefits of this technology while maintaining the highest level of security and protection.
Exclusive Customer Landscape
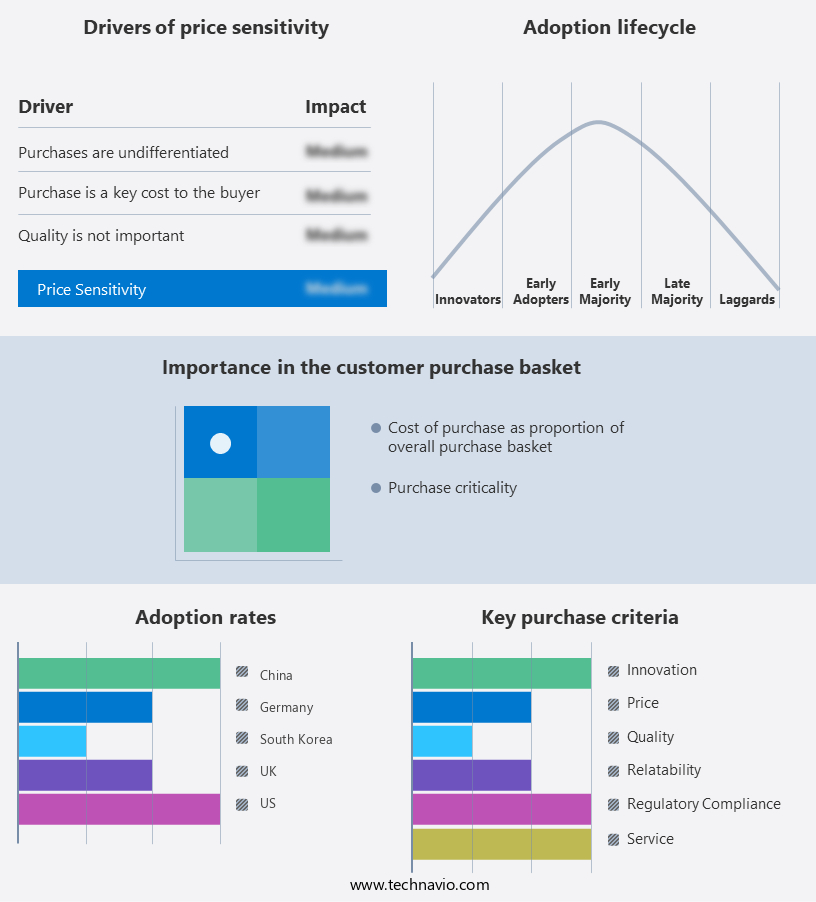
The voice user interface market forecasting report includes the adoption lifecycle of the market, covering from the innovator’s stage to the laggard’s stage. It focuses on adoption rates in different regions based on penetration. Furthermore, the voice user interface market report also includes key purchase criteria and drivers of price sensitivity to help companies evaluate and develop their market growth analysis strategies.
Customer Landscape
Key Companies & Market Insights
Companies are implementing various strategies, such as strategic alliances, voice user interface market forecast, partnerships, mergers and acquisitions, geographical expansion, and product/service launches, to enhance their presence in the industry.
Advanced Voice Recognition Systems Inc. - This company specializes in voice user interface solutions, featuring proprietary speech recognition technology. Our patented interface and application technology enable seamless, hands-free interaction between users and digital platforms. By integrating advanced speech recognition capabilities, we enhance user experience and accessibility across various applications. Our technology undergoes rigorous testing and continuous improvement to ensure accuracy and reliability. By focusing on voice user interface solutions, we aim to revolutionize the way people interact with technology.
The industry research and growth report includes detailed analyses of the competitive landscape of the market and information about key companies, including:
- Advanced Voice Recognition Systems Inc.
- Alan AI Inc.
- Alphabet Inc.
- Amazon.com Inc.
- Apple Inc.
- Baidu Inc.
- CastleOS Software LLC
- International Business Machines Corp.
- Microsoft Corp.
- Picovoice Inc.
- Samsung Electronics Co. Ltd.
- Sonos Inc.
- SoundHound AI Inc.
- Speechly
- Whatfix Pvt. Ltd.
- Zaion SAS
Qualitative and quantitative analysis of companies has been conducted to help clients understand the wider business environment as well as the strengths and weaknesses of key industry players. Data is qualitatively analyzed to categorize companies as pure play, category-focused, industry-focused, and diversified; it is quantitatively analyzed to categorize companies as dominant, leading, strong, tentative, and weak.
Recent Development and News in Voice User Interface Market
- In January 2024, Amazon Alexa announced the integration of its voice assistant technology with Ford vehicles, marking a significant strategic partnership between the tech and automotive industries (Amazon PR). This collaboration aimed to provide in-car voice control for various functions, enhancing user convenience.
- In March 2024, Google secured a strategic investment of USD500 million in Dialog Semiconductor, a leading provider of microcontrollers and power management solutions for voice-controlled devices (Google Investor Relations). This investment strengthened Google's position in the market by securing a key supplier for its smart home and automotive products.
- In April 2025, Microsoft's Cortana voice assistant surpassed 300 million monthly active users, making it the second-largest voice assistant platform after Amazon Alexa (Microsoft Investor Relations). This milestone was a result of strategic partnerships and integrations with various companies, including Cisco, Adobe, and SAP.
- In May 2025, Apple announced the acquisition of Voicera, a voice AI company specializing in meeting transcription and analytics (Apple PR). This acquisition aimed to enhance Siri's capabilities, particularly in business settings, by integrating Voicera's technology for meeting transcription and analysis.
Research Analyst Overview
- The market is witnessing significant advancements, with key technologies such as adaptive learning, voice modulation, and dialogue state tracking shaping its evolution. Security protocols are becoming increasingly crucial, with bias mitigation and detection, as well as ethical considerations, being integral components. Software testing, including A/B testing and usability testing, is essential for ensuring quality assurance (QA) and addressing power consumption and battery life concerns. Semantic understanding and context modeling enable proactive assistance, while emotional intelligence and network infrastructure improvements facilitate multimodal interaction. Agile development, iterative development, and waterfall development methodologies are employed to streamline development processes. Explainable AI (XAI) is gaining traction to enhance transparency and trust, while voice authentication and fallback mechanisms ensure user adaptation and error handling.
- Bandwidth requirements and voice cloning are emerging challenges, necessitating network infrastructure upgrades and robust security measures. Adherence to data privacy regulations is paramount, with bias detection and mitigation strategies being essential for maintaining user trust. Power consumption and form factor considerations are essential for enabling widespread adoption. Overall, the market is dynamic, with ongoing innovation addressing various challenges and enhancing user experiences.
Dive into Technavio’s robust research methodology, blending expert interviews, extensive data synthesis, and validated models for unparalleled Voice User Interface Market insights. See full methodology.
|
Market Scope |
|
|
Report Coverage |
Details |
|
Page number |
231 |
|
Base year |
2024 |
|
Historic period |
2019-2023 |
|
Forecast period |
2025-2029 |
|
Growth momentum & CAGR |
Accelerate at a CAGR of 24.9% |
|
Market growth 2025-2029 |
USD 67961.7 million |
|
Market structure |
Fragmented |
|
YoY growth 2024-2025(%) |
23.2 |
|
Key countries |
US, China, Canada, UK, Japan, Germany, India, Italy, South Korea, and France |
|
Competitive landscape |
Leading Companies, Market Positioning of Companies, Competitive Strategies, and Industry Risks |
What are the Key Data Covered in this Voice User Interface Market Research and Growth Report?
- CAGR of the Voice User Interface industry during the forecast period
- Detailed information on factors that will drive the growth and forecasting between 2025 and 2029
- Precise estimation of the size of the market and its contribution of the industry in focus to the parent market
- Accurate predictions about upcoming growth and trends and changes in consumer behaviour
- Growth of the market across North America, APAC, Europe, Middle East and Africa, and South America
- Thorough analysis of the market’s competitive landscape and detailed information about companies
- Comprehensive analysis of factors that will challenge the voice user interface market growth of industry companies
We can help! Our analysts can customize this voice user interface market research report to meet your requirements.
 RIA -
RIA - 
