Water And Wastewater Pipe Market Analysis, Size, and Forecast 2026-2030: APAC (China, India, and Japan), North America (US, Canada, and Mexico), Europe (Germany, France, and UK), Middle East and Africa (Saudi Arabia, UAE, and South Africa), South America (Brazil and Argentina), and Rest of World (ROW)

Water And Wastewater Pipe Market Analysis, Size, and Forecast 2026-2030:
APAC (China, India, and Japan), North America (US, Canada, and Mexico), Europe (Germany, France, and UK), Middle East and Africa (Saudi Arabia, UAE, and South Africa), South America (Brazil and Argentina), and Rest of World (ROW)

Published: Dec 2025 294 Pages SKU: IRTNTR80115

Market Overview at a Glance

$27.66 B
Market Opportunity
6.6%
CAGR 2025 - 2030
52.8%
APAC Growth
$49.42 B
Plastic pipe segment 2024

Water And Wastewater Pipe Market Size 2026-2030

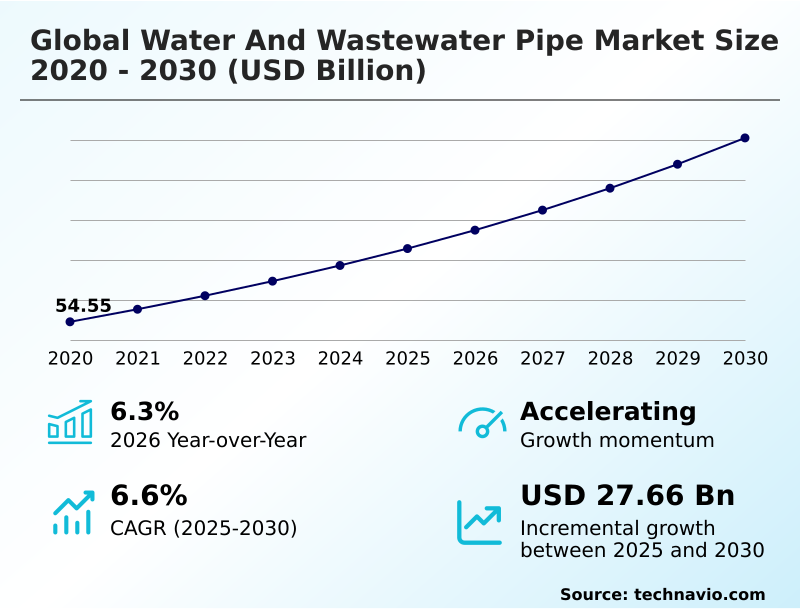
The water and wastewater pipe market size is valued to increase by USD 27.66 billion, at a CAGR of 6.6% from 2025 to 2030. Critical imperative for rehabilitating aging infrastructure will drive the water and wastewater pipe market.

Major Market Trends & Insights

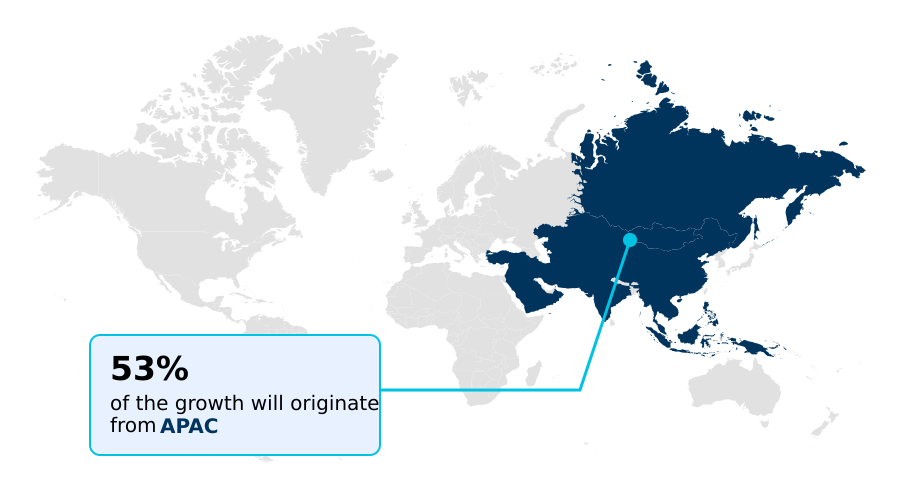
  • APAC dominated the market and accounted for a 52.8% growth during the forecast period.
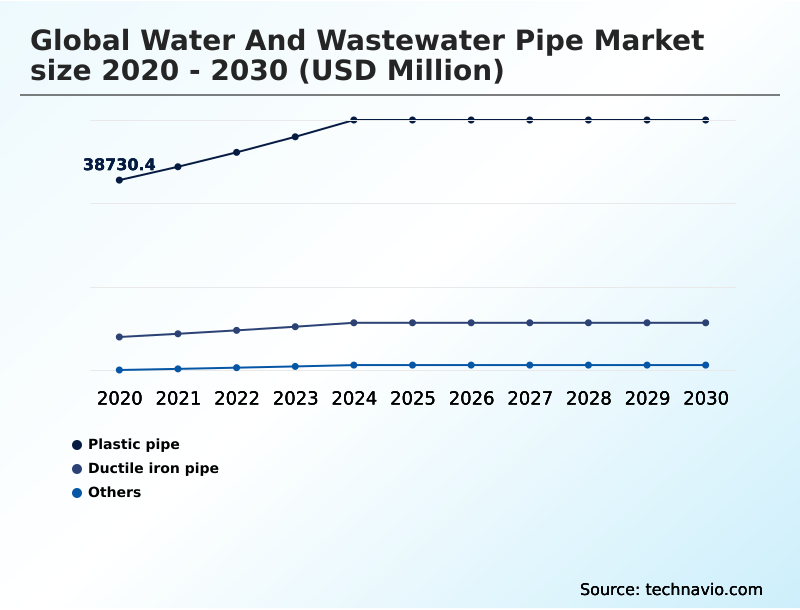
  • By Type - Plastic pipe segment was valued at USD 49.42 billion in 2024
  • By Application - Water supply and distribution segment accounted for the largest market revenue share in 2024

Market Size & Forecast

  • Market Opportunities: USD 45.97 billion
  • Market Future Opportunities: USD 27.66 billion
  • CAGR from 2025 to 2030 : 6.6%

Market Summary

  • The water and wastewater pipe market is fundamentally shaped by the dual imperatives of modernizing aging infrastructure and expanding service to growing urban populations. In developed economies, the focus is on pipe rehabilitation and replacement, addressing issues like non-revenue water and structural failures in decades-old water distribution networks.
  • This drives demand for durable materials like ductile iron pipe and advanced solutions such as trenchless rehabilitation technologies. Conversely, in developing regions, relentless urbanization fuels greenfield infrastructure development, requiring the mass installation of new wastewater collection systems.
  • Across all geographies, a prominent trend is the shift toward materials science, with high-density polyethylene (hdpe) and polyvinyl chloride (pvc) gaining favor for their corrosion resistance and ease of installation. For instance, a municipal utility facing budget constraints can leverage smart pipe technology for leak detection to build a digital twin for water networks.
  • This allows for a proactive maintenance model, optimizing capital allocation by targeting the most critical segments for pipeline asset management and improving overall operational efficiency improvements.

What will be the Size of the Water And Wastewater Pipe Market during the forecast period?

Get Key Insights on Market Forecast (PDF) Request Free Sample

How is the Water And Wastewater Pipe Market Segmented?

The water and wastewater pipe industry research report provides comprehensive data (region-wise segment analysis), with forecasts and estimates in "USD million" for the period 2026-2030, as well as historical data from 2020-2024 for the following segments.

  • Type
    • Plastic pipe
    • Ductile iron pipe
    • Others
  • Application
    • Water supply and distribution
    • Wastewater management
  • End-user
    • Municipal
    • Industrial
    • Agricultural
  • Geography
    • APAC
      • China
      • India
      • Japan
    • North America
      • US
      • Canada
      • Mexico
    • Europe
      • Germany
      • France
      • UK
    • Middle East and Africa
      • Saudi Arabia
      • UAE
      • South Africa
    • South America
      • Brazil
      • Argentina
    • Rest of World (ROW)

By Type Insights

The plastic pipe segment is estimated to witness significant growth during the forecast period.

The market is segmented by type, application, end-user, and geography, including key regions such as North America and Europe.

The plastic pipe segment, featuring materials like high-density polyethylene (HDPE) and polyvinyl chloride (PVC), is expanding its market share due to superior corrosion resistance and installation efficiencies.

The use of trenchless installation methods compatible with these materials significantly minimizes public disruption in dense urban environments. This approach to pipe rehabilitation has been shown to reduce project timelines by as much as 30% compared to traditional open-cut methods.

This efficiency, combined with lower lifecycle cost analysis, is driving adoption in both water distribution networks and wastewater collection systems, especially for lead service line replacement and managing sanitary sewer overflows.

Request Free Sample

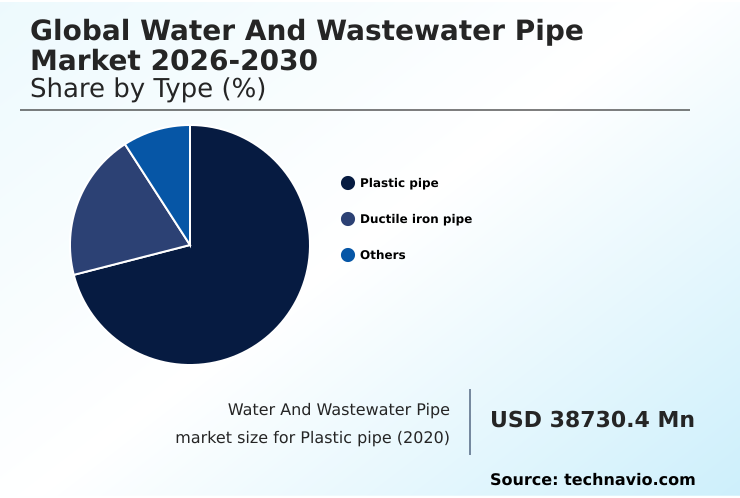
The Plastic pipe segment was valued at USD 49.42 billion in 2024 and showed a gradual increase during the forecast period.

Request Free Sample

Regional Analysis

APAC is estimated to contribute 52.8% to the growth of the global market during the forecast period.Technavio’s analysts have elaborately explained the regional trends and drivers that shape the market during the forecast period.

See How Water And Wastewater Pipe Market Demand is Rising in APAC Request Free Sample

The geographic landscape of the water and wastewater pipe market is sharply divided between rehabilitation-driven demand in mature economies and greenfield projects in developing nations.

Regions like North America and Europe focus on pipeline rehabilitation to address aging infrastructure, with government initiatives like the Bipartisan Infrastructure Law channeling funds into capital improvement programs.

In contrast, APAC accounts for over 52% of incremental growth, fueled by massive urbanization and the need to build out new urban water infrastructure.

In these greenfield projects, the use of lightweight plastic pipes can reduce transportation and handling costs by over 15% compared to traditional materials.

This demand is for foundational water distribution networks and wastewater collection systems to serve millions in new urban centers. This global dichotomy creates distinct opportunities, from high-specification, intelligent piping solutions in developed markets to cost-effective, scalable systems in high-growth regions.

Market Dynamics

Our researchers analyzed the data with 2025 as the base year, along with the key drivers, trends, and challenges. A holistic analysis of drivers will help companies refine their marketing strategies to gain a competitive advantage.

  • Modern pipeline asset management for utilities requires a sophisticated approach, starting with comparing hdpe and ductile iron pipes for different pressure and soil conditions. For critical public health initiatives, selecting appropriate lead service line replacement materials is paramount.
  • The decision to use hdpe pipe for trenchless installation in dense urban areas is often driven by the need to minimize disruption and cost. For wastewater applications, understanding the long-term corrosion resistance in wastewater pipes is key, sometimes leading to the specification of vcp for aggressive sewer environments.
  • Meanwhile, the integration of smart pipe technology for leak detection is becoming standard for improving pressure management in distribution networks and managing non-revenue water with technology. However, the impact of raw material costs remains a persistent issue, creating significant funding challenges for water infrastructure projects.
  • Planners also evaluate grp for large diameter pipelines and consider ductile iron pipe seismic performance in vulnerable zones. To advance the role of pipes in circular economy, designing dual-pipeline systems for water reuse is gaining traction.
  • The adoption of trenchless technology for urban areas is not just a trend but a necessity, with projects leveraging these methods often seeing completion schedules shortened by 10-15% compared to traditional open-trench methods. Innovations in pipe jointing technology further enhance system integrity, making it a crucial element in future-proofing water networks.

What are the key market drivers leading to the rise in the adoption of Water And Wastewater Pipe Industry?

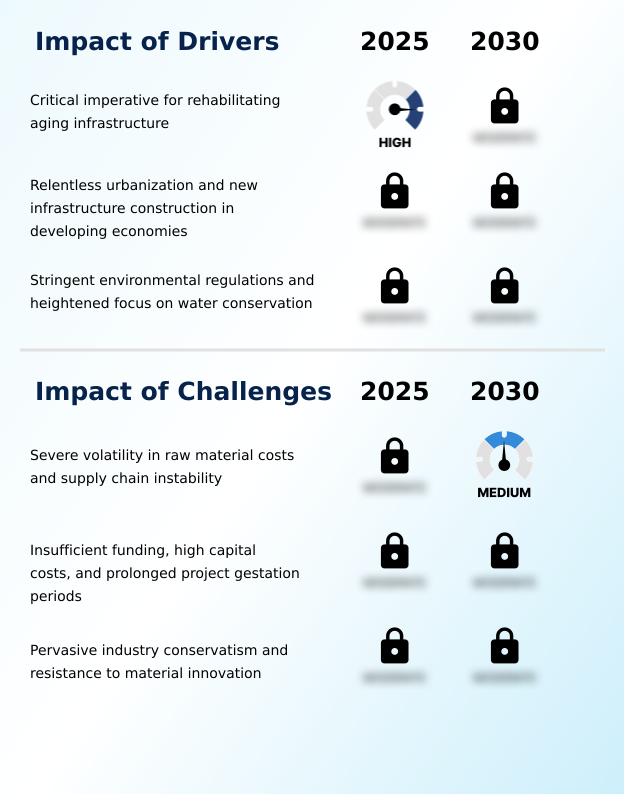
  • The critical imperative to rehabilitate aging and deteriorating water and wastewater infrastructure stands as a primary market driver.

  • Market growth is propelled by the non-negotiable need for aging infrastructure replacement and large-scale greenfield infrastructure development. In developed nations, capital improvement programs are focused on replacing deteriorating pipelines to enhance system reliability and comply with stringent environmental regulations.
  • In rapidly urbanizing regions, demand for foundational urban water infrastructure is increasing by double-digits annually in some cities, creating a massive requirement for new water conveyance systems.
  • Stricter environmental regulations compliance is also compelling investment, with mandates to reduce sanitary sewer overflows by up to 90% in certain watersheds.
  • These public works projects, often backed by long-term infrastructure investment, provide a stable and predictable demand stream for a wide range of pipe products, from potable water distribution lines to large-diameter sewer mains.

What are the market trends shaping the Water And Wastewater Pipe Industry?

  • The accelerated adoption of plastic and composite piping solutions is a key trend. This shift is driven by their superior performance characteristics and lifecycle cost advantages over traditional materials.

  • A primary trend is the pronounced shift in pipe material science toward advanced composite materials and high-performance plastics. This evolution is driven by a focus on long-term performance and lower lifecycle costs. The adoption of intelligent piping solutions is also accelerating, transforming passive networks into responsive assets.
  • The integration of smart sensors into pipelines has enabled some utilities to pinpoint leaks with 98% accuracy, drastically reducing water loss. Concurrently, the development of dual-pipeline systems is becoming central to the implementation of a circular water economy, with recycled water infrastructure representing a significant new growth area.
  • These purple pipe systems, which keep non-potable recycled water separate, are now a standard requirement in many new urban developments, with adoption rates in water-stressed regions increasing by over 20% in recent years.

What challenges does the Water And Wastewater Pipe Industry face during its growth?

  • Severe volatility in raw material costs, coupled with ongoing supply chain instability, presents a significant challenge to market growth and profitability.

  • The market faces persistent headwinds from raw material price volatility, which can swing project costs by as much as 20% within a single fiscal year, disrupting financial planning for manufacturers and public utilities alike. This is compounded by supply chain instability, which can delay projects and increase operational expenses.
  • Furthermore, systemic issues such as insufficient funding and the long gestation periods of public works projects create an unpredictable demand cycle. Industry conservatism also presents a barrier; the approval process for innovative materials can be three to five times longer than for traditional products, slowing the adoption of technologies that could offer significant long-term benefits.
  • These factors collectively constrain growth and pressure profit margins across the sector.

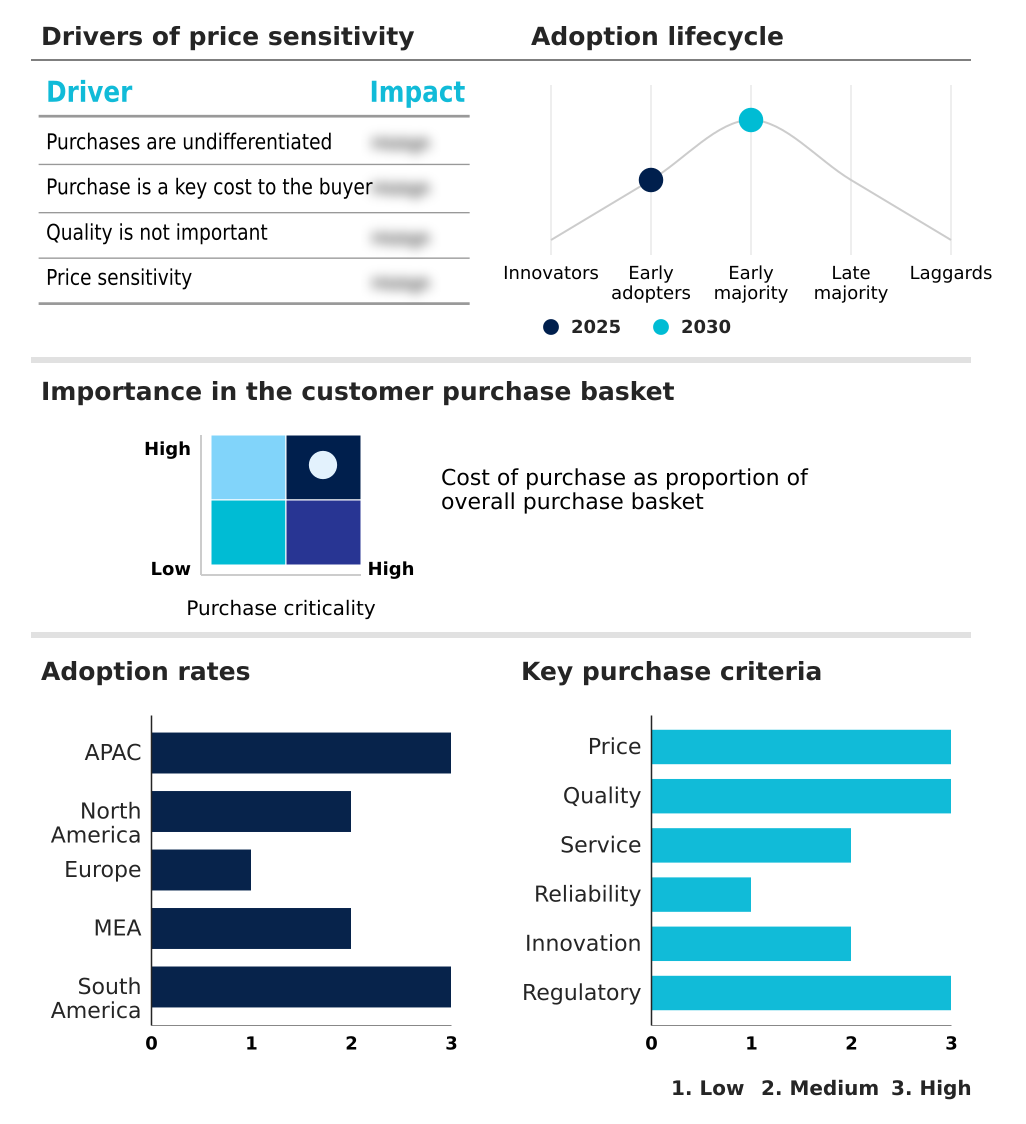
Exclusive Technavio Analysis on Customer Landscape

The water and wastewater pipe market forecasting report includes the adoption lifecycle of the market, covering from the innovator’s stage to the laggard’s stage. It focuses on adoption rates in different regions based on penetration. Furthermore, the water and wastewater pipe market report also includes key purchase criteria and drivers of price sensitivity to help companies evaluate and develop their market growth analysis strategies.

Customer Landscape of Water And Wastewater Pipe Industry

Competitive Landscape

Companies are implementing various strategies, such as strategic alliances, water and wastewater pipe market forecast, partnerships, mergers and acquisitions, geographical expansion, and product/service launches, to enhance their presence in the industry.

Advanced Drainage Systems Inc - Offerings include essential conduits for water supply and wastewater management, forming the critical infrastructure for municipal, industrial, and agricultural fluid transportation.

The industry research and growth report includes detailed analyses of the competitive landscape of the market and information about key companies, including:

  • Advanced Drainage Systems Inc
  • Aliaxis Holdings SA
  • Astral Ltd.
  • China Lesso Group Holdings
  • Geberit International AG
  • Georg Fischer Ltd.
  • ISCO Industries, Inc.
  • JM Eagle Inc.
  • Logan Clay Products LLC
  • McWane Inc.
  • Mueller Water Products Inc
  • Nippon Steel Corp.
  • Northwest Pipe Co
  • Pipelife International GmbH
  • Saudi Arabian Amiantit Co.
  • Sekisui Chemical Co. Ltd.
  • Tata Steel Ltd.
  • Tenaris SA
  • Tessenderlo Group NV
  • Wavin BV

Qualitative and quantitative analysis of companies has been conducted to help clients understand the wider business environment as well as the strengths and weaknesses of key industry players. Data is qualitatively analyzed to categorize companies as pure play, category-focused, industry-focused, and diversified; it is quantitatively analyzed to categorize companies as dominant, leading, strong, tentative, and weak.

Recent Development and News in Water and wastewater pipe market

  • In May, 2025, Georg Fischer Ltd. announced the acquisition of a specialized European smart valve manufacturer, expanding its portfolio of intelligent piping solutions for proactive pressure management systems in urban water infrastructure.
  • In March, 2025, Advanced Drainage Systems Inc. completed construction of a new manufacturing plant in the southeastern US, increasing its production capacity for HDPE pipes by 20% to meet escalating demand from municipal capital improvement programs.
  • In January, 2025, the European Investment Bank launched a multi-billion euro fund aimed at accelerating lead service line replacement and upgrading wastewater collection systems across member states, directly driving demand for modern pipe materials.
  • In October, 2024, Aliaxis Holdings SA introduced a new line of PVC pipes featuring integrated fiber optic sensing capabilities, designed for real-time leak detection and enhanced pipeline integrity management in water distribution networks.

Dive into Technavio’s robust research methodology, blending expert interviews, extensive data synthesis, and validated models for unparalleled Water And Wastewater Pipe Market insights. See full methodology.

Market Scope
Page number 294
Base year 2025
Historic period 2020-2024
Forecast period 2026-2030
Growth momentum & CAGR Accelerate at a CAGR of 6.6%
Market growth 2026-2030 USD 27656.3 million
Market structure Fragmented
YoY growth 2025-2026(%) 6.3%
Key countries China, India, Japan, South Korea, Australia, Indonesia, US, Canada, Mexico, Germany, France, UK, Italy, Spain, The Netherlands, Saudi Arabia, UAE, South Africa, Israel, Turkey, Brazil, Argentina and Chile
Competitive landscape Leading Companies, Market Positioning of Companies, Competitive Strategies, and Industry Risks

Request Free Sample

Research Analyst Overview

  • The water and wastewater pipe market is undergoing a significant transformation, moving beyond the supply of passive conduits to providing integrated systems for intelligent water management. Core components like ductile iron pipe, high-density polyethylene (hdpe), and polyvinyl chloride (pvc) are now being enhanced with advanced technologies.
  • The deployment of a digital twin for water networks, fed by data from fiber optic sensing and other leak detection systems, is a critical boardroom-level consideration, directly influencing capital allocation for pipeline asset management. Utilities deploying these technologies have reported a reduction in unplanned downtime by over 30%.
  • This evolution is redefining the value proposition, where materials like glass reinforced plastic (grp), pre-stressed concrete cylinder pipe (pccp), and vitrified clay pipe (vcp) are selected based on their performance within a managed system.
  • Innovations such as geohazard resistant steel pipe and seismic resistant pipes address specialized environmental risks, while technologies like pipe bursting technology and trenchless installation offer less disruptive methods for pipe rehabilitation.
  • This shift demands a focus on holistic solutions, including cement mortar lining for durability and advanced push-on joint systems or heat fusion jointing for ensuring the integrity of water distribution networks and wastewater collection systems.

What are the Key Data Covered in this Water And Wastewater Pipe Market Research and Growth Report?

  • What is the expected growth of the Water And Wastewater Pipe Market between 2026 and 2030?

    • USD 27.66 billion, at a CAGR of 6.6%

  • What segmentation does the market report cover?

    • The report is segmented by Type (Plastic pipe, Ductile iron pipe, and Others), Application (Water supply and distribution, and Wastewater management), End-user (Municipal, Industrial, and Agricultural) and Geography (APAC, North America, Europe, Middle East and Africa, South America)

  • Which regions are analyzed in the report?

    • APAC, North America, Europe, Middle East and Africa and South America

  • What are the key growth drivers and market challenges?

    • Critical imperative for rehabilitating aging infrastructure, Severe volatility in raw material costs and supply chain instability

  • Who are the major players in the Water And Wastewater Pipe Market?

    • Advanced Drainage Systems Inc, Aliaxis Holdings SA, Astral Ltd., China Lesso Group Holdings, Geberit International AG, Georg Fischer Ltd., ISCO Industries, Inc., JM Eagle Inc., Logan Clay Products LLC, McWane Inc., Mueller Water Products Inc, Nippon Steel Corp., Northwest Pipe Co, Pipelife International GmbH, Saudi Arabian Amiantit Co., Sekisui Chemical Co. Ltd., Tata Steel Ltd., Tenaris SA, Tessenderlo Group NV and Wavin BV

Market Research Insights

  • Market dynamics are increasingly influenced by a strategic pivot toward long-term asset management strategy and sustainability. The focus on aging infrastructure replacement is driving significant capital improvement programs, with project approvals often contingent on lifecycle cost analysis. This favors materials and technologies that promise extended service life and operational efficiency improvements.
  • For example, adopting leak-free jointing systems has been shown to reduce physical water losses by up to 25% in rehabilitated zones. Concurrently, the push for a circular water economy is creating new demand for specialized pipeline networks.
  • A shift toward proactive maintenance models, enabled by intelligent piping solutions, has lowered emergency repair costs by 40% for some utilities, underscoring the financial benefits of long-term infrastructure investment and environmental regulations compliance.

We can help! Our analysts can customize this water and wastewater pipe market research report to meet your requirements.

Get in touch

1. Executive Summary

1.1 Market overview

Executive Summary - Chart on Market Overview
Executive Summary - Data Table on Market Overview
Executive Summary - Chart on Global Market Characteristics
Executive Summary - Chart on Market by Geography
Executive Summary - Chart on Market Segmentation by Type
Executive Summary - Chart on Market Segmentation by Application
Executive Summary - Chart on Market Segmentation by End-user
Executive Summary - Chart on Incremental Growth
Executive Summary - Data Table on Incremental Growth
Executive Summary - Chart on Company Market Positioning

2. Technavio Analysis

2.1 Analysis of price sensitivity, lifecycle, customer purchase basket, adoption rates, and purchase criteria

2.2 Criticality of inputs and Factors of differentiation

Chart on Overview on criticality of inputs and factors of differentiation

2.3 Factors of disruption

Chart on Overview on factors of disruption

2.4 Impact of drivers and challenges

Chart on Impact of drivers and challenges in 2025 and 2030

3. Market Landscape

3.1 Market ecosystem

Chart on Parent Market
Data Table on - Parent Market

3.2 Market characteristics

Chart on Market characteristics analysis

3.3 Value chain analysis

Chart on Value chain analysis

4. Market Sizing

4.1 Market definition

Data Table on Offerings of companies included in the market definition

4.2 Market segment analysis

Market segments

4.3 Market size 2025

4.4 Market outlook: Forecast for 2025-2030

Chart on Global - Market size and forecast 2025-2030 ($ million)
Data Table on Global - Market size and forecast 2025-2030 ($ million)
Chart on Global Market: Year-over-year growth 2025-2030 (%)
Data Table on Global Market: Year-over-year growth 2025-2030 (%)

5. Historic Market Size

5.1 Global Water And Wastewater Pipe Market 2020 - 2024

Historic Market Size - Data Table on Global Water And Wastewater Pipe Market 2020 - 2024 ($ million)

5.2 Type segment analysis 2020 - 2024

Historic Market Size - Type Segment 2020 - 2024 ($ million)

5.3 Application segment analysis 2020 - 2024

Historic Market Size - Application Segment 2020 - 2024 ($ million)

5.4 End-user segment analysis 2020 - 2024

Historic Market Size - End-user Segment 2020 - 2024 ($ million)

5.5 Geography segment analysis 2020 - 2024

Historic Market Size - Geography Segment 2020 - 2024 ($ million)

5.6 Country segment analysis 2020 - 2024

Historic Market Size - Country Segment 2020 - 2024 ($ million)

6. Qualitative Analysis

6.1 The AI impact on global water and wastewater pipe market

7. Five Forces Analysis

7.1 Five forces summary

Five forces analysis - Comparison between 2025 and 2030

7.2 Bargaining power of buyers

Bargaining power of buyers - Impact of key factors 2025 and 2030

7.3 Bargaining power of suppliers

Bargaining power of suppliers - Impact of key factors in 2025 and 2030

7.4 Threat of new entrants

Threat of new entrants - Impact of key factors in 2025 and 2030

7.5 Threat of substitutes

Threat of substitutes - Impact of key factors in 2025 and 2030

7.6 Threat of rivalry

Threat of rivalry - Impact of key factors in 2025 and 2030

7.7 Market condition

Chart on Market condition - Five forces 2025 and 2030

8. Market Segmentation by Type

8.1 Market segments

Chart on Type - Market share 2025-2030 (%)
Data Table on Type - Market share 2025-2030 (%)

8.2 Comparison by Type

Chart on Comparison by Type
Data Table on Comparison by Type

8.3 Plastic pipe - Market size and forecast 2025-2030

Chart on Plastic pipe - Market size and forecast 2025-2030 ($ million)
Data Table on Plastic pipe - Market size and forecast 2025-2030 ($ million)
Chart on Plastic pipe - Year-over-year growth 2025-2030 (%)
Data Table on Plastic pipe - Year-over-year growth 2025-2030 (%)

8.4 Ductile iron pipe - Market size and forecast 2025-2030

Chart on Ductile iron pipe - Market size and forecast 2025-2030 ($ million)
Data Table on Ductile iron pipe - Market size and forecast 2025-2030 ($ million)
Chart on Ductile iron pipe - Year-over-year growth 2025-2030 (%)
Data Table on Ductile iron pipe - Year-over-year growth 2025-2030 (%)

8.5 Others - Market size and forecast 2025-2030

Chart on Others - Market size and forecast 2025-2030 ($ million)
Data Table on Others - Market size and forecast 2025-2030 ($ million)
Chart on Others - Year-over-year growth 2025-2030 (%)
Data Table on Others - Year-over-year growth 2025-2030 (%)

8.6 Market opportunity by Type

Market opportunity by Type ($ million)
Data Table on Market opportunity by Type ($ million)

9. Market Segmentation by Application

9.1 Market segments

Chart on Application - Market share 2025-2030 (%)
Data Table on Application - Market share 2025-2030 (%)

9.2 Comparison by Application

Chart on Comparison by Application
Data Table on Comparison by Application

9.3 Water supply and distribution - Market size and forecast 2025-2030

Chart on Water supply and distribution - Market size and forecast 2025-2030 ($ million)
Data Table on Water supply and distribution - Market size and forecast 2025-2030 ($ million)
Chart on Water supply and distribution - Year-over-year growth 2025-2030 (%)
Data Table on Water supply and distribution - Year-over-year growth 2025-2030 (%)

9.4 Wastewater management - Market size and forecast 2025-2030

Chart on Wastewater management - Market size and forecast 2025-2030 ($ million)
Data Table on Wastewater management - Market size and forecast 2025-2030 ($ million)
Chart on Wastewater management - Year-over-year growth 2025-2030 (%)
Data Table on Wastewater management - Year-over-year growth 2025-2030 (%)

9.5 Market opportunity by Application

Market opportunity by Application ($ million)
Data Table on Market opportunity by Application ($ million)

10. Market Segmentation by End-user

10.1 Market segments

Chart on End-user - Market share 2025-2030 (%)
Data Table on End-user - Market share 2025-2030 (%)

10.2 Comparison by End-user

Chart on Comparison by End-user
Data Table on Comparison by End-user

10.3 Municipal - Market size and forecast 2025-2030

Chart on Municipal - Market size and forecast 2025-2030 ($ million)
Data Table on Municipal - Market size and forecast 2025-2030 ($ million)
Chart on Municipal - Year-over-year growth 2025-2030 (%)
Data Table on Municipal - Year-over-year growth 2025-2030 (%)

10.4 Industrial - Market size and forecast 2025-2030

Chart on Industrial - Market size and forecast 2025-2030 ($ million)
Data Table on Industrial - Market size and forecast 2025-2030 ($ million)
Chart on Industrial - Year-over-year growth 2025-2030 (%)
Data Table on Industrial - Year-over-year growth 2025-2030 (%)

10.5 Agricultural - Market size and forecast 2025-2030

Chart on Agricultural - Market size and forecast 2025-2030 ($ million)
Data Table on Agricultural - Market size and forecast 2025-2030 ($ million)
Chart on Agricultural - Year-over-year growth 2025-2030 (%)
Data Table on Agricultural - Year-over-year growth 2025-2030 (%)

10.6 Market opportunity by End-user

Market opportunity by End-user ($ million)
Data Table on Market opportunity by End-user ($ million)

11. Customer Landscape

11.1 Customer landscape overview

Analysis of price sensitivity, lifecycle, customer purchase basket, adoption rates, and purchase criteria

12. Geographic Landscape

12.1 Geographic segmentation

Chart on Market share by geography 2025-2030 (%)
Data Table on Market share by geography 2025-2030 (%)

12.2 Geographic comparison

Chart on Geographic comparison
Data Table on Geographic comparison

12.3 APAC - Market size and forecast 2025-2030

Chart on APAC - Market size and forecast 2025-2030 ($ million)
Data Table on APAC - Market size and forecast 2025-2030 ($ million)
Chart on APAC - Year-over-year growth 2025-2030 (%)
Data Table on APAC - Year-over-year growth 2025-2030 (%)
Chart on Regional Comparison - APAC
Data Table on Regional Comparison - APAC

12.3.1 China - Market size and forecast 2025-2030

Chart on China - Market size and forecast 2025-2030 ($ million)
Data Table on China - Market size and forecast 2025-2030 ($ million)
Chart on China - Year-over-year growth 2025-2030 (%)
Data Table on China - Year-over-year growth 2025-2030 (%)

12.3.2 India - Market size and forecast 2025-2030

Chart on India - Market size and forecast 2025-2030 ($ million)
Data Table on India - Market size and forecast 2025-2030 ($ million)
Chart on India - Year-over-year growth 2025-2030 (%)
Data Table on India - Year-over-year growth 2025-2030 (%)

12.3.3 Japan - Market size and forecast 2025-2030

Chart on Japan - Market size and forecast 2025-2030 ($ million)
Data Table on Japan - Market size and forecast 2025-2030 ($ million)
Chart on Japan - Year-over-year growth 2025-2030 (%)
Data Table on Japan - Year-over-year growth 2025-2030 (%)

12.3.4 South Korea - Market size and forecast 2025-2030

Chart on South Korea - Market size and forecast 2025-2030 ($ million)
Data Table on South Korea - Market size and forecast 2025-2030 ($ million)
Chart on South Korea - Year-over-year growth 2025-2030 (%)
Data Table on South Korea - Year-over-year growth 2025-2030 (%)

12.3.5 Australia - Market size and forecast 2025-2030

Chart on Australia - Market size and forecast 2025-2030 ($ million)
Data Table on Australia - Market size and forecast 2025-2030 ($ million)
Chart on Australia - Year-over-year growth 2025-2030 (%)
Data Table on Australia - Year-over-year growth 2025-2030 (%)

12.3.6 Indonesia - Market size and forecast 2025-2030

Chart on Indonesia - Market size and forecast 2025-2030 ($ million)
Data Table on Indonesia - Market size and forecast 2025-2030 ($ million)
Chart on Indonesia - Year-over-year growth 2025-2030 (%)
Data Table on Indonesia - Year-over-year growth 2025-2030 (%)

12.4 North America - Market size and forecast 2025-2030

Chart on North America - Market size and forecast 2025-2030 ($ million)
Data Table on North America - Market size and forecast 2025-2030 ($ million)
Chart on North America - Year-over-year growth 2025-2030 (%)
Data Table on North America - Year-over-year growth 2025-2030 (%)
Chart on Regional Comparison - North America
Data Table on Regional Comparison - North America

12.4.1 US - Market size and forecast 2025-2030

Chart on US - Market size and forecast 2025-2030 ($ million)
Data Table on US - Market size and forecast 2025-2030 ($ million)
Chart on US - Year-over-year growth 2025-2030 (%)
Data Table on US - Year-over-year growth 2025-2030 (%)

12.4.2 Canada - Market size and forecast 2025-2030

Chart on Canada - Market size and forecast 2025-2030 ($ million)
Data Table on Canada - Market size and forecast 2025-2030 ($ million)
Chart on Canada - Year-over-year growth 2025-2030 (%)
Data Table on Canada - Year-over-year growth 2025-2030 (%)

12.4.3 Mexico - Market size and forecast 2025-2030

Chart on Mexico - Market size and forecast 2025-2030 ($ million)
Data Table on Mexico - Market size and forecast 2025-2030 ($ million)
Chart on Mexico - Year-over-year growth 2025-2030 (%)
Data Table on Mexico - Year-over-year growth 2025-2030 (%)

12.5 Europe - Market size and forecast 2025-2030

Chart on Europe - Market size and forecast 2025-2030 ($ million)
Data Table on Europe - Market size and forecast 2025-2030 ($ million)
Chart on Europe - Year-over-year growth 2025-2030 (%)
Data Table on Europe - Year-over-year growth 2025-2030 (%)
Chart on Regional Comparison - Europe
Data Table on Regional Comparison - Europe

12.5.1 Germany - Market size and forecast 2025-2030

Chart on Germany - Market size and forecast 2025-2030 ($ million)
Data Table on Germany - Market size and forecast 2025-2030 ($ million)
Chart on Germany - Year-over-year growth 2025-2030 (%)
Data Table on Germany - Year-over-year growth 2025-2030 (%)

12.5.2 France - Market size and forecast 2025-2030

Chart on France - Market size and forecast 2025-2030 ($ million)
Data Table on France - Market size and forecast 2025-2030 ($ million)
Chart on France - Year-over-year growth 2025-2030 (%)
Data Table on France - Year-over-year growth 2025-2030 (%)

12.5.3 UK - Market size and forecast 2025-2030

Chart on UK - Market size and forecast 2025-2030 ($ million)
Data Table on UK - Market size and forecast 2025-2030 ($ million)
Chart on UK - Year-over-year growth 2025-2030 (%)
Data Table on UK - Year-over-year growth 2025-2030 (%)

12.5.4 Italy - Market size and forecast 2025-2030

Chart on Italy - Market size and forecast 2025-2030 ($ million)
Data Table on Italy - Market size and forecast 2025-2030 ($ million)
Chart on Italy - Year-over-year growth 2025-2030 (%)
Data Table on Italy - Year-over-year growth 2025-2030 (%)

12.5.5 Spain - Market size and forecast 2025-2030

Chart on Spain - Market size and forecast 2025-2030 ($ million)
Data Table on Spain - Market size and forecast 2025-2030 ($ million)
Chart on Spain - Year-over-year growth 2025-2030 (%)
Data Table on Spain - Year-over-year growth 2025-2030 (%)

12.5.6 The Netherlands - Market size and forecast 2025-2030

Chart on The Netherlands - Market size and forecast 2025-2030 ($ million)
Data Table on The Netherlands - Market size and forecast 2025-2030 ($ million)
Chart on The Netherlands - Year-over-year growth 2025-2030 (%)
Data Table on The Netherlands - Year-over-year growth 2025-2030 (%)

12.6 Middle East and Africa - Market size and forecast 2025-2030

Chart on Middle East and Africa - Market size and forecast 2025-2030 ($ million)
Data Table on Middle East and Africa - Market size and forecast 2025-2030 ($ million)
Chart on Middle East and Africa - Year-over-year growth 2025-2030 (%)
Data Table on Middle East and Africa - Year-over-year growth 2025-2030 (%)
Chart on Regional Comparison - Middle East and Africa
Data Table on Regional Comparison - Middle East and Africa

12.6.1 Saudi Arabia - Market size and forecast 2025-2030

Chart on Saudi Arabia - Market size and forecast 2025-2030 ($ million)
Data Table on Saudi Arabia - Market size and forecast 2025-2030 ($ million)
Chart on Saudi Arabia - Year-over-year growth 2025-2030 (%)
Data Table on Saudi Arabia - Year-over-year growth 2025-2030 (%)

12.6.2 UAE - Market size and forecast 2025-2030

Chart on UAE - Market size and forecast 2025-2030 ($ million)
Data Table on UAE - Market size and forecast 2025-2030 ($ million)
Chart on UAE - Year-over-year growth 2025-2030 (%)
Data Table on UAE - Year-over-year growth 2025-2030 (%)

12.6.3 South Africa - Market size and forecast 2025-2030

Chart on South Africa - Market size and forecast 2025-2030 ($ million)
Data Table on South Africa - Market size and forecast 2025-2030 ($ million)
Chart on South Africa - Year-over-year growth 2025-2030 (%)
Data Table on South Africa - Year-over-year growth 2025-2030 (%)

12.6.4 Israel - Market size and forecast 2025-2030

Chart on Israel - Market size and forecast 2025-2030 ($ million)
Data Table on Israel - Market size and forecast 2025-2030 ($ million)
Chart on Israel - Year-over-year growth 2025-2030 (%)
Data Table on Israel - Year-over-year growth 2025-2030 (%)

12.6.5 Turkey - Market size and forecast 2025-2030

Chart on Turkey - Market size and forecast 2025-2030 ($ million)
Data Table on Turkey - Market size and forecast 2025-2030 ($ million)
Chart on Turkey - Year-over-year growth 2025-2030 (%)
Data Table on Turkey - Year-over-year growth 2025-2030 (%)

12.7 South America - Market size and forecast 2025-2030

Chart on South America - Market size and forecast 2025-2030 ($ million)
Data Table on South America - Market size and forecast 2025-2030 ($ million)
Chart on South America - Year-over-year growth 2025-2030 (%)
Data Table on South America - Year-over-year growth 2025-2030 (%)
Chart on Regional Comparison - South America
Data Table on Regional Comparison - South America

12.7.1 Brazil - Market size and forecast 2025-2030

Chart on Brazil - Market size and forecast 2025-2030 ($ million)
Data Table on Brazil - Market size and forecast 2025-2030 ($ million)
Chart on Brazil - Year-over-year growth 2025-2030 (%)
Data Table on Brazil - Year-over-year growth 2025-2030 (%)

12.7.2 Argentina - Market size and forecast 2025-2030

Chart on Argentina - Market size and forecast 2025-2030 ($ million)
Data Table on Argentina - Market size and forecast 2025-2030 ($ million)
Chart on Argentina - Year-over-year growth 2025-2030 (%)
Data Table on Argentina - Year-over-year growth 2025-2030 (%)

12.7.3 Chile - Market size and forecast 2025-2030

Chart on Chile - Market size and forecast 2025-2030 ($ million)
Data Table on Chile - Market size and forecast 2025-2030 ($ million)
Chart on Chile - Year-over-year growth 2025-2030 (%)
Data Table on Chile - Year-over-year growth 2025-2030 (%)

12.8 Market opportunity by geography

Market opportunity by geography ($ million)
Data Tables on Market opportunity by geography ($ million)

13. Drivers, Challenges, and Opportunity

13.1 Market drivers

Critical imperative for rehabilitating aging infrastructure
Relentless urbanization and new infrastructure construction in developing economies
Stringent environmental regulations and heightened focus on water conservation

13.2 Market challenges

Severe volatility in raw material costs and supply chain instability
Insufficient funding, high capital costs, and prolonged project gestation periods
Pervasive industry conservatism and resistance to material innovation

13.3 Impact of drivers and challenges

Impact of drivers and challenges in 2025 and 2030

13.4 Market opportunities

Accelerated adoption of plastic and composite piping solutions
Rise of water reuse and development of dual-pipeline systems
Integration of smart technologies and digitalization for proactive asset management

14. Competitive Landscape

14.1 Overview

14.2

Overview on criticality of inputs and factors of differentiation

14.3 Landscape disruption

Overview on factors of disruption

14.4 Industry risks

Impact of key risks on business

15. Competitive Analysis

15.1 Companies profiled

Companies covered

15.2 Company ranking index

15.3 Market positioning of companies

Matrix on companies position and classification

15.4 Advanced Drainage Systems Inc

Advanced Drainage Systems Inc - Overview
Advanced Drainage Systems Inc - Business segments
Advanced Drainage Systems Inc - Key offerings
Advanced Drainage Systems Inc - Segment focus
SWOT

15.5 Aliaxis Holdings SA

Aliaxis Holdings SA - Overview
Aliaxis Holdings SA - Product / Service
Aliaxis Holdings SA - Key offerings
SWOT

15.6 Astral Ltd.

Astral Ltd. - Overview
Astral Ltd. - Business segments
Astral Ltd. - Key offerings
Astral Ltd. - Segment focus
SWOT

15.7 China Lesso Group Holdings

China Lesso Group Holdings - Overview
China Lesso Group Holdings - Business segments
China Lesso Group Holdings - Key offerings
China Lesso Group Holdings - Segment focus
SWOT

15.8 Geberit International AG

Geberit International AG - Overview
Geberit International AG - Product / Service
Geberit International AG - Key offerings
SWOT

15.9 Georg Fischer Ltd.

Georg Fischer Ltd. - Overview
Georg Fischer Ltd. - Business segments
Georg Fischer Ltd. - Key offerings
Georg Fischer Ltd. - Segment focus
SWOT

15.10 ISCO Industries, Inc.

ISCO Industries, Inc. - Overview
ISCO Industries, Inc. - Product / Service
ISCO Industries, Inc. - Key offerings
SWOT

15.11 JM Eagle Inc.

JM Eagle Inc. - Overview
JM Eagle Inc. - Product / Service
JM Eagle Inc. - Key offerings
SWOT

15.12 Logan Clay Products LLC

Logan Clay Products LLC - Overview
Logan Clay Products LLC - Product / Service
Logan Clay Products LLC - Key offerings
SWOT

15.13 McWane Inc.

McWane Inc. - Overview
McWane Inc. - Product / Service
McWane Inc. - Key offerings
SWOT

15.14 Mueller Water Products Inc

Mueller Water Products Inc - Overview
Mueller Water Products Inc - Business segments
Mueller Water Products Inc - Key offerings
Mueller Water Products Inc - Segment focus
SWOT

15.15 Nippon Steel Corp.

Nippon Steel Corp. - Overview
Nippon Steel Corp. - Business segments
Nippon Steel Corp. - Key news
Nippon Steel Corp. - Key offerings
Nippon Steel Corp. - Segment focus
SWOT

15.16 Northwest Pipe Co

Northwest Pipe Co - Overview
Northwest Pipe Co - Business segments
Northwest Pipe Co - Key offerings
Northwest Pipe Co - Segment focus
SWOT

15.17 Tata Steel Ltd.

Tata Steel Ltd. - Overview
Tata Steel Ltd. - Business segments
Tata Steel Ltd. - Key news
Tata Steel Ltd. - Key offerings
Tata Steel Ltd. - Segment focus
SWOT

15.18 Tenaris SA

Tenaris SA - Overview
Tenaris SA - Product / Service
Tenaris SA - Key news
Tenaris SA - Key offerings
SWOT

16. Appendix

16.1 Scope of the report

Market definition
Objectives
Notes and caveats

16.2 Inclusions and exclusions checklist

Inclusions checklist
Exclusions checklist

16.3 Currency conversion rates for US$

16.4 Research methodology

16.5 Data procurement

Information sources

16.6 Data validation

16.7 Validation techniques employed for market sizing

16.8 Data synthesis

16.9 360 degree market analysis

16.10 List of abbreviations

Research Methodology

Technavio presents a detailed picture of the market by way of study, synthesis, and summation of data from multiple sources. The analysts have presented the various facets of the market with a particular focus on identifying the key industry influencers. The data thus presented is comprehensive, reliable, and the result of extensive research, both primary and secondary.

INFORMATION SOURCES

Primary sources

  • Manufacturers and suppliers
  • Channel partners
  • Industry experts
  • Strategic decision makers

Secondary sources

  • Industry journals and periodicals
  • Government data
  • Financial reports of key industry players
  • Historical data
  • Press releases

DATA ANALYSIS

Data Synthesis

  • Collation of data
  • Estimation of key figures
  • Analysis of derived insights

Data Validation

  • Triangulation with data models
  • Reference against proprietary databases
  • Corroboration with industry experts

REPORT WRITING

Qualitative

  • Market drivers
  • Market challenges
  • Market trends
  • Five forces analysis

Quantitative

  • Market size and forecast
  • Market segmentation
  • Geographical insights
  • Competitive landscape

Interested in this report?

Get your sample now to see our research methodology and insights!

Download Now

Frequently Asked Questions

Water And Wastewater Pipe market growth will increase by USD 27656.3 million during 2026-2030.

The Water And Wastewater Pipe market is expected to grow at a CAGR of 6.6% during 2026-2030.

Water And Wastewater Pipe market is segmented by Type (Plastic pipe, Ductile iron pipe , Others) Application (Water supply and distribution, Wastewater management) End-user (Municipal, Industrial, Agricultural)

Advanced Drainage Systems Inc, Aliaxis Holdings SA, Astral Ltd., China Lesso Group Holdings, Geberit International AG, Georg Fischer Ltd., ISCO Industries, Inc., JM Eagle Inc., Logan Clay Products LLC, McWane Inc., Mueller Water Products Inc, Nippon Steel Corp., Northwest Pipe Co, Pipelife International GmbH, Saudi Arabian Amiantit Co., Sekisui Chemical Co. Ltd., Tata Steel Ltd., Tenaris SA, Tessenderlo Group NV, Wavin BV are a few of the key vendors in the Water And Wastewater Pipe market.

APAC will register the highest growth rate of 52.8% among the other regions. Therefore, the Water And Wastewater Pipe market in APAC is expected to garner significant business opportunities for the vendors during the forecast period.

China, India, Japan, South Korea, Australia, Indonesia, US, Canada, Mexico, Germany, France, UK, Italy, Spain, The Netherlands, Saudi Arabia, UAE, South Africa, Israel, Turkey, Brazil, Argentina, Chile

  • Critical imperative for rehabilitating aging infrastructure is the driving factor this market.

The Water And Wastewater Pipe market vendors should focus on grabbing business opportunities from the Type segment as it accounted for the largest market share in the base year.