Wavefront Aberrometer Market Size 2024-2028
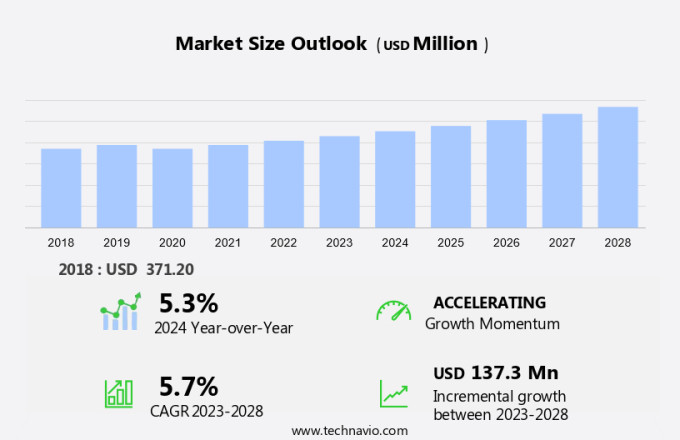
The wavefront aberrometer market size is forecast to increase by USD 137.3 million, at a CAGR of 5.7% between 2023 and 2028.
- The market is experiencing significant growth due to several key factors. The digital transformation and integration of Internet of Things (IoT) technology in eye care have led to increased demand for advanced eye care solutions, such as wavefront-guided LASIK and PRK procedures. These advanced procedures address common eye disorders, including astigmatism, and provide better visual acuity and accuracy compared to traditional methods. Moreover, the increasing number of individuals diagnosed with eye disorders, particularly among the aging population and those with diabetes, has fueled the need for more effective and efficient eye care solutions. Despite the high costs associated with eye surgery, the benefits of improved vision and quality of life have made wavefront aberrometers an attractive investment for both patients and ophthalmologists.
What will be the Size of the Market During the Forecast Period?
- The market is witnessing significant growth due to the increasing demand for precise vision correction. Aberration correction plays a crucial role in ensuring optimal eye health and improving the effectiveness of various eye care procedures. Ophthalmologists and eye care professionals rely on wavefront aberrometry to assess and correct lower-order errors, such as astigmatism and spherical aberrations, which can significantly impact vision quality. These errors can lead to conditions like presbyopia and myopia, affecting both near and far vision. Posterior corneal surface analysis using wavefront aberrometry is essential for planning and executing PRK surgery and laser vision correction procedures. By identifying higher order errors, such as coma and trefoil aberrations, these procedures can be customized to address individual patient needs, ensuring better patient safety and satisfaction. Corneal topography, another essential tool in the eye care industry, benefits from wavefront aberrometry data. This information is crucial for surgical planning and the selection of intraocular lenses, contact lenses, and other vision correction solutions.
- The market offers opportunities for innovation in the vision care industry. With advancements in technology, these devices can provide more accurate measurements, faster results, and improved user experience. This can lead to increased access to care and cost-effectiveness, making vision correction more accessible to a larger population. Patient safety is a primary concern in the eye care industry. Wavefront aberrometry plays a vital role in minimizing risks associated with refractive errors and their correction. Eye drops and eye exams are essential components of the pre- and post-surgery care process. Clinical trials and ongoing research contribute to the development of safer and more effective correction methods. The cost-effectiveness of wavefront aberrometry is another factor driving market growth. As the technology becomes more accessible and affordable, it can lead to increased adoption, particularly in the context of LASIK surgery, cataract surgery, and hyperopia correction. Market data indicates a growing demand for wavefront aberrometry in the vision care industry.
How is this market segmented and which is the largest segment?
The market research report provides comprehensive data (region-wise segment analysis), with forecasts and estimates in "USD million" for the period 2024-2028, as well as historical data from 2018-2022 for the following segments.
- Type
- Electronic
- Ordinary
- Geography
- North America
- Canada
- US
- Europe
- Germany
- UK
- France
- Italy
- Asia
- China
- India
- Japan
- South Korea
- Rest of World (ROW)
- North America
By Type Insights
- The electronic segment is estimated to witness significant growth during the forecast period.
In the realm of advanced eye care, wavefront aberrometers have emerged as essential diagnostic tools. These devices measure the total refractive aberrations of the eye, providing precise data on the eye's refractive power and visual function. Widely used in laser eye surgeries such as LASIK and PRK, wavefront aberrometers ensure excellent precision by measuring every change in the eye, from the cornea to the retina. Electronic wavefront aberrometers, with their integrated autorefractor, keratometer, pupillometer (up to 9.5mm), and corneal topographer, have gained popularity due to their numerous advantages over traditional wavefront aberrometers. The easy alignment and automated recording of wavefront aberrometer data ensure accurate readings.
The market is witnessing significant growth, fueled by the digital transformation in the eye care industry and the increasing adoption of IoT technologies. Ophthalmologists are increasingly relying on these advanced diagnostic tools to address various eye disorders, including astigmatism, with greater precision and efficiency. The integration of wavefront aberrometers into electronic health records and telemedicine platforms further enhances their utility and accessibility.
Get a glance at the market report of share of various segments Request Free Sample
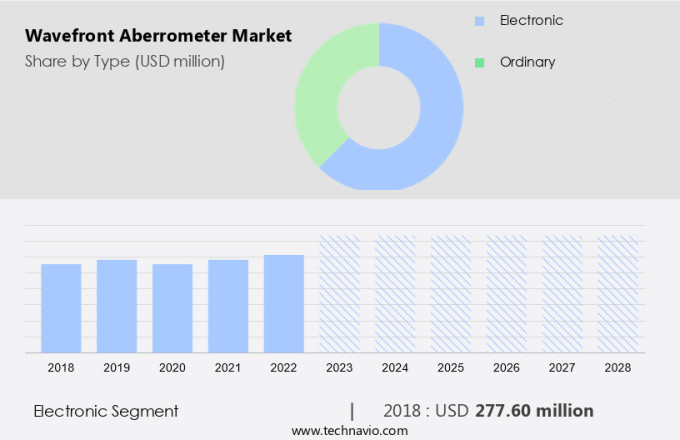
The electronic segment was valued at USD 277.60 million in 2018 and showed a gradual increase during the forecast period.
Regional Analysis
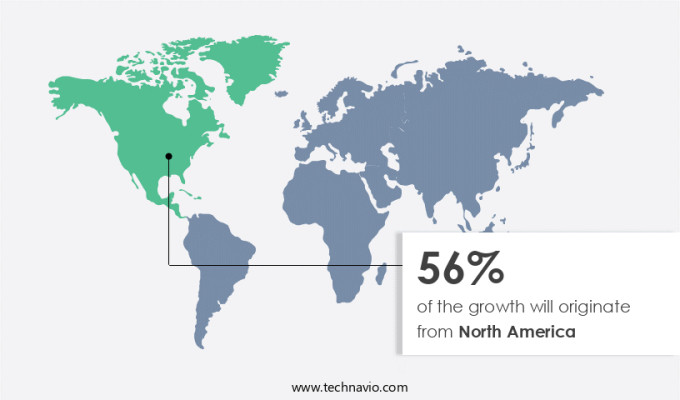
- North America is estimated to contribute 56% to the growth of the global market during the forecast period.
Technavio's analysts have elaborately explained the regional trends and drivers that shape the market during the forecast period.
For more insights on the market share of various regions Request Free Sample
The adoption of advanced eye surgery and diagnostic technologies has been on the rise due to the significant increase in healthcare expenditure in these regions. The American Medical Association reports that healthcare spending in the US grew by 4.6% from USD 3.6 trillion in 2019 to USD 3.8 trillion or USD 11,582 per capita in 2020. This growth can be attributed to the expansion of coverage under the Affordable Care Act, particularly for Medicaid and private health insurance. Additionally, the aging population is a significant factor driving market growth. According to The World Bank Group, the population aged 65 and above in the US and Canada has risen from 46.9 million in 2015 to 54 million in 2020. Ageing populations are more susceptible to refractive errors such as myopia, and require more frequent eye examinations and potential treatments, including those utilizing wavefront aberrometer technology. Economic conditions also play a role, as higher-order errors in eye examinations, such as those identified by wavefront aberrometry, can significantly impact the success of eye laser surgery. Therefore, there is a growing demand for wavefront aberrometer technology in the planning phase of eye surgery to ensure accurate treatment and optimal outcomes.
Market Dynamics
Our researchers analyzed the data with 2023 as the base year, along with the key drivers, trends, and challenges. A holistic analysis of drivers will help companies refine their marketing strategies to gain a competitive advantage.
What are the key market drivers leading to the rise in adoption of Wavefront Aberrometer Market ?
The rise in number of people with eye disorders is the key driver of the market.
- Vision disorders, including cataracts, are on the rise due to factors such as unhealthy diets and prolonged screen time. According to The World Bank, the global population aged 65 and above, who are more susceptible to eye diseases, represented 9.32% of the total population in 2020 and is projected to grow. During medical check-ups, healthcare facilities use wavefront aberrometers to detect and measure spherical aberrations in the eye, which can lead to vision impairment. These devices measure the shape of the pupil and the anterior corneal surface to identify imperfections that cause halos and other visual disturbances.
- Wavefront aberrometers are essential tools in the planning stages of refractive surgery, ensuring accurate and effective procedures. However, their use should be restricted to trained personnel to avoid potential complications. In summary, the increasing prevalence of eye diseases and the aging population necessitate the use of wavefront aberrometers in healthcare facilities to ensure accurate diagnoses and effective treatments.
What are the market trends shaping the Wavefront Aberrometer Market?
An increase in diabetic population is the upcoming trend in the market.
- In the healthcare sector, the rising prevalence of diabetes continues to be a significant concern. This metabolic condition impacts the body's ability to process glucose effectively, leading to high blood sugar levels. One of the complications of diabetes is its impact on the eyes, causing swelling of the lens and affecting vision. Even after blood sugar levels return to normal, it may take up to three months for vision to improve. Diabetes can also lead to more serious conditions such as glaucoma, retinopathy, cataracts, and even permanent vision loss. To address the vision needs of diabetic patients, wavefront aberrometers have emerged as a valuable diagnostic tool.
- These advanced devices help in measuring the refractive errors and irregularities in the shape of the cornea and lens, enabling accurate prescription of spectacles. With the increasing number of diabetic patients, the demand for wavefront aberrometers is expected to surge. Enterprises and Small and Medium Enterprises (SMEs) in the eyewear industry are embracing innovation in the form of predictive analytics, AI, and cloud computing to streamline their business strategies. These technologies enable them to analyze large volumes of data and gain insights into customer preferences, market trends, and operational efficiencies. The market is expected to grow significantly due to these technological advancements and the increasing demand for precision in eye care.
What challenges does Wavefront Aberrometer Market face during its growth?
High costs associated with eye surgery is a key challenge affecting the market growth.
- Eye Globe Vision impairment can be challenging to assess, as it relies on an individual's subjective response during traditional eye exams. These exams typically involve reading letters or shapes on an eye chart. However, the letter an individual actually sees may differ from the intended one. Wavefront aberrometry offers a solution to this issue. This advanced technology objectively determines the refractive power of the eye by evaluating how a light beam travels through it. Wavefront aberrometry employs ray-tracing formulas to measure the movement of light wavefronts as they pass through the eye.
- This technique provides highly accurate measurements of vision errors, including higher-order aberrations that may affect the retina. These precise measurements are crucial for optimizing the performance of eye laser systems. By utilizing wavefront aberrometry, eye care professionals can provide more accurate prescriptions and better address the unique vision needs of myopic patients. This technology enhances the overall effectiveness of vision correction procedures and contributes to improved patient satisfaction. Incorporating wavefront aberrometry into routine eye examinations is an essential step toward addressing the growing prevalence of vision issues in the US population.
Exclusive Customer Landscape
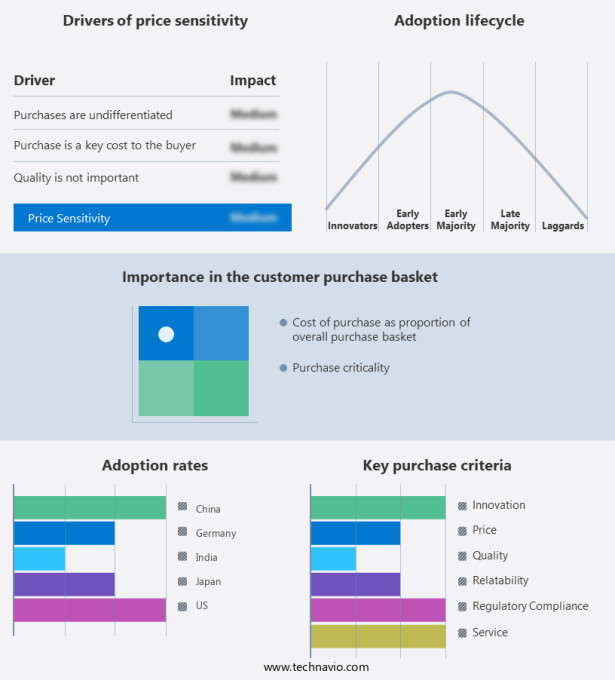
The market forecasting report includes the adoption lifecycle of the market, covering from the innovator's stage to the laggard's stage. It focuses on adoption rates in different regions based on penetration. Furthermore, the market report also includes key purchase criteria and drivers of price sensitivity to help companies evaluate and develop their market growth analysis strategies.
Customer Landscape
Key Companies & Market Insights
Companies are implementing various strategies, such as strategic alliances, market forecast, partnerships, mergers and acquisitions, geographical expansion, and product/service launches, to enhance their presence in the market.
The market research and growth report includes detailed analyses of the competitive landscape of the market and information about key companies, including:
- Bausch Lomb Corp.
- Carl Zeiss AG
- CSO S.r.l
- EssilorLuxottica
- Huvitz Co. Ltd.
- Johnson and Johnson Inc.
- Luneau Technology Group
- Marco Ophthalmic Inc.
- NIDEK Co. Ltd.
- Novartis AG
- Optikon 2000 SpA
- SCHWIND eye-tech-solutions GmbH
- Tomey Corp.
- Topcon America Corp.
- Tracey Technologies
- Vmax Vision Inc.
- Ziemer Ophthalmic Systems AG
Qualitative and quantitative analysis of companies has been conducted to help clients understand the wider business environment as well as the strengths and weaknesses of key market players. Data is qualitatively analyzed to categorize companies as pure play, category-focused, industry-focused, and diversified; it is quantitatively analyzed to categorize companies as dominant, leading, strong, tentative, and weak.
Research Analyst Overview
The market is witnessing significant growth due to the increasing demand for advanced eye care solutions. The integration of AI and machine learning in wavefront aberrometers is driving innovation in the market. These technologies enable predictive analytics, allowing ophthalmologists and clinicians to identify and address higher-order aberrations, such as spherical and coma aberrations, in the planning phase. The market is also witnessing digital transformation with the adoption of cloud computing and IoT in eye care facilities. Wavefront aberrometers are essential tools in eye surgery, including LASIK and PRK, for treating vision errors like myopia, hyperopia, astigmatism, and ageing populations' eye disorders.
Further, the market's growth is influenced by economic conditions and the increasing number of specialty clinics offering refractive surgery. The use of wavefront aberrometers in medical check-ups and eye disease diagnosis is also expanding. Wavefront aberrometers measure the eye's anterior corneal surface and eye globe to identify refractive errors and higher-order aberrations. These instruments use ray-tracing formulas and light beam analysis to determine the light foci on the retina, ensuring precision in eye surgery. Despite the market's growth, there are challenges, including limited testing capabilities and the need for skilled personnel to operate wavefront aberrometers. Economic conditions and planning stages also impact the market's development.
|
Market Scope |
|
|
Report Coverage |
Details |
|
Page number |
160 |
|
Base year |
2023 |
|
Historic period |
2018-2022 |
|
Forecast period |
2024-2028 |
|
Growth momentum & CAGR |
Accelerate at a CAGR of 5.7% |
|
Market Growth 2024-2028 |
USD 137.3 million |
|
Market structure |
Fragmented |
|
YoY growth 2023-2024(%) |
5.3 |
|
Key countries |
US, China, Japan, Germany, India, France, Canada, South Korea, UK, and Italy |
|
Competitive landscape |
Leading Companies, Market Positioning of Companies, Competitive Strategies, and Industry Risks |
What are the Key Data Covered in this Market Research and Growth Report?
- CAGR of the market during the forecast period
- Detailed information on factors that will drive the market growth and forecasting between 2024 and 2028
- Precise estimation of the size of the market and its contribution of the market in focus to the parent market
- Accurate predictions about upcoming market growth and trends and changes in consumer behaviour
- Growth of the market across North America, Europe, Asia, and Rest of World (ROW)
- Thorough analysis of the market's competitive landscape and detailed information about companies
- Comprehensive analysis of factors that will challenge the growth of market companies
We can help! Our analysts can customize this market research report to meet your requirements.


