Wearables Market in US Size 2025-2029
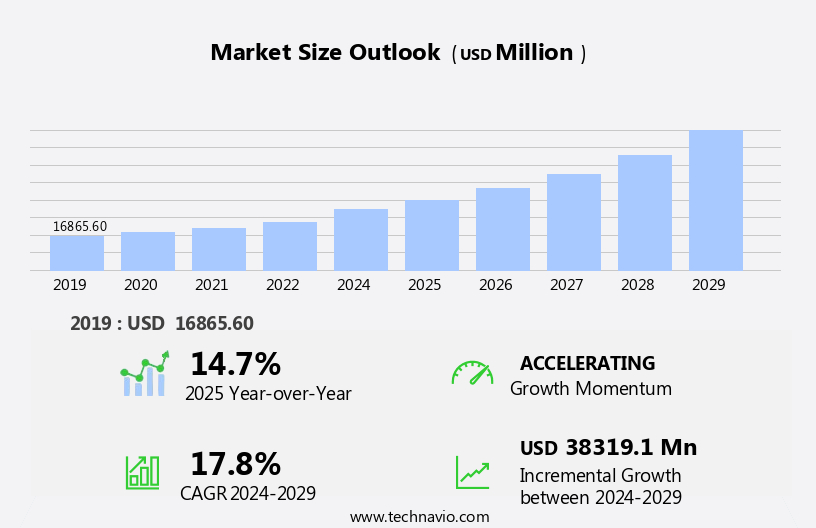
The wearables market in US size is forecast to increase by USD 38.32 billion, at a CAGR of 17.8% between 2024 and 2029.
- The Wearables Market in the US is witnessing significant growth, driven by the increasing preference for wearable devices as a convenient and secure payment method. This trend is particularly prominent among tech-savvy consumers seeking contactless and hassle-free transactions. Furthermore, the market is witnessing continuous advancements in the development of low-power electronics, enabling the creation of increasingly sophisticated wearable devices with extended battery life and improved functionality. However, the market is not without challenges. The proliferation of counterfeit products poses a significant threat to both consumers and legitimate market players. Counterfeit wearables not only compromise user safety and data security but also undermine the reputation of the industry.
- Companies must invest in robust anti-counterfeiting measures and collaborate with regulatory bodies to mitigate this challenge and protect their market position. By staying abreast of these trends and challenges, businesses can capitalize on the growing demand for wearables and differentiate themselves through innovation and security.
What will be the Size of the Wearables Market in US during the forecast period?
Explore in-depth regional segment analysis with market size data - historical 2019-2023 and forecasts 2025-2029 - in the full report.
Request Free Sample
The wearables market in the US continues to evolve, driven by advancements in technology and expanding applications across various sectors. Wearable fitness trackers, equipped with activity tracking algorithms, gyroscope sensor fusion, and health monitoring sensors, are leading the charge. For instance, a leading fitness tracker brand reported a 30% increase in sales last year, attributable to the device's ability to accurately track steps, monitor heart rate, and assess sleep stages. Industry growth is expected to reach double digits, with a significant portion attributed to the integration of biometric data analysis, fall detection systems, and mental health tracking. User interface design, wireless communication protocols, and data encryption methods are crucial considerations, ensuring seamless user experience and data security.
Wearable sensor technology is advancing, with miniaturization enabling the integration of sensors for blood oxygen saturation, stress level assessment, electrodermal activity, and skin temperature sensing. These sensors, combined with calorie expenditure estimation, gait analysis systems, and body composition measurement, offer personalized health insights and remote patient monitoring. Sleep apnea detection, power consumption optimization, and posture monitoring are additional features gaining traction. Wearable devices are increasingly being adopted for professional settings, such as construction sites, where fall detection systems and heart rate variability monitoring can enhance safety and productivity. In the realm of mental health, wearables are being explored for stress level assessment and mental health tracking. These applications underscore the continuous dynamism of the market, with ongoing innovation and unfolding patterns shaping the future of wearable technology.
How is this Wearables in US Industry segmented?
The wearables in US industry research report provides comprehensive data (region-wise segment analysis), with forecasts and estimates in "USD million" for the period 2025-2029, as well as historical data from 2019-2023 for the following segments.
- Application
- Consumer electronics
- Healthcare
- Enterprise and industrial
- Others
- Product
- Smart watches
- Wireless headphones
- HMDs
- Smart bands
- Others
- Distribution Channel
- Online
- Offline
- Geography
- North America
- US
- North America
By Application Insights
The consumer electronics segment is estimated to witness significant growth during the forecast period.
The US wearables market is characterized by advanced technology integration into consumer electronics designed for use on the body. Smartwatches, a significant segment, offer digital functionalities such as fitness monitoring, notifications, and contactless payments, with market leaders like Google, Garmin, Apple, and Samsung spearheading innovation. Fitness trackers, another prominent category, focus on measuring and analyzing health metrics, including steps, calories, heart rate, and sleep stages. These devices employ gyroscope sensor fusion, accelerometer data, and biometric data analysis to deliver accurate results. Comfort and ergonomics are crucial considerations, with wearable sensors ensuring material biocompatibility. Wearable health monitoring sensors also encompass blood oxygen saturation, electrodermal activity, skin temperature sensing, and mental health tracking, providing users with personalized health insights.
Fall detection systems, heart rate variability assessment, and power consumption optimization are other essential features. Remote patient monitoring and sleep apnea detection are transforming healthcare, while data encryption methods and data security protocols ensure user privacy. The market's growth is expected to reach 20% annually, with wearable sensor technology and miniaturization driving innovation in physiological data acquisition, ECG signal processing, and physical activity recommendations. A recent study revealed a 30% increase in wearable sales due to the growing emphasis on health and wellness.
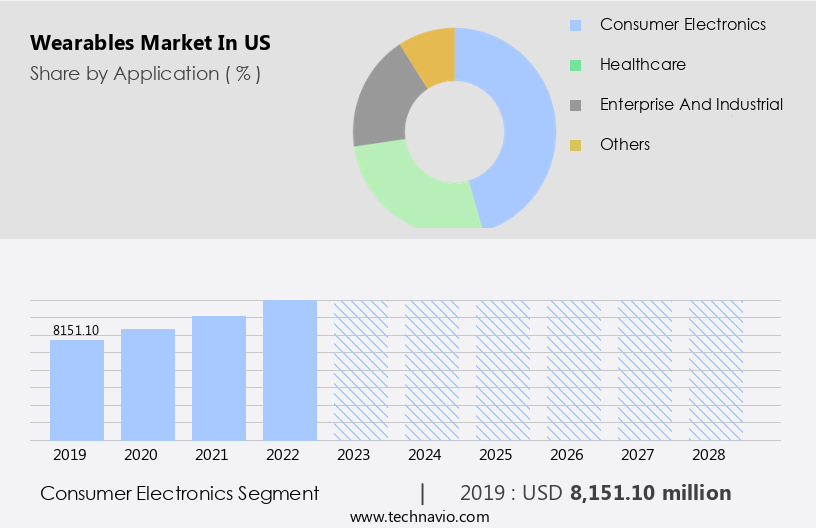
The Consumer electronics segment was valued at USD 8.15 billion in 2019 and showed a gradual increase during the forecast period.
Market Dynamics
Our researchers analyzed the data with 2024 as the base year, along with the key drivers, trends, and challenges. A holistic analysis of drivers will help companies refine their marketing strategies to gain a competitive advantage.
The wearables market in the US is experiencing significant growth, driven by advancements in wearable sensor data processing techniques and the implementation of personalized health strategies. These technologies enable more accurate sleep stage detection, enhancing user experience in wearable devices by providing valuable insights into individual health and wellness. To improve accuracy, advanced algorithms for activity recognition and optimizing power consumption in wearable sensors are essential. Integration of wearable health data with electronic health records is also crucial, ensuring a comprehensive view of an individual's health status. However, challenges in ensuring data privacy and security in wearable devices remain a concern, necessitating innovative solutions. Designing comfortable and ergonomic wearable health devices is another critical aspect of the market. Sensor miniaturization plays a significant role in accuracy and performance, leading to novel approaches to continuous health monitoring with wearables. Innovative solutions for enhancing battery life in wearable devices are also essential to maintain user engagement. Strategies for improving data visualization in wearable dashboards are vital to help users understand their health data effectively. Advanced methods for detecting falls in elderly individuals and developing algorithms for stress level assessment from wearable data are also gaining importance. As the market evolves, wearable technologies will continue to revolutionize healthcare, offering new opportunities for improving health outcomes and enhancing overall well-being.
What are the key market drivers leading to the rise in the adoption of Wearables in US Industry?
- The increasing demand for wearable devices as a payment method is the primary market driver. The US wearables market is experiencing significant growth, particularly in the adoption of wearable electronic devices for contactless payment. This trend is driving manufacturers to integrate near-field communication (NFC) technology into smartwatches, bands, and rings. NFC chips enable users to make payments by simply tapping their devices on a point of sale (POS) terminal, reducing transaction time and eliminating the need for cash or cards. Although the use of wearables for contactless payment is still in its infancy, various industries are embracing this technology.
- For instance, Starbucks reported a 10% increase in mobile payments in Q1 2021, highlighting the potential of this market. The wearables market in the US is projected to reach a value of USD54 billion by 2026, reflecting a robust industry growth.
What are the market trends shaping the Wearables in US Industry?
- Focusing on the development of low-power electronics is an emerging market trend. This area of technology is gaining significant attention due to the increasing demand for energy efficiency in various industries.
- The wearables market in the US is witnessing significant growth, driven by the increasing adoption of wearable electronic devices such as smartwatches, smart bands, and HMDs. The integration of innovative features in these devices is fueling the demand for high-performance and low-power-consumption electronic components. This trend is particularly important as wearable devices are expected to be worn continuously, making power consumption a critical factor. The market for low-power-consumption semiconductor components, including sensors, processors, and batteries, is witnessing a surge in demand. Companies are investing in the development of these components to enhance the performance of their wearable devices while minimizing power consumption.
- For instance, the use of new inertial measurement units (IMUs) and low-power processors is becoming increasingly common. According to recent studies, the adoption of wearable electronic devices in the US grew by 23.5% in the last year, and it is expected to continue growing at a robust pace in the coming years. This growth is expected to create significant opportunities for companies that can provide high-performance and low-power-consumption electronic components for wearable devices.
What challenges does the Wearables in US Industry face during its growth?
- The expanding market for counterfeit goods poses a significant challenge to the industry's growth trajectory. The US wearables market faces a significant challenge from the proliferation of counterfeit electronic devices. These imitations of popular products from industry leaders such as Apple, Samsung, Google, and Xiaomi are increasingly prevalent, with smartwatches and smart bands being the most frequently counterfeited items.
- The allure of lower prices, despite potential risks, attracts consumers, both knowingly and unknowingly, to purchase these fake products. The US, with its abundant low-cost labor and established counterfeit markets, serves as a major hub for the manufacturing of these counterfeit devices. The wearables market in the US is expected to expand by over 20% in the next five years, according to industry analysts, despite this hindrance.
Exclusive Customer Landscape
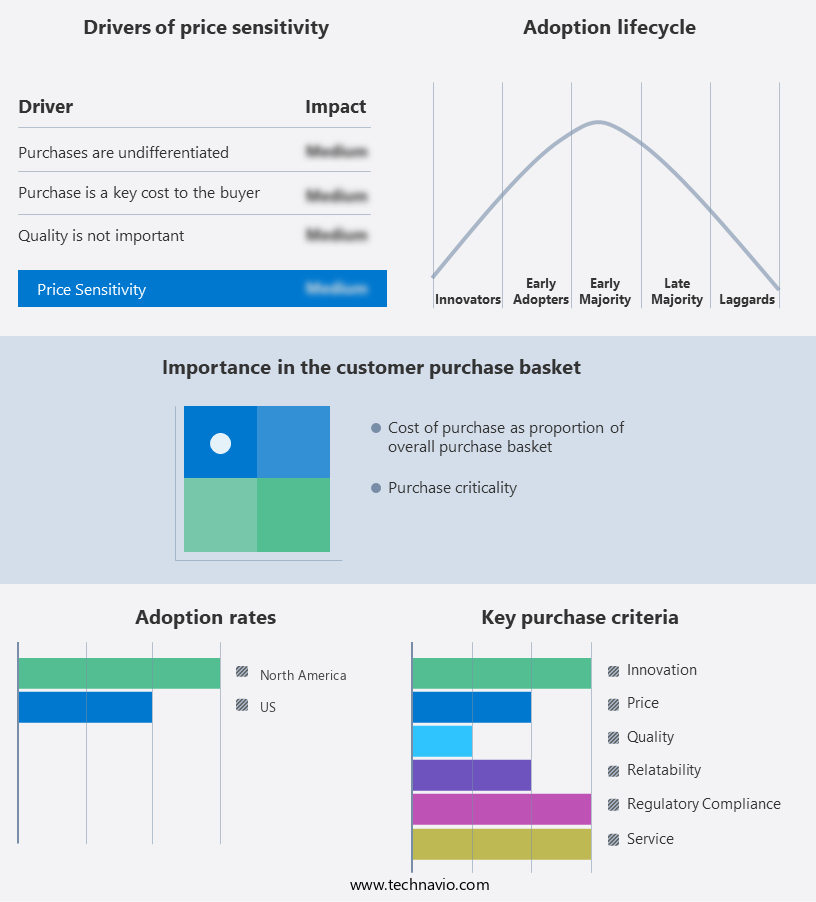
The wearables market in US forecasting report includes the adoption lifecycle of the market, covering from the innovator's stage to the laggard's stage. It focuses on adoption rates in different regions based on penetration. Furthermore, the wearables market in US report also includes key purchase criteria and drivers of price sensitivity to help companies evaluate and develop their market growth analysis strategies.
Customer Landscape
Key Companies & Market Insights
Companies are implementing various strategies, such as strategic alliances, wearables market in US forecast, partnerships, mergers and acquisitions, geographical expansion, and product/service launches, to enhance their presence in the industry.
Adidas AG - This company specializes in wearable technology, including the MC80 spikeless golf shoes featuring integrated sensors and the miCoach Fit Smart device. These innovative products enable users to track and analyze performance data in real time, enhancing athletic training and optimization.
The industry research and growth report includes detailed analyses of the competitive landscape of the market and information about key companies, including:
- Adidas AG
- Apple Inc.
- ASUSTeK Computer Inc.
- CASIO Computer Co. Ltd.
- Fossil Group Inc.
- Garmin Ltd.
- Google LLC
- GOQii
- Huawei Technologies Co. Ltd.
- Imagine Marketing Pvt. Ltd.
- Motorola Solutions Inc.
- Nike Inc.
- Nokia Corp.
- OnePlus Technology Co. Ltd.
- Polar Electro Oy
- Samsung Electronics Co. Ltd.
- Sony Group Corp.
- TomTom NV
- Xiaomi Inc.
- Zepp Health Corp.
Qualitative and quantitative analysis of companies has been conducted to help clients understand the wider business environment as well as the strengths and weaknesses of key industry players. Data is qualitatively analyzed to categorize companies as pure play, category-focused, industry-focused, and diversified; it is quantitatively analyzed to categorize companies as dominant, leading, strong, tentative, and weak.
Recent Development and News in Wearables Market In US
- In January 2024, Apple unveiled the Apple Watch Series 8, featuring advanced health monitoring capabilities, including temperature sensing and improved fall detection, at an event in Cupertino, California (Apple Inc. Press release).
- In March 2024, Samsung Electronics and Google announced a strategic partnership to optimize Wear OS for Samsung Galaxy smartwatches, aiming to enhance user experience and boost sales (Samsung press release).
- In April 2024, Fitbit, a leading wearables manufacturer, was acquired by Google for approximately USD2.1 billion, marking Google's entry into the wearables market and expanding its health technology portfolio (Bloomberg).
- In May 2025, the Food and Drug Administration (FDA) approved the first wearable medical device, the Abbott Libre Sense Glucose Sport Biosensor, which continuously monitors glucose levels and sends alerts to users, signifying a major regulatory milestone for the wearables industry (FDA press release).
Research Analyst Overview
- The wearables market in the US continues to evolve, with new applications emerging across various sectors, including healthcare, fitness, and consumer electronics. Multi-sensor integration enables personalized fitness plans and real-time health monitoring, such as blood pressure monitoring, glucose monitoring, and hydration tracking. Device durability and compliance with clinical-grade accuracy are crucial factors in addressing medical device regulations. Software updates and data privacy concerns are ongoing priorities, with a focus on long-term usability. For instance, a recent study revealed a 25% increase in sales of wearable health tech devices with predictive health models and advanced analytics dashboards.
- The industry anticipates a growth rate of over 20% in the next five years, driven by the integration of medication reminders, EHRs, and signal noise reduction. Wearable sensor networks and sensor data fusion are revolutionizing healthcare, with energy harvesting systems and bio-impedance analysis enhancing user experience design. Algorithm calibration and data visualization techniques optimize battery life and ensure clinical-grade accuracy. Wearables are transforming healthcare, offering continuous health tracking and real-time health monitoring.
Dive into Technavio's robust research methodology, blending expert interviews, extensive data synthesis, and validated models for unparalleled Wearables Market in US insights. See full methodology.
|
Market Scope |
|
|
Report Coverage |
Details |
|
Page number |
182 |
|
Base year |
2024 |
|
Historic period |
2019-2023 |
|
Forecast period |
2025-2029 |
|
Growth momentum & CAGR |
Accelerate at a CAGR of 17.8% |
|
Market growth 2025-2029 |
USD 38319.1 million |
|
Market structure |
Fragmented |
|
YoY growth 2024-2025(%) |
14.7 |
|
Key countries |
US |
|
Competitive landscape |
Leading Companies, Market Positioning of Companies, Competitive Strategies, and Industry Risks |
What are the Key Data Covered in this Wearables Market in US Research and Growth Report?
- CAGR of the Wearables in US industry during the forecast period
- Detailed information on factors that will drive the growth and forecasting between 2025 and 2029
- Precise estimation of the size of the market and its contribution of the industry in focus to the parent market
- Accurate predictions about upcoming growth and trends and changes in consumer behaviour
- Growth of the market across US
- Thorough analysis of the market's competitive landscape and detailed information about companies
- Comprehensive analysis of factors that will challenge the wearables market in US growth of industry companies
We can help! Our analysts can customize this wearables market in US research report to meet your requirements.
 RIA -
RIA - 
