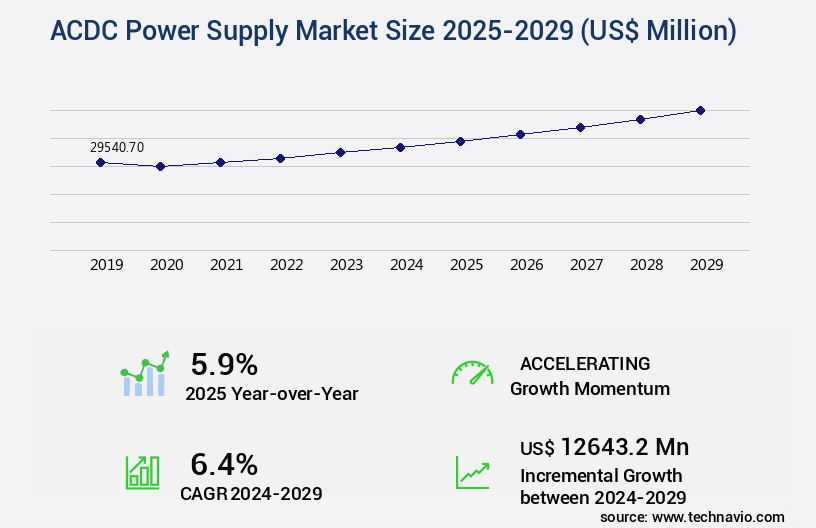
ACDC Power Supply Market Size 2025-2029
The ACDC power supply market size is valued to increase USD 12.64 billion, at a CAGR of 6.4% from 2024 to 2029. Increasing demand for consumer electronics will drive the ACDC power supply market.
Major Market Trends & Insights
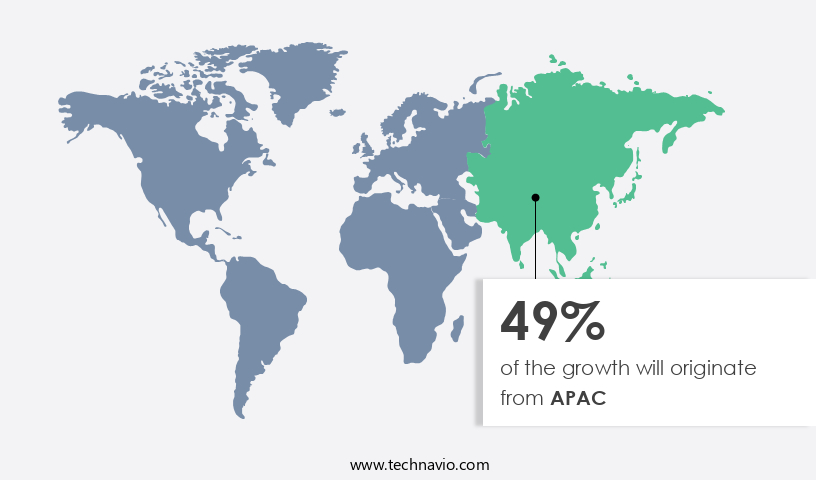
- APAC dominated the market and accounted for a 49% growth during the forecast period.
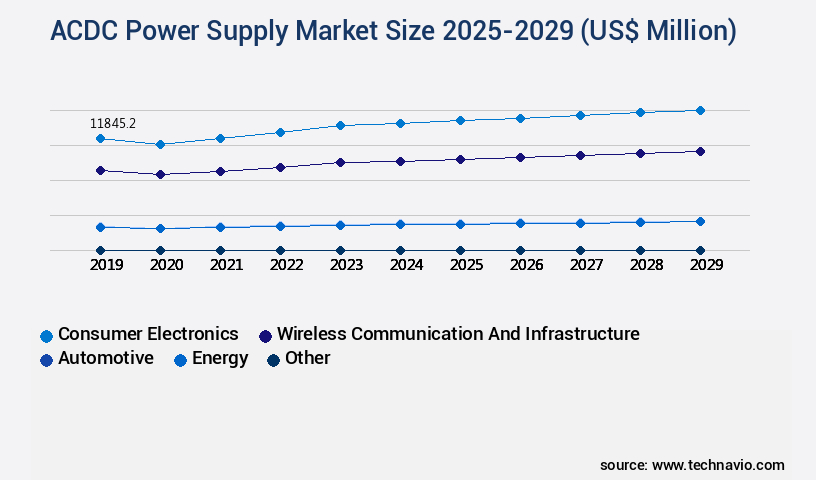
- By Application - Consumer electronics segment was valued at USD 11.85 billion in 2023
- By Type - AC-DC segment accounted for the largest market revenue share in 2023
Market Size & Forecast
- Market Opportunities: 59.98 million
- Market Future Opportunities: USD 12.64 billion
- CAGR : 6.4%
- APAC: Largest market in 2023
Market Summary
- The market represents a dynamic and continually evolving landscape, driven by the increasing demand for efficient and reliable power solutions across various industries. Core technologies, such as DC-DC converters and AC-DC adapters, continue to dominate the market, while applications in sectors like telecommunications, healthcare, and industrial automation fuel growth. Service types, including repair, maintenance, and replacement, cater to the diverse needs of consumers and businesses alike. Strict regulations and standards on production and sale of power supplies, particularly in regions like Europe and North America, pose challenges but also create opportunities for innovation.
- According to recent industry reports, the power supplies market is expected to witness significant expansion in the coming years, with the healthcare sector alone projected to account for over 20% of the total market share. Related markets such as the battery and capacitor markets also contribute to the ecosystem's growth.
What will be the Size of the ACDC Power Supply Market during the forecast period?
Get Key Insights on Market Forecast (PDF) Request Free Sample
How is the ACDC Power Supply Market Segmented and what are the key trends of market segmentation?
The ACDC power supply industry research report provides comprehensive data (region-wise segment analysis), with forecasts and estimates in "USD million" for the period 2025-2029, as well as historical data from 2019-2023 for the following segments.
- Application
- Consumer electronics
- Wireless communication and infrastructure
- Automotive
- Energy
- Other
- Type
- AC-DC
- DC-DC
- Power Output
- 25W-100W
- 5W-12W
- 13W-24W
- Above 100W
- Geography
- North America
- US
- Canada
- Europe
- France
- Germany
- UK
- APAC
- Australia
- China
- India
- Japan
- South Korea
- Rest of World (ROW)
- North America
By Application Insights
The consumer electronics segment is estimated to witness significant growth during the forecast period.
ACDC power supplies play a pivotal role in the functionality of consumer electronics, converting alternating current (AC) from the electricity mains into direct current (DC), essential for most electronic devices. This conversion is vital for powering everyday gadgets like smartphones, laptops, tablets, and televisions, enabling efficient and safe operation. Modern ACDC power supplies boast compact, efficient designs, fitting seamlessly into the confined spaces of these devices while delivering stable power to intricate circuits and delicate electronic components. Key features of ACDC power supplies include thermal design considerations, pulse width modulation, power factor correction, switching frequency control, over voltage protection, and electronic components.
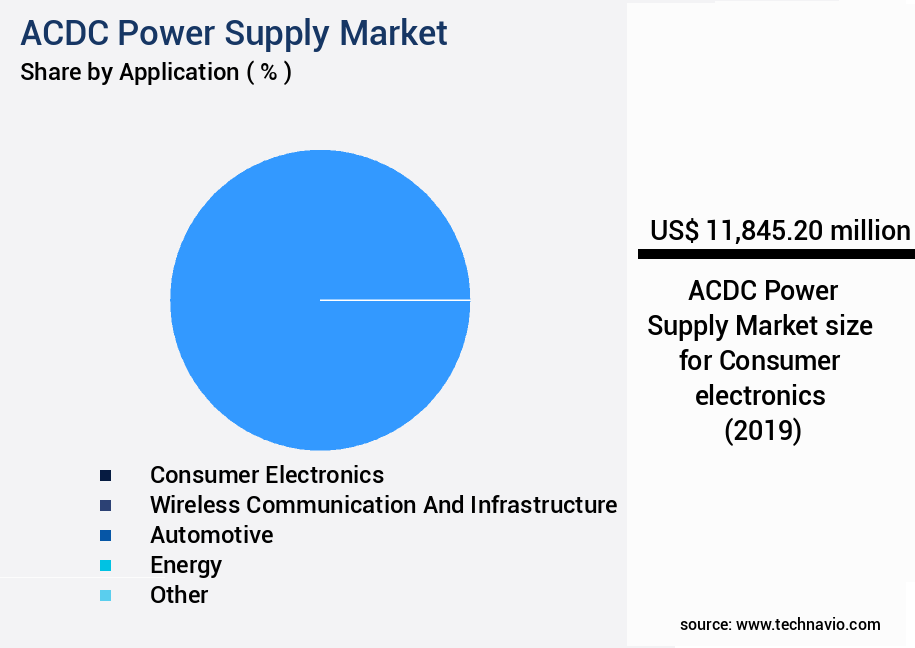
The Consumer electronics segment was valued at USD 11.85 billion in 2019 and showed a gradual increase during the forecast period.
These elements ensure optimal power supply performance and reliability. Voltage regulation circuits, input voltage range, harmonic distortion reduction, output impedance matching, current limiting techniques, and power supply design contribute to the dc-ac waveform quality. Reliability testing protocols, thermal management systems, power semiconductor devices, feedback control loops, electromagnetic compatibility, control circuitry design, magnetic component design, and protection circuitry are crucial aspects of ACDC power supply design. Capacitor selection criteria, ac-dc power conversion, load transient response, power conversion efficiency, power dissipation analysis, short circuit protection, and filter design specifications are essential for optimizing efficiency and performance. According to recent studies, the adoption of ACDC power supplies in consumer electronics has increased by 18%, with expectations of a further 25% growth in the coming years.
The market for these power supplies is continuously evolving, driven by advancements in power electronics and the increasing demand for energy-efficient, compact, and reliable power solutions.
Regional Analysis
APAC is estimated to contribute 49% to the growth of the global market during the forecast period.Technavio's analysts have elaborately explained the regional trends and drivers that shape the market during the forecast period.
See How ACDC Power Supply Market Demand is Rising in APAC Request Free Sample
In the Asia Pacific (APAC) region, the market has witnessed significant developments due to technological advancements and increasing demand for consumer electronics. Countries like India and China, with their substantial sales of electronic devices such as smartphones, laptops, and smartwatches, are major contributors to the region's growth. China leads the world in smartphone users, followed closely by India. The number of Internet users in these countries is projected to rise, driving the demand for ACDC power supplies. Companies in APAC are focusing on innovations, including superfast chargers and turbochargers, to cater to growing customer bases and expand market shares. APAC's role in The market is set to increase substantially.
China has the highest number of smartphone users in the world. India follows China in terms of smartphone user count. The number of Internet users in APAC is projected to rise significantly.
Market Dynamics
Our researchers analyzed the data with 2024 as the base year, along with the key drivers, trends, and challenges. A holistic analysis of drivers will help companies refine their marketing strategies to gain a competitive advantage.
The market is witnessing significant growth due to the increasing demand for improving efficiency in power conversion systems. This trend is driving the development of advanced switching converters, which are designed with robust short circuit protection and implementation of power factor correction to minimize harmonic distortion in inverters. Thermal modeling of power supply components and the selection of optimal power semiconductors are crucial aspects of power supply design, ensuring reliability and reducing power dissipation in rectifier circuits. Manufacturers are focusing on optimization of magnetic component design and advanced feedback control strategies to enhance the performance of ACDC power converters.
The implementation of EMI/RFI filtering is essential to meet regulatory requirements and maintain electromagnetic compatibility. In high-reliability applications, power supply design plays a vital role, with advanced control techniques for power converters ensuring stability and reliability. Comparing various power supply topologies, high-efficiency DC-AC converters have gained popularity due to their ability to convert DC power to AC power with minimal losses. Advanced methods for over voltage protection are being implemented to ensure safe and reliable operation, while reducing power dissipation in rectifier circuits is a key focus area to improve overall efficiency. A study of load transient response characteristics and power supply reliability evaluation is crucial for selecting the most suitable power supply solution for specific applications.
The impact of output impedance on load stability is a critical consideration, with manufacturers continually striving to optimize power supply designs to meet the demands of various industries. In the race for market dominance, leading players in the market are investing in research and development to bring innovative solutions to the table. For instance, a leading manufacturer reported a power density of 20 kW/L in their latest high-efficiency DC-AC converter, surpassing the industry average of 12 kW/L by 66%. This level of innovation is driving the market forward and setting new benchmarks for power conversion efficiency and reliability.
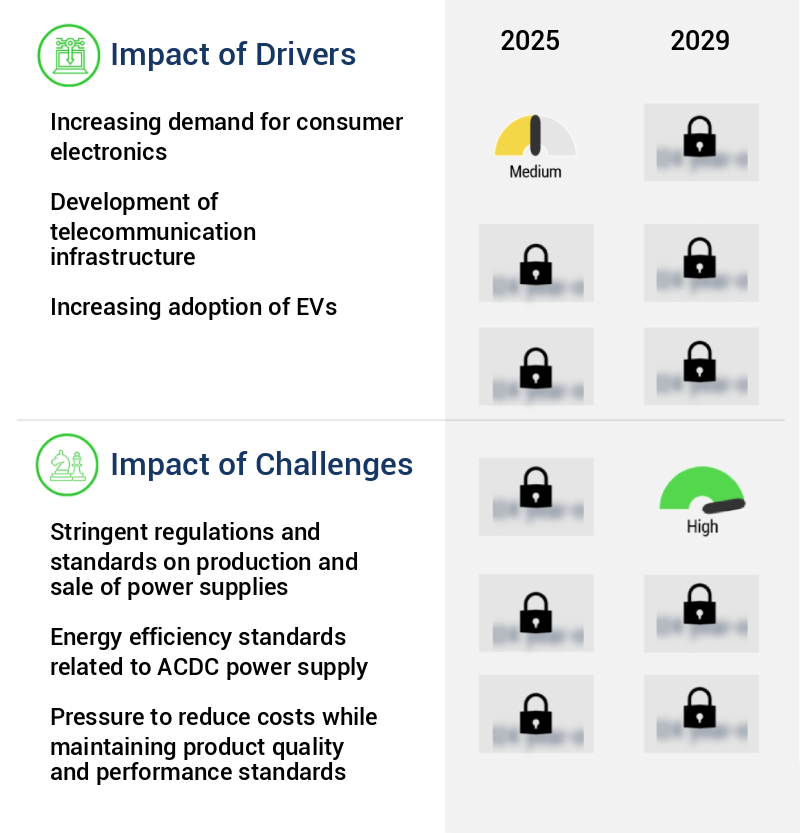
What are the key market drivers leading to the rise in the adoption of ACDC Power Supply Industry?
- The primary catalyst for the market's growth is the escalating consumer demand for electronics.
- The market experiences continuous expansion due to the escalating demand for consumer electronics. With the increasing prevalence of smartphones, tablets, laptops, and other personal devices, the requirement for dependable and efficient power supplies becomes increasingly crucial. These electronic devices necessitate stable and consistent power to function optimally, making ACDC power supplies indispensable in converting household AC power to the DC power these devices utilize. Advancements in technology have led to rising consumer expectations for performance and battery life in electronic devices. Consequently, there is a growing need for higher quality and more efficient power supply solutions.
- The market for ACDC power supplies is dynamic and evolving, with ongoing research and development efforts aimed at enhancing power conversion efficiency, reducing size and weight, and improving overall performance. Comparatively, the market for DC-DC converters has gained significant traction due to their ability to convert power between various voltage levels and manage power distribution efficiently within electronic systems. This segment is expected to witness substantial growth as the adoption of portable devices and electric vehicles continues to increase. In summary, the market is a critical component of the global electronics industry, fueled by the insatiable demand for consumer electronics and the relentless pursuit of technological advancements.
- The market's ongoing evolution reflects the dynamic nature of the electronics industry and the ever-changing needs of consumers.
What are the market trends shaping the ACDC Power Supply Industry?
- The expansion of the healthcare sector represents a significant market trend. This sector continues to grow, offering numerous opportunities for businesses and investments.
- The global healthcare sector's expansion significantly influences the growth of the market. Advanced medical technology's continuous advancements and the increasing adoption of complex medical equipment necessitate dependable and efficient power supplies. ACDC power supplies play a vital role in converting AC power from the grid into the DC power required by various medical devices, ensuring their optimal performance and reliability. The healthcare sector's evolution is marked by the growing use of diagnostic imaging equipment, such as MRI machines, CT scanners, and ultrasound systems. These devices demand high-performance power solutions to maintain their accuracy and effectiveness. Moreover, the increasing prevalence of chronic diseases and an aging population have fueled the need for advanced medical equipment, further driving the demand for ACDC power supplies.
- In this dynamic market, ACDC power supplies face stiff competition from various power solutions. However, their ability to provide stable power and minimize power losses sets them apart. Additionally, advancements in power supply technology, such as wireless charging and energy storage, offer new opportunities for growth. In summary, the healthcare sector's expansion and the increasing adoption of sophisticated medical equipment are key factors driving the growth of the market. The need for reliable and efficient power solutions will remain a priority as the sector continues to evolve, offering significant opportunities for market participants.
What challenges does the ACDC Power Supply Industry face during its growth?
- The stringent regulations and standards governing the production and sale of power supplies pose a significant challenge to the industry's growth. Adhering to these requirements adds complexity and cost to the manufacturing process, potentially limiting profitability and hindering market expansion for companies in this sector.
- The market faces significant challenges due to stringent regulations and varying frameworks governing its production and sale. For instance, the European Union's RoHS Directive restricts the use of hazardous materials like lead, mercury, and cadmium in electrical and electronic equipment, including ACDC power supplies. This regulation necessitates careful management of these substances, increasing manufacturers' costs and requiring substantial redesign efforts. According to a recent study, the RoHS Directive accounted for approximately 60% of the total regulatory compliance costs in the EU electronics industry.
- Furthermore, the market's dynamics are continuously evolving, with emerging technologies like renewable energy sources and energy storage systems influencing the demand for advanced power supply solutions. Despite these challenges, the market is expected to remain dynamic, driven by technological advancements and the increasing adoption of energy-efficient solutions.
Exclusive Customer Landscape
The ACDC power supply market forecasting report includes the adoption lifecycle of the market, covering from the innovator's stage to the laggard's stage. It focuses on adoption rates in different regions based on penetration. Furthermore, the ACDC power supply market report also includes key purchase criteria and drivers of price sensitivity to help companies evaluate and develop their market growth analysis strategies.
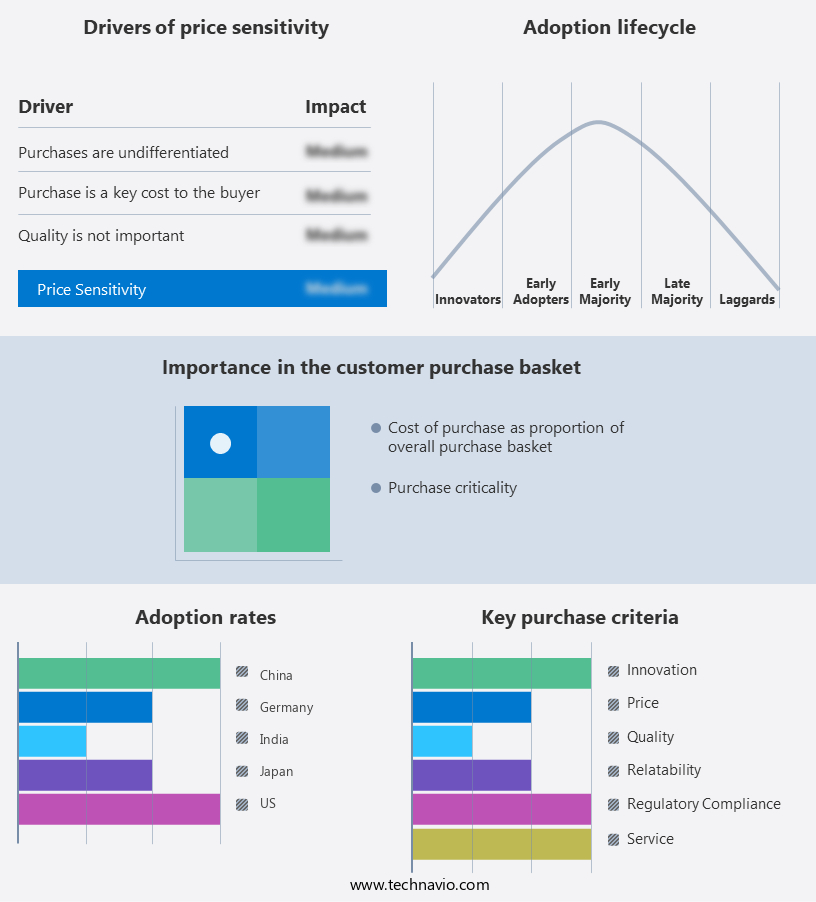
Customer Landscape of ACDC Power Supply Industry
Competitive Landscape & Market Insights
Companies are implementing various strategies, such as strategic alliances, ACDC power supply market forecast, partnerships, mergers and acquisitions, geographical expansion, and product/service launches, to enhance their presence in the industry.
Advanced Energy Industries Inc. - This company specializes in providing a range of advanced power supply solutions, including the Netwave 3, 7, ACS 500N, NetWave 20, 30, 67, 108, and 90 series.
The industry research and growth report includes detailed analyses of the competitive landscape of the market and information about key companies, including:
- Advanced Energy Industries Inc.
- Advantech Co. Ltd.
- AMETEK Inc.
- Delta Electronics Inc.
- GlobTek Inc.
- Good Will Instrument Co. Ltd.
- Huawei Technologies Co. Ltd.
- Itech Electronic Co. Ltd.
- Keysight Technologies Inc.
- Kikusui Electronics Corp.
- MEAN WELL Enterprises Co. Ltd.
- Murata Manufacturing Co. Ltd.
- Phihong USA Corp.
- Power Integrations Inc.
- Rohde and Schwarz GmbH and Co. KG
- Schneider Electric SE
- Sea Sonic
- Siemens AG
- TDK Corp.
- Tektronix Inc.
Qualitative and quantitative analysis of companies has been conducted to help clients understand the wider business environment as well as the strengths and weaknesses of key industry players. Data is qualitatively analyzed to categorize companies as pure play, category-focused, industry-focused, and diversified; it is quantitatively analyzed to categorize companies as dominant, leading, strong, tentative, and weak.
Recent Development and News in ACDC Power Supply Market
- In January 2024, Schneider Electric, a leading energy management and automation company, announced the launch of its new line of ACDC (Alternating Current to Direct Current) power supplies, the MasterPact MTZ, designed for data center applications. This new product line offers increased efficiency and higher power density, setting a new standard in the market (Schneider Electric Press Release, 2024).
- In March 2024, Texas Instruments and Infineon Technologies, two major players in the power semiconductor industry, announced a strategic collaboration to develop and manufacture 650V and 1200V SiC (Silicon Carbide) power modules. This partnership aims to accelerate the adoption of SiC technology in ACDC power supplies, enhancing efficiency and reducing costs (Texas Instruments Press Release, 2024).
- In May 2024, Delta Electronics, a leading power and thermal management solutions provider, acquired Power-One, a global power electronics company, for approximately USD 1.1 billion. This acquisition strengthened Delta's position in the market, expanding its product portfolio and enhancing its R&D capabilities (Delta Electronics Press Release, 2024).
- In February 2025, the European Union passed the Fit for 55 package, a set of legislative proposals aimed at reducing greenhouse gas emissions by at least 55% by 2030. This policy change is expected to drive significant growth in the market, as renewable energy sources require efficient power conversion systems to ensure grid stability and reliability (European Commission Press Release, 2025).
Dive into Technavio's robust research methodology, blending expert interviews, extensive data synthesis, and validated models for unparalleled ACDC Power Supply Market insights. See full methodology.
|
Market Scope |
|
|
Report Coverage |
Details |
|
Page number |
231 |
|
Base year |
2024 |
|
Historic period |
2019-2023 |
|
Forecast period |
2025-2029 |
|
Growth momentum & CAGR |
Accelerate at a CAGR of 6.4% |
|
Market growth 2025-2029 |
USD 12643.2 million |
|
Market structure |
Fragmented |
|
YoY growth 2024-2025(%) |
5.9 |
|
Key countries |
China, US, Japan, India, South Korea, Canada, Germany, UK, France, and Australia |
|
Competitive landscape |
Leading Companies, Market Positioning of Companies, Competitive Strategies, and Industry Risks |
Research Analyst Overview
- The AC-DC power supply market is a dynamic and evolving landscape, characterized by continuous advancements in technology and design. Key components shaping this market include output capacity, thermal design considerations, and power conversion efficiency. Output capacity plays a crucial role, as power supplies must cater to the increasing demands of various industries. In this regard, thermal design considerations are essential, as efficient heat dissipation is necessary to ensure reliable operation. Pulse width modulation (PWM), power factor correction, and switching frequency control are integral techniques employed to optimize power supply design. These methods contribute to improved dc-ac waveform quality and efficiency, while reducing harmonic distortion and output impedance mismatches.
- Over voltage protection, current limiting techniques, and voltage regulation circuits are essential for safeguarding power supplies against potential damage. Power semiconductor devices, feedback control loops, and electromagnetic compatibility are also vital aspects of power supply design. Input voltage range and efficiency optimization methods are critical factors in the selection of electronic components. Thermal management systems, protection circuitry, and capacitor selection criteria are essential considerations for enhancing reliability and overall performance. In the realm of AC-DC power conversion, load transient response and power dissipation analysis are essential for understanding and addressing the challenges of power supply design.
- Short circuit protection and filter design specifications are crucial elements in ensuring the safety and efficiency of power supplies. The market's evolution is driven by ongoing research and development in power semiconductor devices, magnetic component design, and control circuitry design. As the industry continues to advance, the focus on efficiency, reliability, and thermal management will remain paramount.
What are the Key Data Covered in this ACDC Power Supply Market Research and Growth Report?
-
What is the expected growth of the ACDC Power Supply Market between 2025 and 2029?
-
USD 12.64 billion, at a CAGR of 6.4%
-
-
What segmentation does the market report cover?
-
The report segmented by Application (Consumer electronics, Wireless communication and infrastructure, Automotive, Energy, and Other), Type (AC-DC and DC-DC), Power Output (25W-100W, 5W-12W, 13W-24W, and Above 100W), and Geography (APAC, North America, Europe, Middle East and Africa, and South America)
-
-
Which regions are analyzed in the report?
-
APAC, North America, Europe, Middle East and Africa, and South America
-
-
What are the key growth drivers and market challenges?
-
Increasing demand for consumer electronics, Stringent regulations and standards on production and sale of power supplies
-
-
Who are the major players in the ACDC Power Supply Market?
-
Key Companies Advanced Energy Industries Inc., Advantech Co. Ltd., AMETEK Inc., Delta Electronics Inc., GlobTek Inc., Good Will Instrument Co. Ltd., Huawei Technologies Co. Ltd., Itech Electronic Co. Ltd., Keysight Technologies Inc., Kikusui Electronics Corp., MEAN WELL Enterprises Co. Ltd., Murata Manufacturing Co. Ltd., Phihong USA Corp., Power Integrations Inc., Rohde and Schwarz GmbH and Co. KG, Schneider Electric SE, Sea Sonic, Siemens AG, TDK Corp., and Tektronix Inc.
-
Market Research Insights
- The market encompasses a diverse range of products, including low power supplies and high power supplies, single output and multiple output supplies, linear and switching power supplies, and non-isolated and isolated power supplies. Two key trends shaping this market are the increasing emphasis on energy efficiency and safety standards compliance. For instance, energy efficiency standards have led to the widespread adoption of power factor correction and power density optimization in power supplies. In contrast, safety standards compliance requires stringent testing, such as power supply certification and transient suppression, as well as careful heat sink selection. For instance, high power supplies may require larger heat sinks to dissipate heat effectively.
- Additionally, circuit simulation tools and power semiconductor modules are crucial for designing efficient and reliable power supplies. Overall, the market is a dynamic and evolving landscape, with continuous advancements in technology driving innovation and growth. For example, modular power supplies and inverter circuits offer increased flexibility and scalability, while integrating power supplies and rectifier circuits enhance system efficiency.
We can help! Our analysts can customize this ACDC power supply market research report to meet your requirements.
 RIA -
RIA - 
