Adtech Market Analysis, Size, and Forecast 2025-2029: North America (US and Canada), Europe (France, Germany, and UK), Middle East and Africa (UAE), APAC (China, India, and Japan), South America (Brazil), and Rest of World (ROW)

Adtech Market Analysis, Size, and Forecast 2025-2029:
North America (US and Canada), Europe (France, Germany, and UK), Middle East and Africa (UAE), APAC (China, India, and Japan), South America (Brazil), and Rest of World (ROW)

Published: Dec 2024 196 Pages SKU: IRTNTR75603

Market Overview at a Glance

$1080.1 B
Market Opportunity
14.6%
CAGR
12.9
YoY growth 2024-2025(%)

Adtech Market Size 2025-2029

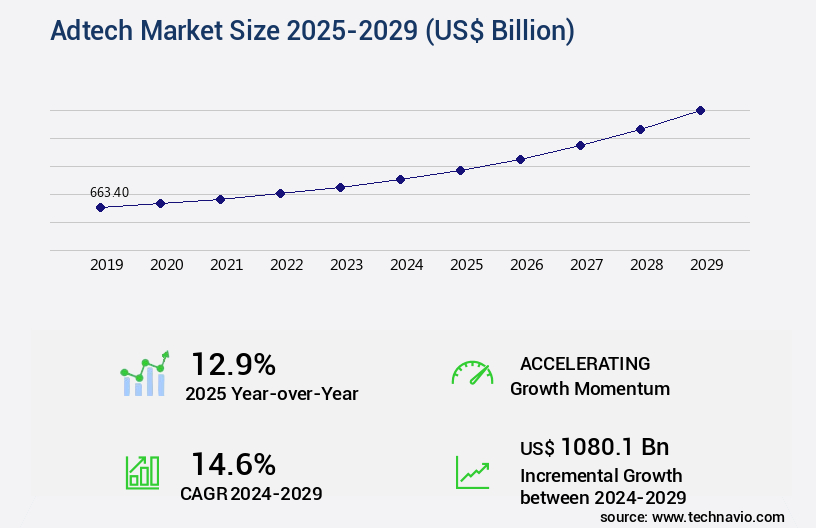
The adtech market size is valued to increase USD 1080.1 billion, at a CAGR of 14.6% from 2024 to 2029. Increasing Internet and smartphone penetration will drive the adtech market.

Major Market Trends & Insights

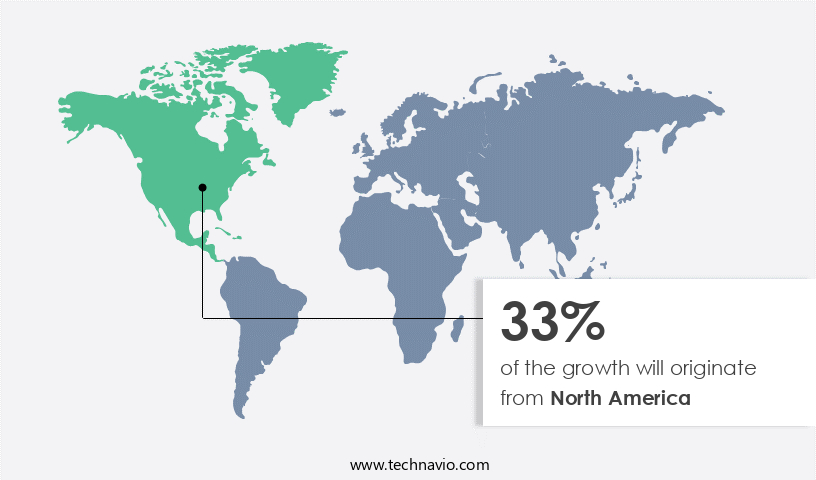
  • North America dominated the market and accounted for a 33% growth during the forecast period.
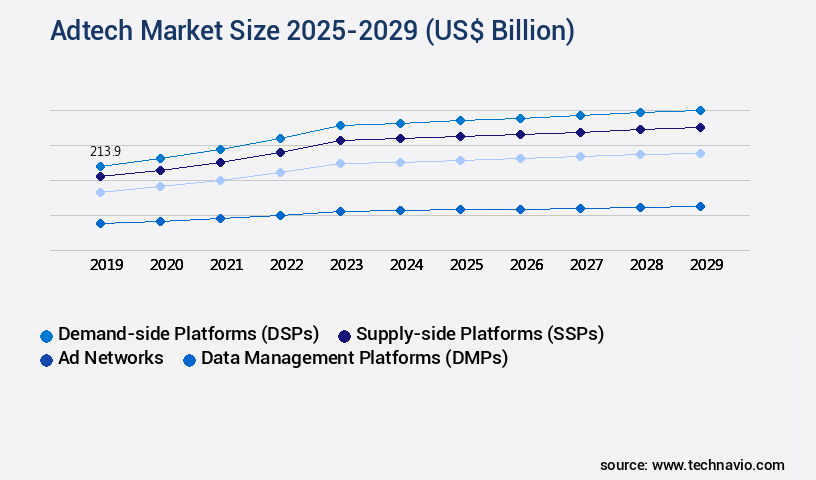
  • By Solution - Demand-side platforms (DSPs) segment was valued at USD 213.90 billion in 2023
  • By Platform - Mobile Ad segment accounted for the largest market revenue share in 2023

Market Size & Forecast

  • Market Opportunities: USD 229.45 billion
  • Market Future Opportunities: USD 1080.10 billion
  • CAGR : 14.6%
  • North America: Largest market in 2023

Market Summary

  • The market represents a dynamic and continually evolving landscape, driven by the integration of advanced technologies and shifting consumer behaviors. Core technologies, such as AI and machine learning (ML), are increasingly shaping the industry, enabling targeted advertising, personalized content delivery, and advanced analytics. Meanwhile, applications of these technologies span various sectors, including digital advertising, programmatic advertising, and mobile advertising. Despite these opportunities, the market faces challenges, including the growing adoption of ad-blocker solutions and heightened regulatory scrutiny. 
  • In this context, the market is poised for ongoing transformation, with increasing Internet and smartphone penetration fueling demand for more sophisticated and personalized advertising solutions. As of 2021, approximately 67% of the global population uses the Internet, and this number is projected to reach 75% by 2025. The market's evolution underscores the importance of staying informed about the latest trends, regulations, and technologies shaping the Adtech landscape.

What will be the Size of the Adtech Market during the forecast period?

Adtech Market Size

Get Key Insights on Market Forecast (PDF) Request Free Sample

How is the Adtech Market Segmented and what are the key trends of market segmentation?

The adtech industry research report provides comprehensive data (region-wise segment analysis), with forecasts and estimates in "USD billion" for the period 2025-2029, as well as historical data from 2019-2023 for the following segments.

  • Solution
    • Demand-side platforms (DSPs)
    • Supply-side platforms (SSPs)
    • Ad networks
    • Data management platforms (DMPs)
    • Others
  • Platform
    • Mobile Ad
    • Desktop Ad
    • Digital TV
  • End-User
    • Retail & E-Commerce
    • BFSI
    • Media & Entertainment
    • Healthcare
    • Others
  • Deployment Type
    • Cloud-Based
    • On-Premises
  • Geography
    • North America
      • US
      • Canada
    • Europe
      • France
      • Germany
      • UK
    • Middle East and Africa
      • UAE
    • APAC
      • China
      • India
      • Japan
    • South America
      • Brazil
    • Rest of World (ROW)

By Solution Insights

The demand-side platforms (DSPs) segment is estimated to witness significant growth during the forecast period.

The market trends encompass various aspects, including brand safety, display advertising, contextual targeting, programmatic advertising, attribution modeling, predictive modeling, native advertising, search engine marketing, conversion tracking, campaign management, A/B testing, ad fraud detection, mobile advertising, social media advertising, supply-side platforms, ad networks, data analytics, cost per click, video advertising, real-time bidding, demand-side platforms, click-through rates, ad exchange platforms, ad servers, creative optimization, data management platforms, behavioral targeting, impression metrics, ad verification, and audience targeting. Programmatic advertising platforms, such as Demand-Side Platforms (DSPs), are transforming the industry by enabling advertisers to automate their ad buying process. DSPs facilitate mobile advertising, allowing marketers to purchase high-quality traffic at scale with minimal effort.

This automation saves time and resources, enabling user acquisition professionals to focus on optimizing user segments for improved long-term performance. The adoption of programmatic advertising has seen significant growth, with 78% of US digital display ad spending transacted programmatically in 2020. Furthermore, the programmatic video advertising market is projected to reach USD 50.18 billion by 2023, growing at a steady pace. The integration of data analytics, real-time bidding, and automation in ad buying processes is driving this growth. Additionally, the mobile advertising sector is experiencing rapid expansion, with mobile ad spending surpassing desktop ad spending for the first time in 2016.

Adtech Market Size

Request Free Sample

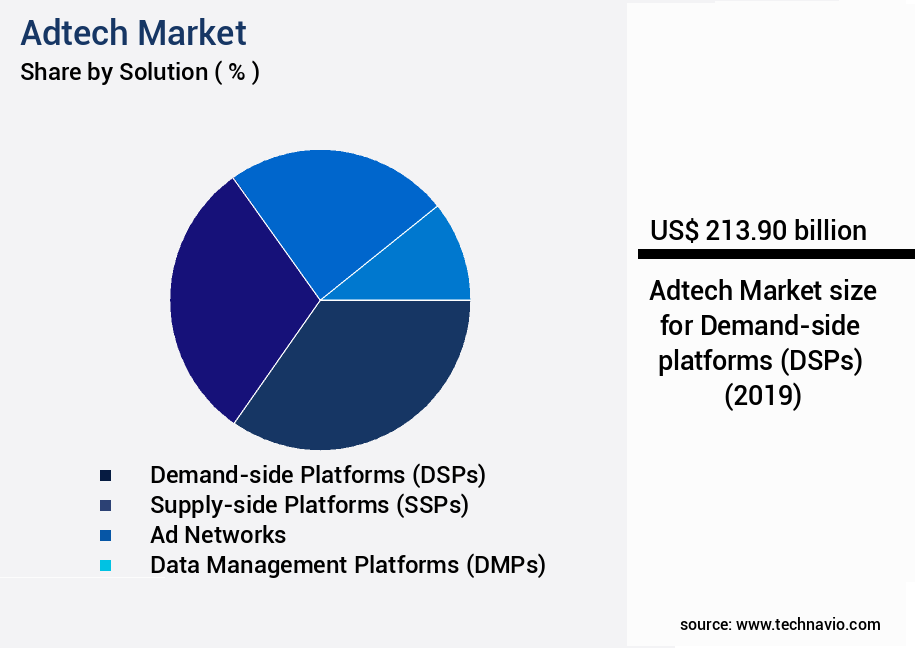
The Demand-side platforms (DSPs) segment was valued at USD 213.90 billion in 2019 and showed a gradual increase during the forecast period.

By 2021, mobile advertising is expected to account for 72% of all digital ad spending. Social media advertising is another key segment, with 90% of marketers using social media for advertising, and 71% of consumers more likely to make a purchase based on social media referrals. As businesses continue to leverage technology to reach their target audiences more effectively, the market will continue to evolve, offering new opportunities for growth and innovation.

Adtech Market Size

Request Free Sample

Regional Analysis

North America is estimated to contribute 33% to the growth of the global market during the forecast period. Technavio's analysts have elaborately explained the regional trends and drivers that shape the market during the forecast period.

Adtech Market Share by Geography

See How Adtech Market Demand is Rising in North America Request Free Sample

The market in North America is experiencing significant growth due to the widespread use of smartphones and robust broadband infrastructure. Mobile ad spending is a major driver, as consumers increasingly engage with digital content on mobile devices. According to recent statistics, mobile ad spending in the region reached USD 50.47 billion in 2020, representing a 22.2% share of total digital ad spending. Furthermore, manufacturers are expected to increase their investments in internet advertising, as digital/online advertising proves to be more economical compared to traditional options.

In 2021, digital ad spending in North America is projected to reach USD 129.34 billion, with mobile accounting for approximately USD 72.22 billion. These trends reflect the continuous evolution of the market and its increasing importance for businesses in the region.

Market Dynamics

Our researchers analyzed the data with 2024 as the base year, along with the key drivers, trends, and challenges. A holistic analysis of drivers will help companies refine their marketing strategies to gain a competitive advantage.

The market is a dynamic and intricate ecosystem that facilitates real-time bidding strategies for mobile advertising and effective programmatic direct campaign management. This marketplace is characterized by the implementation of header bidding for increased yield, addressing data privacy regulations and ad tech compliance. Cross-device tracking solutions are a crucial aspect, enabling enhanced targeting and improving return on investment through attribution modeling techniques. Advanced analytics for programmatic advertising optimization and openRTB protocol implementation bring benefits, such as automated bidding strategies for performance marketing. Ad fraud detection and prevention techniques are essential to maintain trust and transparency, while creative optimization strategies contribute to improved click-through rates.

Audience segmentation and targeting are key to effective campaigns, and advanced campaign reporting and analysis tools provide valuable insights. Supply-side platform integration for publishers and demand-side platform selection criteria are critical considerations. Data management platform implementation brings numerous benefits, including streamlined ad server management and optimization. Viewability metrics and improvement strategies are essential for maximizing ad impact, with brand safety guidelines and implementation ensuring a positive user experience. Performance-based advertising strategies are on the rise, with more than 60% of marketers adopting this approach compared to traditional cost-per-click models. This shift underscores the importance of adtech in delivering targeted, measurable, and effective advertising solutions.

Adtech Market Size

What are the key market drivers leading to the rise in the adoption of Adtech Industry?

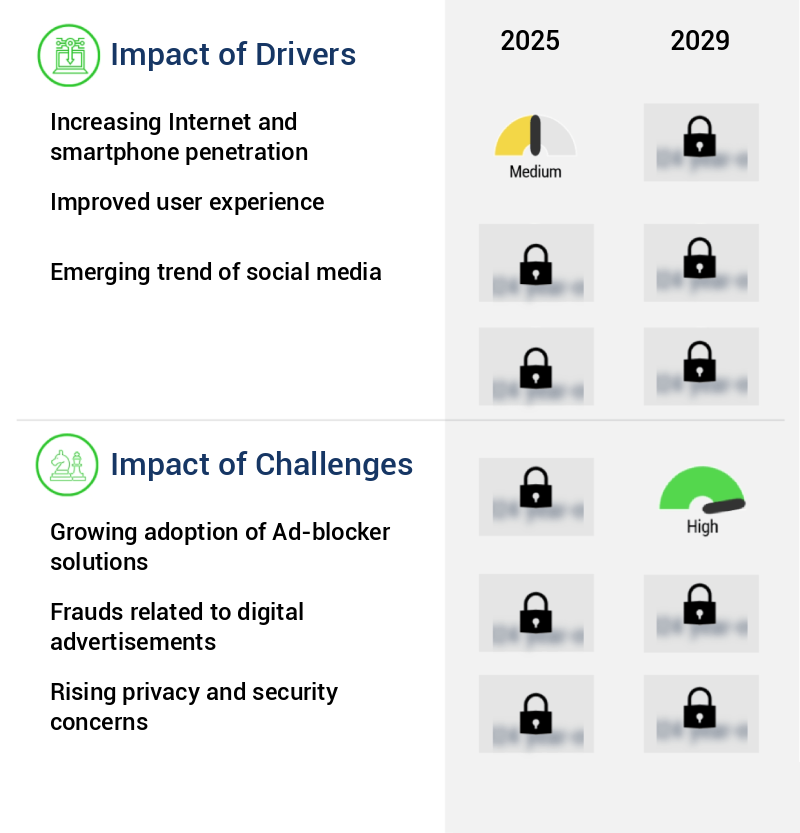
  • The significant expansion of Internet and smartphone usage is the primary catalyst fueling market growth. 
  • The market has experienced significant expansion as Internet and smartphone penetration increases globally. With more people gaining access to these technologies, adtech platforms have become increasingly convenient for both buyers and sellers. This trend is driven by the growing number of individuals using smartphones to browse and post ads. In response, adtech platform providers have invested heavily in mobile applications to cater to this demographic. The continuous advancement of technology further fuels this growth, as users seek more targeted and personalized advertising experiences.
  • This dynamic market is characterized by ongoing innovation and evolving patterns, making it a highly competitive and rapidly changing landscape. Adtech platforms have become essential tools for businesses looking to reach and engage with their audiences effectively. The market is expected to continue growing as technology progresses and Internet and smartphone penetration increases further.

What are the market trends shaping the Adtech Industry?

  • The integration of artificial intelligence (AI) and machine learning (ML) is an emerging market trend. 
  • The integration of artificial intelligence (AI) and machine learning in adtech platforms is a significant trend, enhancing search results, suggesting relevant listings, and automating various functions. AI algorithms analyze user behavior, preferences, and search history to offer personalized ad and product recommendations. Machine learning optimizes ad targeting and pricing based on user engagement and conversion rates. This technology-driven approach boosts user experience, competitiveness, and attracts more users and advertisers, fueling the expansion of the market. AI's role in adtech is continuously evolving, with applications extending to fraud detection, ad placement, and content generation.
  • This technological shift is transforming the industry, making adtech platforms more efficient and responsive to user needs. Adoption rates vary across sectors, with digital media, e-commerce, and marketing leading the way. This data-driven narrative underscores the importance of AI in adtech and its potential impact on the business landscape.

What challenges does the Adtech Industry face during its growth?

  • The increasing utilization of ad-blocking technologies poses a significant challenge to the expansion of the industry, as more users opt to restrict or eliminate advertisements from their online experiences. 
  • The market faces a significant challenge with the escalating usage of ad-blocking technologies. According to recent studies, the number of ad-blocker users worldwide is projected to reach 750 million by 2025, representing a substantial increase from the current figure. This trend poses a significant threat to the adtech industry, as it impedes advertisers' ability to reach their target audiences and negatively impacts publishers' revenue streams. Ad-blockers' popularity stems from users' growing discontent with intrusive and irrelevant ads.
  • In response, the adtech sector must adapt by improving ad delivery, targeting, and user experience to mitigate the impact of ad-blocking. The market's continuous evolution underscores the importance of staying informed about emerging trends and user preferences. By focusing on enhancing the value proposition for both advertisers and users, the adtech industry can navigate the challenges posed by ad-blockers and thrive in the digital landscape.

Exclusive Customer Landscape

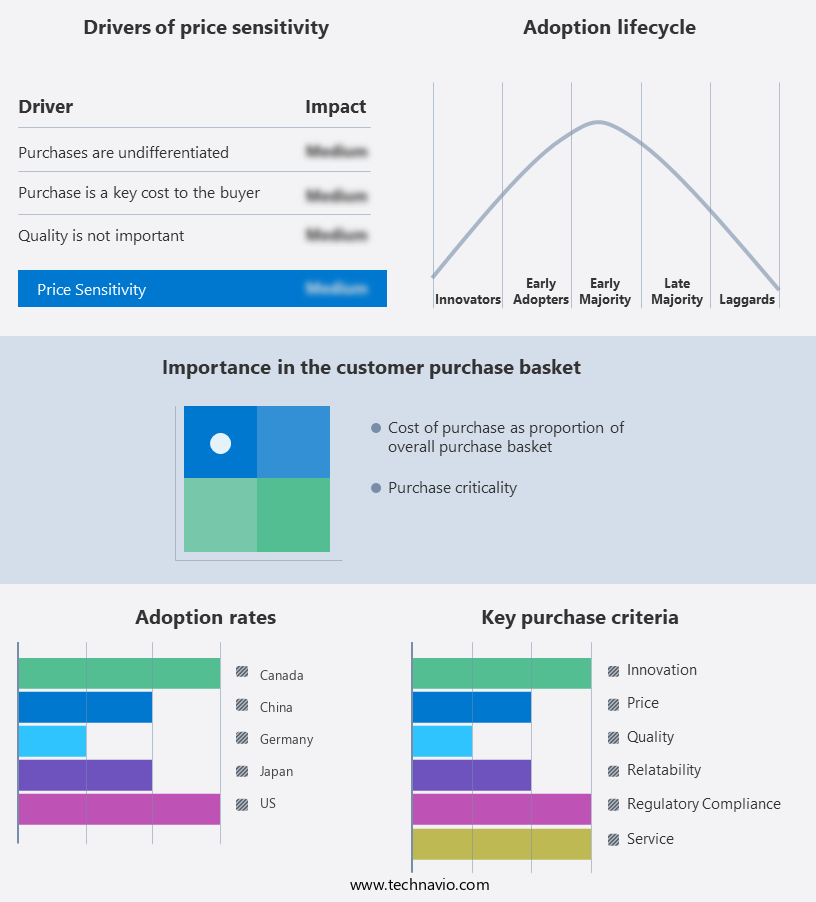
The adtech market forecasting report includes the adoption lifecycle of the market, covering from the innovator's stage to the laggard's stage. It focuses on adoption rates in different regions based on penetration. Furthermore, the adtech market report also includes key purchase criteria and drivers of price sensitivity to help companies evaluate and develop their market growth analysis strategies.

Adtech Market Share by Geography

 Customer Landscape of Adtech Industry

Competitive Landscape & Market Insights

Companies are implementing various strategies, such as strategic alliances, adtech market forecast, partnerships, mergers and acquisitions, geographical expansion, and product/service launches, to enhance their presence in the industry.

33Across Inc. - The Adobe Experience Cloud delivers advanced advertising technology, featuring an online platform for brands to optimize and personalize digital marketing campaigns. 

The industry research and growth report includes detailed analyses of the competitive landscape of the market and information about key companies, including:

  • 33Across Inc.
  • AcuityAds Holdings Inc.
  • Adobe Inc.
  • AdTheorent Holding Co. Inc.
  • Adverty AB
  • Alphabet Inc.
  • Comcast Corp.
  • Criteo SA
  • Digital Turbine Inc.
  • DoubleVerify Holdings Inc.
  • GUMGUM Inc.
  • InMobi Pte. Ltd.
  • Innovid Corp.
  • Integral Ad Science Holding Corp.
  • Magnite Inc.
  • MOLOCO Inc.
  • Ogury Ltd.
  • Permutive Inc.
  • StackAdapt Inc.
  • VideoAmp

Qualitative and quantitative analysis of companies has been conducted to help clients understand the wider business environment as well as the strengths and weaknesses of key industry players. Data is qualitatively analyzed to categorize companies as pure play, category-focused, industry-focused, and diversified; it is quantitatively analyzed to categorize companies as dominant, leading, strong, tentative, and weak.

Recent Development and News in Adtech Market

  • In January 2024, Google announced the launch of its Privacy Sandbox initiative, aiming to phase out third-party cookies in favor of privacy-preserving alternatives, significantly impacting the market's data collection and targeting methods (Google, 2024).
  • In March 2024, The Trade Desk, a leading independent demand-side platform, entered into a strategic partnership with Amazon Advertising, enabling advertisers to buy Amazon inventory programmatically, expanding The Trade Desk's reach and enhancing Amazon's ad offerings (The Trade Desk, 2024).
  • In May 2024, AppNexus, a global technology company focused on digital advertising, was acquired by AT&T for USD 1.6 billion, marking a significant move by the telecommunications giant to strengthen its digital advertising capabilities (AT&T, 2024).
  • In February 2025, the European Union's Digital Services Act came into effect, imposing stricter regulations on online advertising, including increased transparency requirements and stronger enforcement mechanisms (European Commission, 2025).

Dive into Technavio's robust research methodology, blending expert interviews, extensive data synthesis, and validated models for unparalleled Adtech Market insights. See full methodology.

Market Scope

Report Coverage

Details

Page number

196

Base year

2024

Historic period

2019-2023

Forecast period

2025-2029

Growth momentum & CAGR

Accelerate at a CAGR of 14.6%

Market growth 2025-2029

USD 1080.1 billion

Market structure

Fragmented

YoY growth 2024-2025(%)

12.9

Key countries

US, China, Canada, Japan, Germany, UK, UAE, India, France, and Brazil

Competitive landscape

Leading Companies, Market Positioning of Companies, Competitive Strategies, and Industry Risks

Request Free Sample

Research Analyst Overview

  • In the ever-evolving landscape of digital marketing, the market continues to shape the way brands connect with consumers. This dynamic space encompasses various solutions, including display advertising, contextual targeting, programmatic advertising, and more. Display advertising, a traditional method, has given way to more targeted approaches. Contextual targeting, for instance, allows ads to appear based on the content of a webpage, enhancing relevance and user experience. Programmatic advertising, meanwhile, uses automated systems to buy ad inventory in real-time, streamlining the buying process and optimizing ad placements. Attribution modeling and predictive modeling are essential components of adtech, helping marketers understand the customer journey and forecast future trends.
  • Native advertising, search engine marketing, and conversion tracking are other key elements, ensuring effective campaign management and measurement. A/B testing, ad fraud detection, and mobile advertising are critical areas of innovation. Real-time bidding, demand-side platforms, and supply-side platforms further optimize ad buying and selling, while ad exchanges and ad servers streamline the delivery process. Creative optimization and data management platforms enable more effective ad creation and data analysis, respectively. Behavioral targeting, impression metrics, and ad verification are crucial for delivering personalized and high-quality ads. Cost per click, video advertising, and click-through rates are essential performance metrics, providing valuable insights into campaign success.
  • The market is characterized by continuous growth and evolution, with emerging trends like social media advertising and data analytics shaping the future of digital marketing. By leveraging these advanced technologies, brands can reach their audiences more effectively and efficiently, driving business growth and success.

What are the Key Data Covered in this Adtech Market Research and Growth Report?

  • What is the expected growth of the Adtech Market between 2025 and 2029?

    • USD 1080.1 billion, at a CAGR of 14.6%

  • What segmentation does the market report cover?

    • The report segmented by Solution (Demand-side platforms (DSPs), Supply-side platforms (SSPs), Ad networks, Data management platforms (DMPs), and Others), Platform (Mobile Ad, Desktop Ad, and Digital TV), Geography (North America, APAC, Europe, South America, and Middle East and Africa), End-User (Retail & E-Commerce, BFSI, Media & Entertainment, Healthcare, and Others), and Deployment Type (Cloud-Based and On-Premises)

  • Which regions are analyzed in the report?

    • North America, APAC, Europe, South America, and Middle East and Africa

  • What are the key growth drivers and market challenges?

    • Increasing Internet and smartphone penetration, Growing adoption of Ad-blocker solutions

  • Who are the major players in the Adtech Market?

    • Key Companies 33Across Inc., AcuityAds Holdings Inc., Adobe Inc., AdTheorent Holding Co. Inc., Adverty AB, Alphabet Inc., Comcast Corp., Criteo SA, Digital Turbine Inc., DoubleVerify Holdings Inc., GUMGUM Inc., InMobi Pte. Ltd., Innovid Corp., Integral Ad Science Holding Corp., Magnite Inc., MOLOCO Inc., Ogury Ltd., Permutive Inc., StackAdapt Inc., and VideoAmp

Market Research Insights

  • The market is a dynamic and intricate ecosystem that facilitates media buying, inventory management, and campaign optimization through various technologies. Two key components of this market are OpenRTB protocol and programmatic direct. OpenRTB, an industry standard for real-time bidding, enables transparency and automation in media buying, while programmatic direct offers a more direct and private marketplace for media sellers and buyers. In 2020, programmatic ad spending accounted for approximately 68% of all digital display ad spending, representing a significant growth from 62% in 2019. This trend highlights the increasing adoption of automated media buying and the importance of ad tech solutions such as DSP integration, frequency capping, and performance reporting.
  • Moreover, advanced features like personalization engines, creative development, and audience segmentation are becoming essential for effective campaign optimization. Real-time analytics and algorithmic optimization enable media planners to make data-driven decisions and improve ad quality. Inventory management, SSP partnerships, header bidding, and consent management are also crucial components of the ad tech stack, ensuring efficient yield optimization and ad delivery across multiple devices. Ad tech solutions also prioritize transparency standards, cross-device tracking, and frequency capping to maintain user experience and prevent ad fatigue. Furthermore, measurement tools and automated bidding help ensure accurate performance reporting and fraud prevention.
  • With continuous advancements in technology and evolving consumer expectations, the market will remain a vital and ever-changing sector in the digital advertising landscape.

We can help! Our analysts can customize this adtech market research report to meet your requirements.

Get in touch

1 Executive Summary

  • 1.1 Market overview
    • Executive Summary - Chart on Market Overview
    • Executive Summary - Data Table on Market Overview
    • Executive Summary - Chart on Global Market Characteristics
    • Executive Summary - Chart on Market by Geography
    • Executive Summary - Chart on Market Segmentation by Solution
    • Executive Summary - Chart on Market Segmentation by Platform
    • Executive Summary - Chart on Incremental Growth
    • Executive Summary - Data Table on Incremental Growth
    • Executive Summary - Chart on Company Market Positioning

2 Technavio Analysis

  • 2.1 Analysis of price sensitivity, lifecycle, customer purchase basket, adoption rates, and purchase criteria
    • Analysis of price sensitivity, lifecycle, customer purchase basket, adoption rates, and purchase criteria
  • 2.2 Criticality of inputs and Factors of differentiation
    • Overview on criticality of inputs and factors of differentiation
  • 2.3 Factors of disruption
    • Overview on factors of disruption
  • 2.4 Impact of drivers and challenges
    • Impact of drivers and challenges in 2024 and 2029

3 Market Landscape

  • 3.1 Market ecosystem
    • Parent Market
    • Data Table on - Parent Market
  • 3.2 Market characteristics
    • Market characteristics analysis
  • 3.3 Value chain analysis
    • Value chain analysis

4 Market Sizing

  • 4.1 Market definition
    • Offerings of companies included in the market definition
  • 4.2 Market segment analysis
    • Market segments
  • 4.3 Market size 2024
    • 4.4 Market outlook: Forecast for 2024-2029
      • Chart on Global - Market size and forecast 2024-2029 ($ billion)
      • Data Table on Global - Market size and forecast 2024-2029 ($ billion)
      • Chart on Global Market: Year-over-year growth 2024-2029 (%)
      • Data Table on Global Market: Year-over-year growth 2024-2029 (%)

    5 Historic Market Size

    • 5.1 Global Adtech Market 2019 - 2023
      • Historic Market Size - Data Table on Global Adtech Market 2019 - 2023 ($ billion)
    • 5.2 Solution segment analysis 2019 - 2023
      • Historic Market Size - Solution Segment 2019 - 2023 ($ billion)
    • 5.3 Platform segment analysis 2019 - 2023
      • Historic Market Size - Platform Segment 2019 - 2023 ($ billion)
    • 5.4 Geography segment analysis 2019 - 2023
      • Historic Market Size - Geography Segment 2019 - 2023 ($ billion)
    • 5.5 Country segment analysis 2019 - 2023
      • Historic Market Size - Country Segment 2019 - 2023 ($ billion)

    6 Qualitative Analysis

    • 6.1 The AI impact on Global Adtech Market

      7 Five Forces Analysis

      • 7.1 Five forces summary
        • Five forces analysis - Comparison between 2024 and 2029
      • 7.2 Bargaining power of buyers
        • Bargaining power of buyers - Impact of key factors 2024 and 2029
      • 7.3 Bargaining power of suppliers
        • Bargaining power of suppliers - Impact of key factors in 2024 and 2029
      • 7.4 Threat of new entrants
        • Threat of new entrants - Impact of key factors in 2024 and 2029
      • 7.5 Threat of substitutes
        • Threat of substitutes - Impact of key factors in 2024 and 2029
      • 7.6 Threat of rivalry
        • Threat of rivalry - Impact of key factors in 2024 and 2029
      • 7.7 Market condition
        • Chart on Market condition - Five forces 2024 and 2029

      8 Market Segmentation by Solution

      • 8.1 Market segments
        • Chart on Solution - Market share (2024-2029) (%)
        • Data Table on Solution - Market share (2024-2029) (%)
      • 8.2 Comparison by Solution
        • Chart on Comparison by Solution
        • Data Table on Comparison by Solution
      • 8.3 Demand-side platforms (DSPs) - Market size and forecast (2024-2029)
        • Chart on Demand-side platforms (DSPs) - Market size and forecast (2024-2029) ($ billion)
        • Data Table on Demand-side platforms (DSPs) - Market size and forecast (2024-2029) ($ billion)
        • Chart on Demand-side platforms (DSPs) - Year-over-year growth (2024-2029) (%)
        • Data Table on Demand-side platforms (DSPs) - Year-over-year growth (2024-2029) (%)
      • 8.4 Supply-side platforms (SSPs) - Market size and forecast (2024-2029)
        • Chart on Supply-side platforms (SSPs) - Market size and forecast (2024-2029) ($ billion)
        • Data Table on Supply-side platforms (SSPs) - Market size and forecast (2024-2029) ($ billion)
        • Chart on Supply-side platforms (SSPs) - Year-over-year growth (2024-2029) (%)
        • Data Table on Supply-side platforms (SSPs) - Year-over-year growth (2024-2029) (%)
      • 8.5 Ad networks - Market size and forecast (2024-2029)
        • Chart on Ad networks - Market size and forecast (2024-2029) ($ billion)
        • Data Table on Ad networks - Market size and forecast (2024-2029) ($ billion)
        • Chart on Ad networks - Year-over-year growth (2024-2029) (%)
        • Data Table on Ad networks - Year-over-year growth (2024-2029) (%)
      • 8.6 Data management platforms (DMPs) - Market size and forecast (2024-2029)
        • Chart on Data management platforms (DMPs) - Market size and forecast (2024-2029) ($ billion)
        • Data Table on Data management platforms (DMPs) - Market size and forecast (2024-2029) ($ billion)
        • Chart on Data management platforms (DMPs) - Year-over-year growth (2024-2029) (%)
        • Data Table on Data management platforms (DMPs) - Year-over-year growth (2024-2029) (%)
      • 8.7 Others - Market size and forecast (2024-2029)
        • Chart on Others - Market size and forecast (2024-2029) ($ billion)
        • Data Table on Others - Market size and forecast (2024-2029) ($ billion)
        • Chart on Others - Year-over-year growth (2024-2029) (%)
        • Data Table on Others - Year-over-year growth (2024-2029) (%)
      • 8.8 Market opportunity by Solution
        • Market opportunity by Solution ($ billion)
        • Data Table on Market opportunity by Solution ($ billion)

      9 Market Segmentation by Platform

      • 9.1 Market segments
        • Chart on Platform - Market share (2024-2029) (%)
        • Data Table on Platform - Market share (2024-2029) (%)
      • 9.2 Comparison by Platform
        • Chart on Comparison by Platform
        • Data Table on Comparison by Platform
      • 9.3 Mobile Ad - Market size and forecast (2024-2029)
        • Chart on Mobile Ad - Market size and forecast (2024-2029) ($ billion)
        • Data Table on Mobile Ad - Market size and forecast (2024-2029) ($ billion)
        • Chart on Mobile Ad - Year-over-year growth (2024-2029) (%)
        • Data Table on Mobile Ad - Year-over-year growth (2024-2029) (%)
      • 9.4 Desktop Ad - Market size and forecast (2024-2029)
        • Chart on Desktop Ad - Market size and forecast (2024-2029) ($ billion)
        • Data Table on Desktop Ad - Market size and forecast (2024-2029) ($ billion)
        • Chart on Desktop Ad - Year-over-year growth (2024-2029) (%)
        • Data Table on Desktop Ad - Year-over-year growth (2024-2029) (%)
      • 9.5 Digital TV - Market size and forecast (2024-2029)
        • Chart on Digital TV - Market size and forecast (2024-2029) ($ billion)
        • Data Table on Digital TV - Market size and forecast (2024-2029) ($ billion)
        • Chart on Digital TV - Year-over-year growth (2024-2029) (%)
        • Data Table on Digital TV - Year-over-year growth (2024-2029) (%)
      • 9.6 Market opportunity by Platform
        • Market opportunity by Platform ($ billion)
        • Data Table on Market opportunity by Platform ($ billion)

      10 Market Segmentation by End-User

      • 10.1 Market segments
        • Chart on End-User - Market share (2024-2029) (%)
        • Data Table on End-User - Market share (2024-2029) (%)
      • 10.2 Comparison by End-User
        • Chart on Comparison by End-User
        • Data Table on Comparison by End-User
      • 10.3 Retail & E-Commerce - Market size and forecast (2024-2029)
        • Chart on Retail & E-Commerce - Market size and forecast (2024-2029) ($ billion)
        • Data Table on Retail & E-Commerce - Market size and forecast (2024-2029) ($ billion)
        • Chart on Retail & E-Commerce - Year-over-year growth (2024-2029) (%)
        • Data Table on Retail & E-Commerce - Year-over-year growth (2024-2029) (%)
      • 10.4 BFSI - Market size and forecast (2024-2029)
        • Chart on BFSI - Market size and forecast (2024-2029) ($ billion)
        • Data Table on BFSI - Market size and forecast (2024-2029) ($ billion)
        • Chart on BFSI - Year-over-year growth (2024-2029) (%)
        • Data Table on BFSI - Year-over-year growth (2024-2029) (%)
      • 10.5 Media & Entertainment - Market size and forecast (2024-2029)
        • Chart on Media & Entertainment - Market size and forecast (2024-2029) ($ billion)
        • Data Table on Media & Entertainment - Market size and forecast (2024-2029) ($ billion)
        • Chart on Media & Entertainment - Year-over-year growth (2024-2029) (%)
        • Data Table on Media & Entertainment - Year-over-year growth (2024-2029) (%)
      • 10.6 Healthcare - Market size and forecast (2024-2029)
        • Chart on Healthcare - Market size and forecast (2024-2029) ($ billion)
        • Data Table on Healthcare - Market size and forecast (2024-2029) ($ billion)
        • Chart on Healthcare - Year-over-year growth (2024-2029) (%)
        • Data Table on Healthcare - Year-over-year growth (2024-2029) (%)
      • 10.7 Others - Market size and forecast (2024-2029)
        • Chart on Others - Market size and forecast (2024-2029) ($ billion)
        • Data Table on Others - Market size and forecast (2024-2029) ($ billion)
        • Chart on Others - Year-over-year growth (2024-2029) (%)
        • Data Table on Others - Year-over-year growth (2024-2029) (%)
      • 10.8 Market opportunity by End-User
        • Market opportunity by End-User ($ billion)
        • Data Table on Market opportunity by End-User ($ billion)

      11 Market Segmentation by Deployment Type

      • 11.1 Market segments
        • Chart on Deployment Type - Market share (2024-2029) (%)
        • Data Table on Deployment Type - Market share (2024-2029) (%)
      • 11.2 Comparison by Deployment Type
        • Chart on Comparison by Deployment Type
        • Data Table on Comparison by Deployment Type
      • 11.3 Cloud-Based - Market size and forecast (2024-2029)
        • Chart on Cloud-Based - Market size and forecast (2024-2029) ($ billion)
        • Data Table on Cloud-Based - Market size and forecast (2024-2029) ($ billion)
        • Chart on Cloud-Based - Year-over-year growth (2024-2029) (%)
        • Data Table on Cloud-Based - Year-over-year growth (2024-2029) (%)
      • 11.4 On-Premises - Market size and forecast (2024-2029)
        • Chart on On-Premises - Market size and forecast (2024-2029) ($ billion)
        • Data Table on On-Premises - Market size and forecast (2024-2029) ($ billion)
        • Chart on On-Premises - Year-over-year growth (2024-2029) (%)
        • Data Table on On-Premises - Year-over-year growth (2024-2029) (%)
      • 11.5 Market opportunity by Deployment Type
        • Market opportunity by Deployment Type ($ billion)
        • Data Table on Market opportunity by Deployment Type ($ billion)

      12 Customer Landscape

      • 12.1 Customer landscape overview
        • Analysis of price sensitivity, lifecycle, customer purchase basket, adoption rates, and purchase criteria

      13 Geographic Landscape

      • 13.1 Geographic segmentation
        • Chart on Market share by geography 2024-2029 (%)
        • Data Table on Market share by geography 2024-2029 (%)
      • 13.2 Geographic comparison
        • Chart on Geographic comparison
        • Data Table on Geographic comparison
      • 13.3 North America - Market size and forecast 2024-2029
        • Chart on North America - Market size and forecast 2024-2029 ($ billion)
        • Data Table on North America - Market size and forecast 2024-2029 ($ billion)
        • Chart on North America - Year-over-year growth 2024-2029 (%)
        • Data Table on North America - Year-over-year growth 2024-2029 (%)
      • 13.4 APAC - Market size and forecast 2024-2029
        • Chart on APAC - Market size and forecast 2024-2029 ($ billion)
        • Data Table on APAC - Market size and forecast 2024-2029 ($ billion)
        • Chart on APAC - Year-over-year growth 2024-2029 (%)
        • Data Table on APAC - Year-over-year growth 2024-2029 (%)
      • 13.5 Europe - Market size and forecast 2024-2029
        • Chart on Europe - Market size and forecast 2024-2029 ($ billion)
        • Data Table on Europe - Market size and forecast 2024-2029 ($ billion)
        • Chart on Europe - Year-over-year growth 2024-2029 (%)
        • Data Table on Europe - Year-over-year growth 2024-2029 (%)
      • 13.6 South America - Market size and forecast 2024-2029
        • Chart on South America - Market size and forecast 2024-2029 ($ billion)
        • Data Table on South America - Market size and forecast 2024-2029 ($ billion)
        • Chart on South America - Year-over-year growth 2024-2029 (%)
        • Data Table on South America - Year-over-year growth 2024-2029 (%)
      • 13.7 Middle East and Africa - Market size and forecast 2024-2029
        • Chart on Middle East and Africa - Market size and forecast 2024-2029 ($ billion)
        • Data Table on Middle East and Africa - Market size and forecast 2024-2029 ($ billion)
        • Chart on Middle East and Africa - Year-over-year growth 2024-2029 (%)
        • Data Table on Middle East and Africa - Year-over-year growth 2024-2029 (%)
      • 13.8 US - Market size and forecast 2024-2029
        • Chart on US - Market size and forecast 2024-2029 ($ billion)
        • Data Table on US - Market size and forecast 2024-2029 ($ billion)
        • Chart on US - Year-over-year growth 2024-2029 (%)
        • Data Table on US - Year-over-year growth 2024-2029 (%)
      • 13.9 Canada - Market size and forecast 2024-2029
        • Chart on Canada - Market size and forecast 2024-2029 ($ billion)
        • Data Table on Canada - Market size and forecast 2024-2029 ($ billion)
        • Chart on Canada - Year-over-year growth 2024-2029 (%)
        • Data Table on Canada - Year-over-year growth 2024-2029 (%)
      • 13.10 China - Market size and forecast 2024-2029
        • Chart on China - Market size and forecast 2024-2029 ($ billion)
        • Data Table on China - Market size and forecast 2024-2029 ($ billion)
        • Chart on China - Year-over-year growth 2024-2029 (%)
        • Data Table on China - Year-over-year growth 2024-2029 (%)
      • 13.11 Japan - Market size and forecast 2024-2029
        • Chart on Japan - Market size and forecast 2024-2029 ($ billion)
        • Data Table on Japan - Market size and forecast 2024-2029 ($ billion)
        • Chart on Japan - Year-over-year growth 2024-2029 (%)
        • Data Table on Japan - Year-over-year growth 2024-2029 (%)
      • 13.12 Germany - Market size and forecast 2024-2029
        • Chart on Germany - Market size and forecast 2024-2029 ($ billion)
        • Data Table on Germany - Market size and forecast 2024-2029 ($ billion)
        • Chart on Germany - Year-over-year growth 2024-2029 (%)
        • Data Table on Germany - Year-over-year growth 2024-2029 (%)
      • 13.13 UK - Market size and forecast 2024-2029
        • Chart on UK - Market size and forecast 2024-2029 ($ billion)
        • Data Table on UK - Market size and forecast 2024-2029 ($ billion)
        • Chart on UK - Year-over-year growth 2024-2029 (%)
        • Data Table on UK - Year-over-year growth 2024-2029 (%)
      • 13.14 UAE - Market size and forecast 2024-2029
        • Chart on UAE - Market size and forecast 2024-2029 ($ billion)
        • Data Table on UAE - Market size and forecast 2024-2029 ($ billion)
        • Chart on UAE - Year-over-year growth 2024-2029 (%)
        • Data Table on UAE - Year-over-year growth 2024-2029 (%)
      • 13.15 France - Market size and forecast 2024-2029
        • Chart on France - Market size and forecast 2024-2029 ($ billion)
        • Data Table on France - Market size and forecast 2024-2029 ($ billion)
        • Chart on France - Year-over-year growth 2024-2029 (%)
        • Data Table on France - Year-over-year growth 2024-2029 (%)
      • 13.16 India - Market size and forecast 2024-2029
        • Chart on India - Market size and forecast 2024-2029 ($ billion)
        • Data Table on India - Market size and forecast 2024-2029 ($ billion)
        • Chart on India - Year-over-year growth 2024-2029 (%)
        • Data Table on India - Year-over-year growth 2024-2029 (%)
      • 13.17 Brazil - Market size and forecast 2024-2029
        • Chart on Brazil - Market size and forecast 2024-2029 ($ billion)
        • Data Table on Brazil - Market size and forecast 2024-2029 ($ billion)
        • Chart on Brazil - Year-over-year growth 2024-2029 (%)
        • Data Table on Brazil - Year-over-year growth 2024-2029 (%)
      • 13.18 Market opportunity by geography
        • Market opportunity by geography ($ billion)
        • Data Tables on Market opportunity by geography ($ billion)
      • 13.19 Rest of World (ROW) - Market size and forecast (2024-2029)
        • Chart on Rest of World (ROW) - Market size and forecast (2024-2029) ($ billion)
        • Data Table on Rest of World (ROW) - Market size and forecast (2024-2029) ($ billion)
        • Chart on Rest of World (ROW) - Year-over-year growth (2024-2029) (%)
        • Data Table on Rest of World (ROW) - Year-over-year growth (2024-2029) (%)

      14 Drivers, Challenges, and Opportunity/Restraints

      • 14.1 Market drivers
        • 14.2 Market challenges
          • 14.3 Impact of drivers and challenges
            • Impact of drivers and challenges in 2024 and 2029
          • 14.4 Market opportunities/restraints

            15 Competitive Landscape

            • 15.1 Overview
              • 15.2 Competitive Landscape
                • Overview on criticality of inputs and factors of differentiation
              • 15.3 Landscape disruption
                • Overview on factors of disruption
              • 15.4 Industry risks
                • Impact of key risks on business

              16 Competitive Analysis

              • 16.1 Companies profiled
                • Companies covered
              • 16.2 Company ranking index
                • Company ranking index
              • 16.3 Market positioning of companies
                • Matrix on companies position and classification
              • 16.4 Adobe Inc.
                • Adobe Inc. - Overview
                • Adobe Inc. - Business segments
                • Adobe Inc. - Key news
                • Adobe Inc. - Key offerings
                • Adobe Inc. - Segment focus
                • SWOT
              • 16.5 AdTheorent Holding Co. Inc.
                • AdTheorent Holding Co. Inc. - Overview
                • AdTheorent Holding Co. Inc. - Product / Service
                • AdTheorent Holding Co. Inc. - Key offerings
                • SWOT
              • 16.6 Alphabet Inc.
                • Alphabet Inc. - Overview
                • Alphabet Inc. - Business segments
                • Alphabet Inc. - Key offerings
                • Alphabet Inc. - Segment focus
                • SWOT
              • 16.7 Comcast Corp.
                • Comcast Corp. - Overview
                • Comcast Corp. - Business segments
                • Comcast Corp. - Key news
                • Comcast Corp. - Key offerings
                • Comcast Corp. - Segment focus
                • SWOT
              • 16.8 Criteo SA
                • Criteo SA - Overview
                • Criteo SA - Product / Service
                • Criteo SA - Key offerings
                • SWOT
              • 16.9 Digital Turbine Inc.
                • Digital Turbine Inc. - Overview
                • Digital Turbine Inc. - Business segments
                • Digital Turbine Inc. - Key offerings
                • Digital Turbine Inc. - Segment focus
                • SWOT
              • 16.10 GUMGUM Inc.
                • GUMGUM Inc. - Overview
                • GUMGUM Inc. - Product / Service
                • GUMGUM Inc. - Key offerings
                • SWOT
              • 16.11 InMobi Pte. Ltd.
                • InMobi Pte. Ltd. - Overview
                • InMobi Pte. Ltd. - Product / Service
                • InMobi Pte. Ltd. - Key offerings
                • SWOT
              • 16.12 Innovid Corp.
                • Innovid Corp. - Overview
                • Innovid Corp. - Product / Service
                • Innovid Corp. - Key offerings
                • SWOT
              • 16.13 Integral Ad Science Holding Corp.
                • Integral Ad Science Holding Corp. - Overview
                • Integral Ad Science Holding Corp. - Business segments
                • Integral Ad Science Holding Corp. - Key offerings
                • Integral Ad Science Holding Corp. - Segment focus
                • SWOT
              • 16.14 Magnite Inc.
                • Magnite Inc. - Overview
                • Magnite Inc. - Product / Service
                • Magnite Inc. - Key offerings
                • SWOT
              • 16.15 MOLOCO Inc.
                • MOLOCO Inc. - Overview
                • MOLOCO Inc. - Product / Service
                • MOLOCO Inc. - Key offerings
                • SWOT
              • 16.16 Ogury Ltd.
                • Ogury Ltd. - Overview
                • Ogury Ltd. - Product / Service
                • Ogury Ltd. - Key offerings
                • SWOT
              • 16.17 Permutive Inc.
                • Permutive Inc. - Overview
                • Permutive Inc. - Product / Service
                • Permutive Inc. - Key offerings
                • SWOT
              • 16.18 VideoAmp
                • VideoAmp - Overview
                • VideoAmp - Product / Service
                • VideoAmp - Key offerings
                • SWOT

              17 Appendix

              • 17.1 Scope of the report
                • 17.2 Inclusions and exclusions checklist
                  • Inclusions checklist
                  • Exclusions checklist
                • 17.3 Currency conversion rates for US$
                  • Currency conversion rates for US$
                • 17.4 Research methodology
                  • Research methodology
                • 17.5 Data procurement
                  • Information sources
                • 17.6 Data validation
                  • Data validation
                • 17.7 Validation techniques employed for market sizing
                  • Validation techniques employed for market sizing
                • 17.8 Data synthesis
                  • Data synthesis
                • 17.9 360 degree market analysis
                  • 360 degree market analysis
                • 17.10 List of abbreviations
                  • List of abbreviations

                Research Methodology

                Technavio presents a detailed picture of the market by way of study, synthesis, and summation of data from multiple sources. The analysts have presented the various facets of the market with a particular focus on identifying the key industry influencers. The data thus presented is comprehensive, reliable, and the result of extensive research, both primary and secondary.

                INFORMATION SOURCES

                Primary sources

                • Manufacturers and suppliers
                • Channel partners
                • Industry experts
                • Strategic decision makers

                Secondary sources

                • Industry journals and periodicals
                • Government data
                • Financial reports of key industry players
                • Historical data
                • Press releases

                DATA ANALYSIS

                Data Synthesis

                • Collation of data
                • Estimation of key figures
                • Analysis of derived insights

                Data Validation

                • Triangulation with data models
                • Reference against proprietary databases
                • Corroboration with industry experts

                REPORT WRITING

                Qualitative

                • Market drivers
                • Market challenges
                • Market trends
                • Five forces analysis

                Quantitative

                • Market size and forecast
                • Market segmentation
                • Geographical insights
                • Competitive landscape

                Interested in this report?

                Get your sample now to see our research methodology and insights!

                Download Now

                Frequently Asked Questions

                Adtech market growth will increase by $ 1080.1 bn during 2025-2029 .

                The Adtech market is expected to grow at a CAGR of 14.6% during 2025-2029 .

                Adtech market is segmented by Solution( Demand-side platforms (DSPs), Supply-side platforms (SSPs), Ad networks, Data management platforms (DMPs), Others) Platform( Mobile Ad, Desktop Ad, Digital TV)

                33Across Inc., AcuityAds Holdings Inc., Adobe Inc., AdTheorent Holding Co. Inc., Adverty AB, Alphabet Inc., Comcast Corp., Criteo SA, Digital Turbine Inc., DoubleVerify Holdings Inc., GUMGUM Inc., InMobi Pte. Ltd., Innovid Corp., Integral Ad Science Holding Corp., Magnite Inc., MOLOCO Inc., Ogury Ltd., Permutive Inc., StackAdapt Inc., VideoAmp are a few of the key vendors in the Adtech market.

                North America will register the highest growth rate of 33% among the other regions. Therefore, the Adtech market in North America is expected to garner significant business opportunities for the vendors during the forecast period.

                US, China, Canada, Japan, Germany, UK, UAE, India, France, Brazil

                • Increasing Internet and smartphone penetrationAs more people gain access to the Internet and smartphones is the driving factor this market.
                • the demand for adtech platforms has increased. With Internet and smartphone penetration is the driving factor this market.
                • more people can access adtech platforms anywhere and anytime. This convenience has made adtech platforms popular among both buyers and sellers. This has led to the growth of the adtech market is the driving factor this market.
                • with more people using their smartphones to browse and post ads. As a result is the driving factor this market.
                • adtech platform providers have invested heavily in mobile applications to cater to the growing number of mobile users. Thus is the driving factor this market.
                • increasing Internet and smartphone penetration is a major driver in the global adtech market is the driving factor this market.
                • and this trend is expected to continue as technology advances. With the increasing adoption of the Internet and smartphones is the driving factor this market.
                • more people are going online to search for products and services. Thus is the driving factor this market.
                • this will increase the demand for adtech from advertising publishers is the driving factor this market.
                • which will drive the growth of the global adtech market during the forecast period. is the driving factor this market.

                The Adtech market vendors should focus on grabbing business opportunities from the Demand-side platforms (DSPs) segment as it accounted for the largest market share in the base year.