Agave Syrup Market Analysis APAC, Europe, North America, South America, Middle East and Africa - US, China, Thailand, The Netherlands, France - Size and Forecast 2024-2028

Agave Syrup Market Analysis APAC, Europe, North America, South America, Middle East and Africa - US, China, Thailand, The Netherlands, France - Size and Forecast 2024-2028

Published: Jan 2024 158 Pages SKU: IRTNTR72891

Market Overview at a Glance

$58.88 Mn
Market Opportunity
6.11%
CAGR
5.61
YoY growth 2023-2024(%)

Agave Syrup Market Size 2024-2028

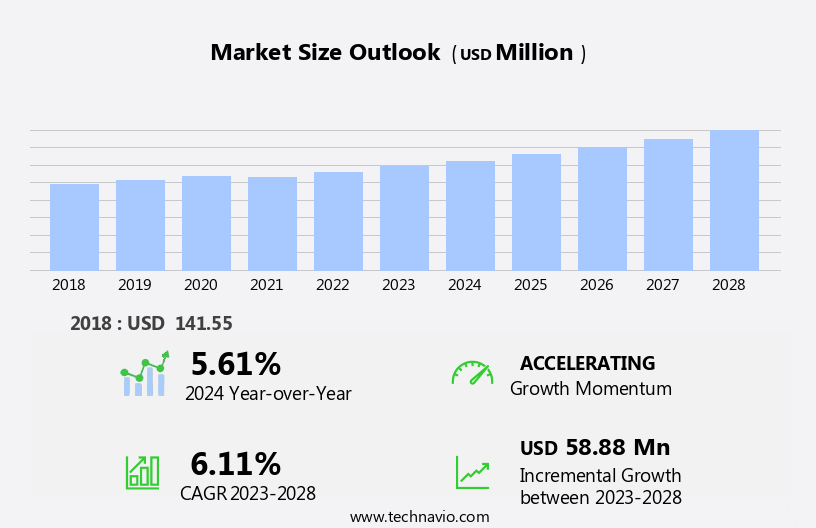
The agave syrup market size is forecast to increase by USD 58.88 million at a CAGR of 6.11% between 2023 and 2028.

  • Agave syrup, a natural sweetener derived from the agave plant, has been gaining popularity in the global food and beverage industry due to its unique taste and health benefits. The market for agave syrup is driven by several key trends, including the increasing preference for natural sweeteners and the growing popularity of plant-based diets. Additionally, the availability of substitutes for agave syrup, such as honey and high-fructose corn syrup, poses a challenge to the market's growth. E-commerce platforms have made it easier for consumers to purchase agave syrup, further increasing its popularity. However, the health benefits associated with agave syrup, including its low glycemic index and high fructose content, make it an attractive alternative to traditional sugar. As consumers become more health-conscious and seek out natural and plant-based options, the demand for agave syrup is expected to continue growing.

What will be the Size of the Agave Syrup Market During the Forecast Period?

Agave Syrup Market Size

 Request Free Sample

  • The market encompasses the production and distribution of this natural sweetener derived from the agave plant. Agave syrup, a popular sugar alternative, offers a unique taste profile, with a smooth and sweet flavor, making it an attractive ingredient for various applications, including smoothies, baking, cooking, and cocktails. Its fructose content, which is naturally occurring in agave, is lower than that of high-fructose corn syrup, contributing to its appeal as a healthier sweetener option for consumers. The market's growth is driven by increasing consumer awareness of sustainable and plant-based ingredients, ethical sourcing, and health benefits. Agave syrup is often preferred over traditional sugar and honey due to its lower glycemic index and vegan-friendly status.
  • Moreover, the rise in weight loss trends and the growing popularity of organic and natural food products have further fueled market growth. The production process of agave syrup involves the extraction of sap from the agave plant, which is then boiled to create a thick, sweet syrup. This process is more sustainable compared to traditional sugar production methods, contributing to the market's environmental appeal. Agave syrup's versatility and health benefits have led to its increasing use in various industries, including food and beverage production, supermarkets, and specialty food stores. As consumer preferences continue to shift towards healthier and more sustainable options, the demand for agave syrup as a sugar alternative is expected to grow.

How is this Agave Syrup Industry segmented and which is the largest segment?

The industry research report provides comprehensive data (region-wise segment analysis), with forecasts and estimates in "USD million" for the period 2024-2028, as well as historical data from 2018-2022 for the following segments.

  • Application
    • Emulsifier
    • Flavor enhancer
    • Sweetener
  • Product Type
    • Conventional
    • Organic
  • Geography
    • APAC
      • China
      • Thailand
    • Europe
      • France
    • North America
      • US
    • South America
    • Middle East and Africa

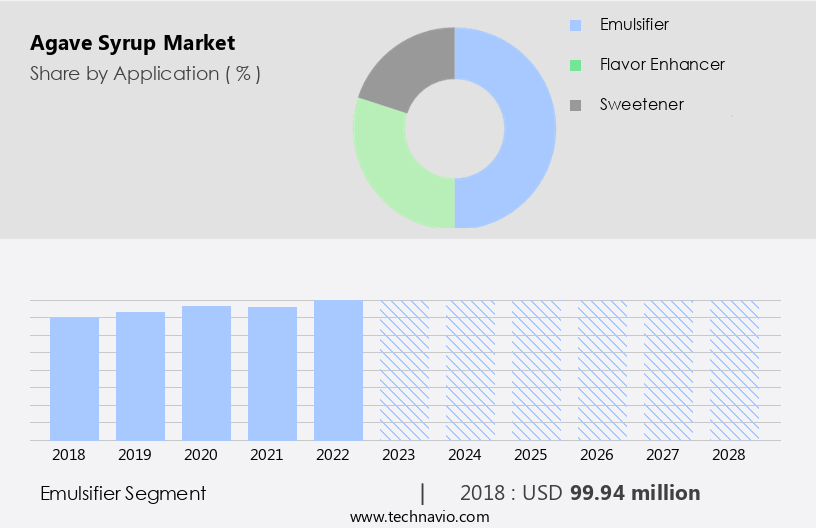
By Application Insights

  • The emulsifier segment is estimated to witness significant growth during the forecast period. Agave syrup is a natural sweetener derived from the agave plant, specifically blue agave. It contains fructose instead of sucrose, making it a popular choice for health-conscious consumers seeking to reduce their sugar consumption and manage diseases like diabetes The syrup is free from artificial sweeteners, pesticides, and herbicides, making it an organic product movement favorite. Its low glycemic index and natural sweetness make it an ideal sugar substitute for those with insulin resistance and nervous system disorders. It is used as a flavoring agent in various food products, including beverages, dairy products, and vegan trademarks. It is also used in cosmetics and toiletries.
  • Agave syrup's glycemic index is lower than that of refined sugar, making it a healthier alternative. Health hazards associated with refined sugar, such as obesity and weight gain, are avoided with the use of the syrup. The increasing awareness campaigns for natural sugar substitutes and plant-based diets have driven the demand for the syrup. The product's versatility allows for various formulations, including flavored nectars and amber-colored syrups. The syrup is vegan, vegan-certified, and free from folate, making it a popular choice among the diabetic population and those following a vegan lifestyle.

Agave Syrup Market Size

Get a glance at the market report of various segments Request Free Sample

The Emulsifier segment was valued at USD 99.94 million in 2018 and showed a gradual increase during the forecast period.

Regional Analysis

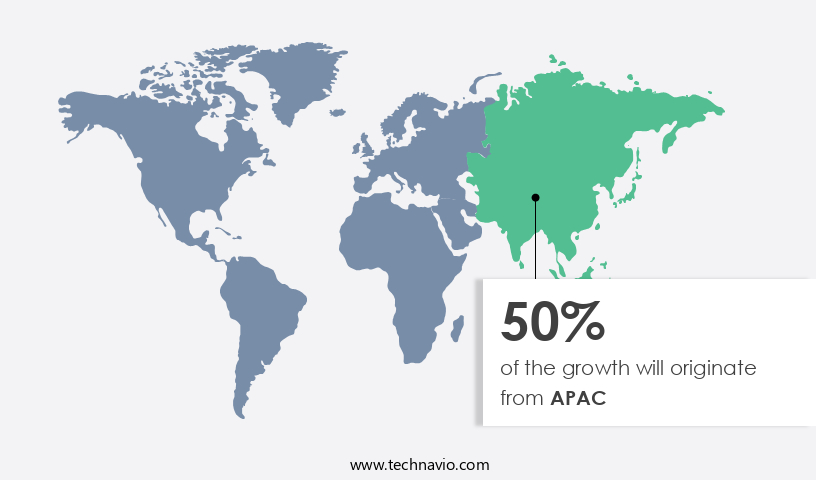
APAC is estimated to contribute 50% to the growth of the global market during the forecast period. Technavio's analysts have elaborately explained the regional trends and drivers that shape the market during the forecast period.

Agave Syrup Market Share by Geography

For more insights on the market size of various regions, Request Free Sample

The market in APAC is experiencing growth due to the increasing popularity of natural emulsifiers and low-fat ingredients. The syrup is gaining traction as a flavoring agent in various food products, including baked goods, confectioneries, dairy products, and beverages, driving market expansion. In countries like China, India, and Japan, the demand for processed food items, particularly ready-to-eat (RTE) and low-fat foods, is on the rise. This trend has led to an increase in the use of the syrup. Additionally, the growing preference for natural sweeteners and heightened health consciousness among consumers In the region are fueling the demand for agave syrup.

Providers of agave syrup have entered the market to cater to the rising demand for food emulsifiers, commonly used in the food and beverage industries in APAC. Agave syrup, with its low glycemic index and natural sweetness, is a healthier alternative to refined sugar, making it an attractive option for health-conscious consumers. It is also popular among the diabetic population and those following plant-based diets. The syrup is free from pesticides and herbicides, making it a safer choice for consumers concerned about health hazards. The organic product movement has further boosted the demand for organic certified agave syrup. It is also used as a flavoring agent in cosmetics and toiletries and as a sugar substitute in various food recipes.

Market Dynamics

Our researchers analyzed the data with 2023 as the base year, along with the key drivers, trends, and challenges. A holistic analysis of drivers will help companies refine their marketing strategies to gain a competitive advantage.

What are the key market drivers leading to the rise in the adoption of Agave Syrup Industry?

  • Growing preference for natural sweeteners is the key driver of the market. Agave syrup, a vegan sweetener derived from the agave plant, has gained popularity as a natural alternative to traditional sweeteners like refined sugar and artificial sweeteners. With increasing health consciousness among consumers, the demand for low glycemic index natural sweetener products has risen. Obesity and related health issues, including diabetes, insulin resistance, and nervous system disorders, are major concerns in the US, driving the preference for healthier alternatives. Agave syrup, with its low fructose content and natural sweetness, is an attractive option. It is free from pesticides and herbicides, making it a safer choice for those seeking to avoid the health hazards associated with refined sugar.
  • Agave syrup is used in various food recipes, beverages, and even as a flavoring agent in vegan and dairy products. The organic product movement has further fueled the demand for organic certified agave syrup, which is rich in essential nutrients like folate, vitamin B6, and other micronutrients. The e-commerce industry has made it easier for consumers to access syrup and other natural sweetener products, contributing to their growing popularity. The syrup is a suitable sugar substitute for those managing diabetes, as it has a low glycemic index and does not spike blood sugar levels. Additionally, it is a popular choice for those following plant-based diets or vegan lifestyles.

What are the market trends shaping the Agave Syrup market?

  • Growing popularity of plant-based diets is an upcoming market trend. The syrup has gained prominence in the food industry due to the rising trend of plant-based diets, including vegetarianism and veganism. Health-conscious consumers are increasingly seeking natural sweetener products as alternatives to refined sugar and artificial sweeteners, which are associated with health hazards such as obesity, insulin resistance, and diseases like diabetes. Agave syrup, a natural sweetener derived directly from the agave plant, offers a low glycemic index, making it a preferred choice for those managing their blood sugar levels. Agave syrup's fructose content is lower than that of high fructose corn syrup, making it a more desirable option for those concerned about the health risks associated with excessive fructose consumption.
  • Agave syrup is also vegan, free from pesticides and herbicides, and is available in various flavors, including vanilla and amber, making it a versatile ingredient for food recipes and beverages. The organic product movement has further fueled the demand for agave syrup, as consumers increasingly seek out organic certified natural sweeteners. The syrup is used not only as a sugar substitute but also as a flavoring agent in various food products, including dairy alternatives, cosmetics and toiletries, and beverages. With increasing awareness campaigns promoting the health benefits of natural sweeteners and the growing diabetic population, the demand for the syrup is expected to continue rising.

What challenges does the Agave Syrup Industry face during its growth?

  • Availability of substitutes for agave syrup is a key challenge affecting the industry growth. The syrup faces challenges in the global market due to the availability of various substitute sweeteners. These alternatives, such as honey, maple syrup, date syrup, and corn syrup, offer consumers diverse tastes and dietary options. Health-conscious consumers may prefer these substitutes based on their perceived health benefits, including lower fructose content and organic certification. Additionally, some consumers may choose alternatives due to concerns over the potential health hazards associated with agave syrup, including insulin resistance and nervous system damage. The price sensitivity of these substitutes, particularly maple syrup and date syrup, also hinders the growth of the market. Consumers' preferences for lower glycemic index sweeteners, such as those found in agave syrup, are increasingly driving demand for natural sweetener products.
  • However, the organic product movement and awareness campaigns against refined sugar and artificial sweeteners are also influencing consumer choices. Agave syrup's role as a natural sweetener, flavoring agent, and sugar substitute in food products, beverages, and vegan trademarks, including cosmetics and toiletries, remains significant. The diabetic population and those following plant-based diets continue to seek syrup as a low glycemic index alternative to refined sugar. The market dynamics of the syrup industry are shaped by these factors, making it essential for businesses to understand consumer preferences and adapt their product formulations accordingly.

Exclusive Customer Landscape

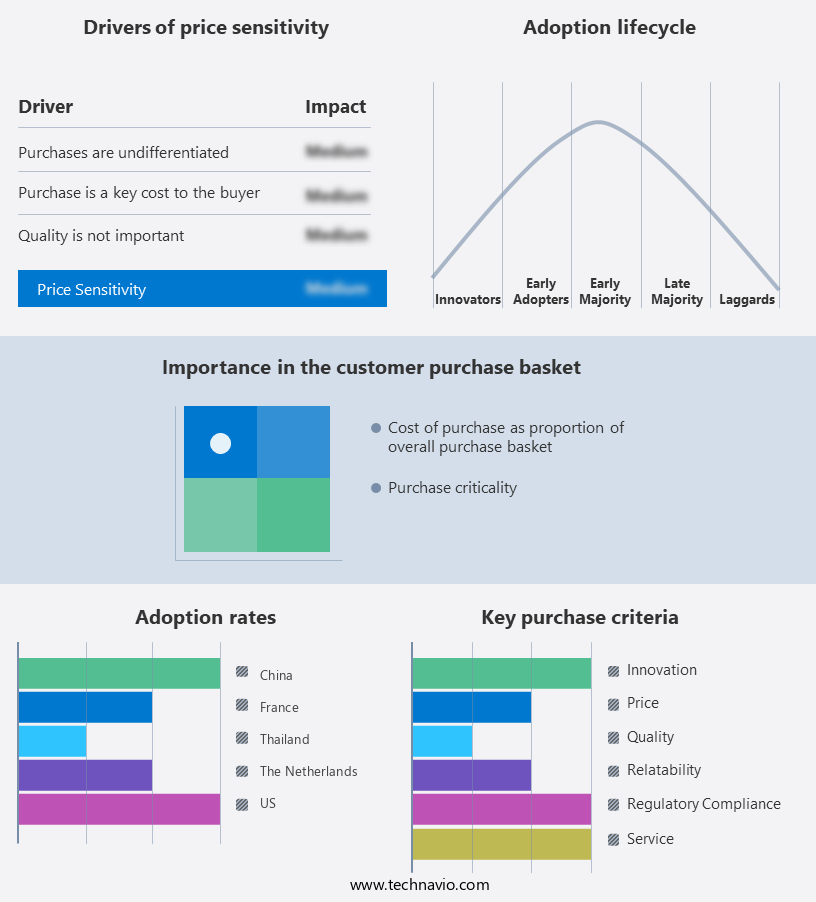
The market forecasting report includes the adoption lifecycle of the market, covering from the innovator's stage to the laggard's stage. It focuses on adoption rates in different regions based on penetration. Furthermore, the market report also includes key purchase criteria and drivers of price sensitivity to help companies evaluate and develop their market growth analysis strategies.

Agave Syrup Market Share by Geography

 Customer Landscape

Key Companies & Market Insights

Companies are implementing various strategies, such as strategic alliances, market forecast, partnerships, mergers and acquisitions, geographical expansion, and product/service launches, to enhance their presence in the industry.

The industry research and growth report includes detailed analyses of the competitive landscape of the market and information about key companies, including:

  • American Beverage Marketers
  • Archer Daniels Midland Co.
  • Ciranda Inc.
  • Dandy Lions Ltd.
  • Dipasa USA Inc.
  • Global Goods Inc.
  • Histon Sweet Spreads Ltd.
  • Madhava Ltd.
  • Malt Products Corp.
  • NOW Health Group Inc.
  • Sisana Sweeteners EU BV
  • Tate and Lyle PLC
  • The Groovy Food Co.
  • The Hain Celestial Group Inc.
  • ASR Group International Inc.
  • Best Ground International
  • Colibree Co
  • Naturalever de Mexico
  • Natures Agave Inc
  • The Tierra Group

Qualitative and quantitative analysis of companies has been conducted to help clients understand the wider business environment as well as the strengths and weaknesses of key industry players. Data is qualitatively analyzed to categorize companies as pure play, category-focused, industry-focused, and diversified; it is quantitatively analyzed to categorize companies as dominant, leading, strong, tentative, and weak.

Research Analyst Overview

Agave syrup, a natural sweetener derived from the agave plant, has gained significant attention in the global food and beverage industry due to its unique characteristics and health benefits. This sweetener, with its rich, amber color and sweet, mild flavor, has emerged as a popular alternative to refined sugar and artificial sweeteners. The market is driven by several factors, including the increasing health-consciousness among consumers and the growing awareness of the health hazards associated with refined sugar and artificial sweeteners. The rising prevalence of obesity, diabetes, and other diseases linked to sugar consumption has fueled the demand for natural sweetener products.

Moreover, the organic product movement and the increasing popularity of plant-based diets have further boosted the market growth. Agave syrup, being a vegan and organic certified product, is a preferred choice for consumers following a vegan lifestyle or those seeking to avoid animal-derived products. The market is witnessing innovation and product development, with companies introducing new formulations and flavored nectars to cater to evolving consumer preferences. The sweetener is used in various food products, including baked goods, beverages, and dairy alternatives, as well as in cosmetics and toiletries. Despite the numerous benefits, the market faces challenges due to concerns regarding its fructose content and potential health hazards.

Furthermore, some studies suggest that excessive consumption of the syrup may lead to insulin resistance, nervous system disorders, and other health issues. However, these concerns are being addressed through awareness campaigns and the development of low glycemic index agave syrup formulations. The market is also witnessing growth in the e-commerce sector, with online sales contributing significantly to the overall revenue. Consumers are increasingly turning to e-commerce platforms to purchase syrup and other natural sweetener products, owing to the convenience and accessibility they offer.

Market Scope

Report Coverage

Details

Page number

158

Base year

2023

Historic period

2018-2022

Forecast period

2024-2028

Growth momentum & CAGR

Accelerate at a CAGR of 6.11%

Market growth 2024-2028

USD 58.88 million

Market structure

Fragmented

YoY growth 2023-2024(%)

5.61

Key countries

US, China, Thailand, The Netherlands, and France

Competitive landscape

Leading Companies, Market Positioning of Companies, Competitive Strategies, and Industry Risks

Request Free Sample

What are the Key Data Covered in this Market Research and Growth Report?

  • CAGR of the industry during the forecast period
  • Detailed information on factors that will drive the market growth and forecasting between 2024 and 2028
  • Precise estimation of the size of the market and its contribution of the industry in focus to the parent market
  • Accurate predictions about upcoming growth and trends and changes in consumer behaviour
  • Growth of the market across APAC, Europe, North America, South America, and Middle East and Africa
  • Thorough analysis of the market's competitive landscape and detailed information about companies
  • Comprehensive analysis of factors that will challenge the market growth of industry companies

We can help! Our analysts can customize this market research report to meet your requirements.

Get in touch

1 Executive Summary

  • 1.1 Market overview
    • Exhibit 01: Executive Summary – Chart on Market Overview
    • Exhibit 02: Executive Summary – Data Table on Market Overview
    • Exhibit 03: Executive Summary – Chart on Global Market Characteristics
    • Exhibit 04: Executive Summary – Chart on Market by Geography
    • Exhibit 05: Executive Summary – Chart on Market Segmentation by Application
    • Exhibit 06: Executive Summary – Chart on Market Segmentation by Product Type
    • Exhibit 07: Executive Summary – Chart on Incremental Growth
    • Exhibit 08: Executive Summary – Data Table on Incremental Growth
    • Exhibit 09: Executive Summary – Chart on Vendor Market Positioning

2 Market Landscape

  • 2.1 Market ecosystem
    • Exhibit 10: Parent market
    • Exhibit 11: Market Characteristics

3 Market Sizing

  • 3.1 Market definition
    • Exhibit 12: Offerings of vendors included in the market definition
  • 3.2 Market segment analysis
    • Exhibit 13: Market segments
  • 3.3 Market size 2023
    • 3.4 Market outlook: Forecast for 2023-2028
      • Exhibit 14: Chart on Global - Market size and forecast 2023-2028 ($ million)
      • Exhibit 15: Data Table on Global - Market size and forecast 2023-2028 ($ million)
      • Exhibit 16: Chart on Global Market: Year-over-year growth 2023-2028 (%)
      • Exhibit 17: Data Table on Global Market: Year-over-year growth 2023-2028 (%)

    4 Historic Market Size

    • 4.1 Global agave syrup market 2018 - 2022
      • Exhibit 18: Historic Market Size – Data Table on global agave syrup market 2018 - 2022 ($ million)
    • 4.2 Application Segment Analysis 2018 - 2022
      • Exhibit 19: Historic Market Size – Application Segment 2018 - 2022 ($ million)
    • 4.3 Product Type Segment Analysis 2018 - 2022
      • Exhibit 20: Historic Market Size – Product Type Segment 2018 - 2022 ($ million)
    • 4.4 Geography Segment Analysis 2018 - 2022
      • Exhibit 21: Historic Market Size – Geography Segment 2018 - 2022 ($ million)
    • 4.5 Country Segment Analysis 2018 - 2022
      • Exhibit 22: Historic Market Size – Country Segment 2018 - 2022 ($ million)

    5 Five Forces Analysis

    • 5.1 Five forces summary
      • Exhibit 23: Five forces analysis - Comparison between 2023 and 2028
    • 5.2 Bargaining power of buyers
      • Exhibit 24: Chart on Bargaining power of buyers – Impact of key factors 2023 and 2028
    • 5.3 Bargaining power of suppliers
      • Exhibit 25: Bargaining power of suppliers – Impact of key factors in 2023 and 2028
    • 5.4 Threat of new entrants
      • Exhibit 26: Threat of new entrants – Impact of key factors in 2023 and 2028
    • 5.5 Threat of substitutes
      • Exhibit 27: Threat of substitutes – Impact of key factors in 2023 and 2028
    • 5.6 Threat of rivalry
      • Exhibit 28: Threat of rivalry – Impact of key factors in 2023 and 2028
    • 5.7 Market condition
      • Exhibit 29: Chart on Market condition - Five forces 2023 and 2028

    6 Market Segmentation by Application

    • 6.1 Market segments
      • Exhibit 30: Chart on Application - Market share 2023-2028 (%)
      • Exhibit 31: Data Table on Application - Market share 2023-2028 (%)
    • 6.2 Comparison by Application
      • Exhibit 32: Chart on Comparison by Application
      • Exhibit 33: Data Table on Comparison by Application
    • 6.3 Emulsifier - Market size and forecast 2023-2028
      • Exhibit 34: Chart on Emulsifier - Market size and forecast 2023-2028 ($ million)
      • Exhibit 35: Data Table on Emulsifier - Market size and forecast 2023-2028 ($ million)
      • Exhibit 36: Chart on Emulsifier - Year-over-year growth 2023-2028 (%)
      • Exhibit 37: Data Table on Emulsifier - Year-over-year growth 2023-2028 (%)
    • 6.4 Flavor enhancer - Market size and forecast 2023-2028
      • Exhibit 38: Chart on Flavor enhancer - Market size and forecast 2023-2028 ($ million)
      • Exhibit 39: Data Table on Flavor enhancer - Market size and forecast 2023-2028 ($ million)
      • Exhibit 40: Chart on Flavor enhancer - Year-over-year growth 2023-2028 (%)
      • Exhibit 41: Data Table on Flavor enhancer - Year-over-year growth 2023-2028 (%)
    • 6.5 Sweetener - Market size and forecast 2023-2028
      • Exhibit 42: Chart on Sweetener - Market size and forecast 2023-2028 ($ million)
      • Exhibit 43: Data Table on Sweetener - Market size and forecast 2023-2028 ($ million)
      • Exhibit 44: Chart on Sweetener - Year-over-year growth 2023-2028 (%)
      • Exhibit 45: Data Table on Sweetener - Year-over-year growth 2023-2028 (%)
    • 6.6 Market opportunity by Application
      • Exhibit 46: Market opportunity by Application ($ million)
      • Exhibit 47: Data Table on Market opportunity by Application ($ million)

    7 Market Segmentation by Product Type

    • 7.1 Market segments
      • Exhibit 48: Chart on Product Type - Market share 2023-2028 (%)
      • Exhibit 49: Data Table on Product Type - Market share 2023-2028 (%)
    • 7.2 Comparison by Product Type
      • Exhibit 50: Chart on Comparison by Product Type
      • Exhibit 51: Data Table on Comparison by Product Type
    • 7.3 Conventional - Market size and forecast 2023-2028
      • Exhibit 52: Chart on Conventional - Market size and forecast 2023-2028 ($ million)
      • Exhibit 53: Data Table on Conventional - Market size and forecast 2023-2028 ($ million)
      • Exhibit 54: Chart on Conventional - Year-over-year growth 2023-2028 (%)
      • Exhibit 55: Data Table on Conventional - Year-over-year growth 2023-2028 (%)
    • 7.4 Organic - Market size and forecast 2023-2028
      • Exhibit 56: Chart on Organic - Market size and forecast 2023-2028 ($ million)
      • Exhibit 57: Data Table on Organic - Market size and forecast 2023-2028 ($ million)
      • Exhibit 58: Chart on Organic - Year-over-year growth 2023-2028 (%)
      • Exhibit 59: Data Table on Organic - Year-over-year growth 2023-2028 (%)
    • 7.5 Market opportunity by Product Type
      • Exhibit 60: Market opportunity by Product Type ($ million)
      • Exhibit 61: Data Table on Market opportunity by Product Type ($ million)

    8 Customer Landscape

    • 8.1 Customer landscape overview
      • Exhibit 62: Analysis of price sensitivity, lifecycle, customer purchase basket, adoption rates, and purchase criteria

    9 Geographic Landscape

    • 9.1 Geographic segmentation
      • Exhibit 63: Chart on Market share by geography 2023-2028 (%)
      • Exhibit 64: Data Table on Market share by geography 2023-2028 (%)
    • 9.2 Geographic comparison
      • Exhibit 65: Chart on Geographic comparison
      • Exhibit 66: Data Table on Geographic comparison
    • 9.3 APAC - Market size and forecast 2023-2028
      • Exhibit 67: Chart on APAC - Market size and forecast 2023-2028 ($ million)
      • Exhibit 68: Data Table on APAC - Market size and forecast 2023-2028 ($ million)
      • Exhibit 69: Chart on APAC - Year-over-year growth 2023-2028 (%)
      • Exhibit 70: Data Table on APAC - Year-over-year growth 2023-2028 (%)
    • 9.4 Europe - Market size and forecast 2023-2028
      • Exhibit 71: Chart on Europe - Market size and forecast 2023-2028 ($ million)
      • Exhibit 72: Data Table on Europe - Market size and forecast 2023-2028 ($ million)
      • Exhibit 73: Chart on Europe - Year-over-year growth 2023-2028 (%)
      • Exhibit 74: Data Table on Europe - Year-over-year growth 2023-2028 (%)
    • 9.5 North America - Market size and forecast 2023-2028
      • Exhibit 75: Chart on North America - Market size and forecast 2023-2028 ($ million)
      • Exhibit 76: Data Table on North America - Market size and forecast 2023-2028 ($ million)
      • Exhibit 77: Chart on North America - Year-over-year growth 2023-2028 (%)
      • Exhibit 78: Data Table on North America - Year-over-year growth 2023-2028 (%)
    • 9.6 South America - Market size and forecast 2023-2028
      • Exhibit 79: Chart on South America - Market size and forecast 2023-2028 ($ million)
      • Exhibit 80: Data Table on South America - Market size and forecast 2023-2028 ($ million)
      • Exhibit 81: Chart on South America - Year-over-year growth 2023-2028 (%)
      • Exhibit 82: Data Table on South America - Year-over-year growth 2023-2028 (%)
    • 9.7 Middle East and Africa - Market size and forecast 2023-2028
      • Exhibit 83: Chart on Middle East and Africa - Market size and forecast 2023-2028 ($ million)
      • Exhibit 84: Data Table on Middle East and Africa - Market size and forecast 2023-2028 ($ million)
      • Exhibit 85: Chart on Middle East and Africa - Year-over-year growth 2023-2028 (%)
      • Exhibit 86: Data Table on Middle East and Africa - Year-over-year growth 2023-2028 (%)
    • 9.8 China - Market size and forecast 2023-2028
      • Exhibit 87: Chart on China - Market size and forecast 2023-2028 ($ million)
      • Exhibit 88: Data Table on China - Market size and forecast 2023-2028 ($ million)
      • Exhibit 89: Chart on China - Year-over-year growth 2023-2028 (%)
      • Exhibit 90: Data Table on China - Year-over-year growth 2023-2028 (%)
    • 9.9 Thailand - Market size and forecast 2023-2028
      • Exhibit 91: Chart on Thailand - Market size and forecast 2023-2028 ($ million)
      • Exhibit 92: Data Table on Thailand - Market size and forecast 2023-2028 ($ million)
      • Exhibit 93: Chart on Thailand - Year-over-year growth 2023-2028 (%)
      • Exhibit 94: Data Table on Thailand - Year-over-year growth 2023-2028 (%)
    • 9.10 The Netherlands - Market size and forecast 2023-2028
      • Exhibit 95: Chart on The Netherlands - Market size and forecast 2023-2028 ($ million)
      • Exhibit 96: Data Table on The Netherlands - Market size and forecast 2023-2028 ($ million)
      • Exhibit 97: Chart on The Netherlands - Year-over-year growth 2023-2028 (%)
      • Exhibit 98: Data Table on The Netherlands - Year-over-year growth 2023-2028 (%)
    • 9.11 US - Market size and forecast 2023-2028
      • Exhibit 99: Chart on US - Market size and forecast 2023-2028 ($ million)
      • Exhibit 100: Data Table on US - Market size and forecast 2023-2028 ($ million)
      • Exhibit 101: Chart on US - Year-over-year growth 2023-2028 (%)
      • Exhibit 102: Data Table on US - Year-over-year growth 2023-2028 (%)
    • 9.12 France - Market size and forecast 2023-2028
      • Exhibit 103: Chart on France - Market size and forecast 2023-2028 ($ million)
      • Exhibit 104: Data Table on France - Market size and forecast 2023-2028 ($ million)
      • Exhibit 105: Chart on France - Year-over-year growth 2023-2028 (%)
      • Exhibit 106: Data Table on France - Year-over-year growth 2023-2028 (%)
    • 9.13 Market opportunity by geography
      • Exhibit 107: Market opportunity by geography ($ million)
      • Exhibit 108: Data Tables on Market opportunity by geography ($ million)

    10 Drivers, Challenges, and Trends

    • 10.1 Market drivers
      • 10.2 Market challenges
        • 10.3 Impact of drivers and challenges
          • Exhibit 109: Impact of drivers and challenges in 2023 and 2028
        • 10.4 Market trends

          11 Vendor Landscape

          • 11.1 Overview
            • 11.2 Vendor landscape
              • Exhibit 110: Overview on Criticality of inputs and Factors of differentiation
            • 11.3 Landscape disruption
              • Exhibit 111: Overview on factors of disruption
            • 11.4 Industry risks
              • Exhibit 112: Impact of key risks on business

            12 Vendor Analysis

            • 12.1 Vendors covered
              • Exhibit 113: Vendors covered
            • 12.2 Market positioning of vendors
              • Exhibit 114: Matrix on vendor position and classification
            • 12.3 American Beverage Marketers
              • Exhibit 115: American Beverage Marketers - Overview
              • Exhibit 116: American Beverage Marketers - Product / Service
              • Exhibit 117: American Beverage Marketers - Key offerings
            • 12.4 Archer Daniels Midland Co.
              • Exhibit 118: Archer Daniels Midland Co. - Overview
              • Exhibit 119: Archer Daniels Midland Co. - Business segments
              • Exhibit 120: Archer Daniels Midland Co. - Key offerings
              • Exhibit 121: Archer Daniels Midland Co. - Segment focus
            • 12.5 ASR Group International Inc.
              • Exhibit 122: ASR Group International Inc. - Overview
              • Exhibit 123: ASR Group International Inc. - Product / Service
              • Exhibit 124: ASR Group International Inc. - Key offerings
            • 12.6 Best Ground International
              • Exhibit 125: Best Ground International - Overview
              • Exhibit 126: Best Ground International - Product / Service
              • Exhibit 127: Best Ground International - Key offerings
            • 12.7 Ciranda Inc.
              • Exhibit 128: Ciranda Inc. - Overview
              • Exhibit 129: Ciranda Inc. - Product / Service
              • Exhibit 130: Ciranda Inc. - Key offerings
            • 12.8 Colibree Co
              • Exhibit 131: Colibree Co - Overview
              • Exhibit 132: Colibree Co - Product / Service
              • Exhibit 133: Colibree Co - Key offerings
            • 12.9 Dandy Lions Ltd.
              • Exhibit 134: Dandy Lions Ltd. - Overview
              • Exhibit 135: Dandy Lions Ltd. - Product / Service
              • Exhibit 136: Dandy Lions Ltd. - Key offerings
            • 12.10 Dipasa USA Inc.
              • Exhibit 137: Dipasa USA Inc. - Overview
              • Exhibit 138: Dipasa USA Inc. - Product / Service
              • Exhibit 139: Dipasa USA Inc. - Key offerings
            • 12.11 Global Goods Inc.
              • Exhibit 140: Global Goods Inc. - Overview
              • Exhibit 141: Global Goods Inc. - Product / Service
              • Exhibit 142: Global Goods Inc. - Key offerings
            • 12.12 Histon Sweet Spreads Ltd.
              • Exhibit 143: Histon Sweet Spreads Ltd. - Overview
              • Exhibit 144: Histon Sweet Spreads Ltd. - Product / Service
              • Exhibit 145: Histon Sweet Spreads Ltd. - Key offerings
            • 12.13 Madhava Ltd.
              • Exhibit 146: Madhava Ltd. - Overview
              • Exhibit 147: Madhava Ltd. - Product / Service
              • Exhibit 148: Madhava Ltd. - Key offerings
            • 12.14 Malt Products Corp.
              • Exhibit 149: Malt Products Corp. - Overview
              • Exhibit 150: Malt Products Corp. - Product / Service
              • Exhibit 151: Malt Products Corp. - Key offerings
            • 12.15 Sisana Sweeteners EU BV
              • Exhibit 152: Sisana Sweeteners EU BV - Overview
              • Exhibit 153: Sisana Sweeteners EU BV - Product / Service
              • Exhibit 154: Sisana Sweeteners EU BV - Key offerings
            • 12.16 Tate and Lyle PLC
              • Exhibit 155: Tate and Lyle PLC - Overview
              • Exhibit 156: Tate and Lyle PLC - Business segments
              • Exhibit 157: Tate and Lyle PLC - Key news
              • Exhibit 158: Tate and Lyle PLC - Key offerings
              • Exhibit 159: Tate and Lyle PLC - Segment focus
            • 12.17 The Hain Celestial Group Inc.
              • Exhibit 160: The Hain Celestial Group Inc. - Overview
              • Exhibit 161: The Hain Celestial Group Inc. - Business segments
              • Exhibit 162: The Hain Celestial Group Inc. - Key news
              • Exhibit 163: The Hain Celestial Group Inc. - Key offerings
              • Exhibit 164: The Hain Celestial Group Inc. - Segment focus

            13 Appendix

            • 13.1 Scope of the report
              • 13.2 Inclusions and exclusions checklist
                • Exhibit 165: Inclusions checklist
                • Exhibit 166: Exclusions checklist
              • 13.3 Currency conversion rates for US$
                • Exhibit 167: Currency conversion rates for US$
              • 13.4 Research methodology
                • Exhibit 168: Research methodology
                • Exhibit 169: Validation techniques employed for market sizing
                • Exhibit 170: Information sources
              • 13.5 List of abbreviations
                • Exhibit 171: List of abbreviations

              Research Methodology

              Technavio presents a detailed picture of the market by way of study, synthesis, and summation of data from multiple sources. The analysts have presented the various facets of the market with a particular focus on identifying the key industry influencers. The data thus presented is comprehensive, reliable, and the result of extensive research, both primary and secondary.

              INFORMATION SOURCES

              Primary sources

              • Manufacturers and suppliers
              • Channel partners
              • Industry experts
              • Strategic decision makers

              Secondary sources

              • Industry journals and periodicals
              • Government data
              • Financial reports of key industry players
              • Historical data
              • Press releases

              DATA ANALYSIS

              Data Synthesis

              • Collation of data
              • Estimation of key figures
              • Analysis of derived insights

              Data Validation

              • Triangulation with data models
              • Reference against proprietary databases
              • Corroboration with industry experts

              REPORT WRITING

              Qualitative

              • Market drivers
              • Market challenges
              • Market trends
              • Five forces analysis

              Quantitative

              • Market size and forecast
              • Market segmentation
              • Geographical insights
              • Competitive landscape

              Interested in this report?

              Get your sample now to see our research methodology and insights!

              Download Now

              Frequently Asked Questions

              Agave Syrup market growth will increase by $ 58.88 mn during 2024-2028 .

              The Agave Syrup market is expected to grow at a CAGR of 6.11% during 2024-2028 .

              Agave Syrup market is segmented by Application( Emulsifier, Flavor enhancer, Sweetener) Product Type( Conventional, Organic, North America, South America, Middle East and Africa)

              American Beverage Marketers, Archer Daniels Midland Co., Ciranda Inc., Dandy Lions Ltd., Dipasa USA Inc., Global Goods Inc., Histon Sweet Spreads Ltd., Madhava Ltd., Malt Products Corp., NOW Health Group Inc., Sisana Sweeteners EU BV, Tate and Lyle PLC, The Groovy Food Co., The Hain Celestial Group Inc., ASR Group International Inc., Best Ground International, Colibree Co, Naturalever de Mexico, Natures Agave Inc, The Tierra Group are a few of the key vendors in the Agave Syrup market.

              APAC will register the highest growth rate of 50% among the other regions. Therefore, the Agave Syrup market in APAC is expected to garner significant business opportunities for the vendors during the forecast period.

              US, China, Thailand, The Netherlands, France

              • Growing preference for natural sweetenersAgave syrup is a vegan sweetener that has become popular as a natural sweetener and has become a popular substitute for traditional sweeteners is the driving factor this market.
              • such as table sugar. Agave syrup is considered healthier than regular sugar or artificial sweeteners as they are derived from plant-based sources and consists of low calories. The increase in the prevalence of diabetes is the driving factor this market.
              • obesity is the driving factor this market.
              • blood pressure is the driving factor this market.
              • and other chronic diseases drives the demand for naturally derived sweeteners. Too much sugar in the diet can contribute to problems such as obesity is the driving factor this market.
              • diabetes is the driving factor this market.
              • and tooth decay. Two-thirds of the US population are either overweight or obese. Obesity is considered one of the preventable diseases and the major driver of healthcare costs in the US. People who drink sugar-sweetened beverages and consume diets of high-added sugar tend to promote the development of obesity and type-2 diabetes. Such factors are driving the popularity of agave syrup is the driving factor this market.
              • which is marked as a natural diabetic-friendly sweetener that does not spike blood sugar levels. The rising concerns regarding weight management and obesity surge the demand for agave syrup as a sweetener as it contains potentially fewer calories compared with traditional sugars is the driving factor this market.
              • aligning with weight management goals. Therefore is the driving factor this market.
              • the growing preference for natural sweetners drives the growth of the global agave syrup market during the forecast period. is the driving factor this market.

              The Agave Syrup market vendors should focus on grabbing business opportunities from the Emulsifier segment as it accounted for the largest market share in the base year.