
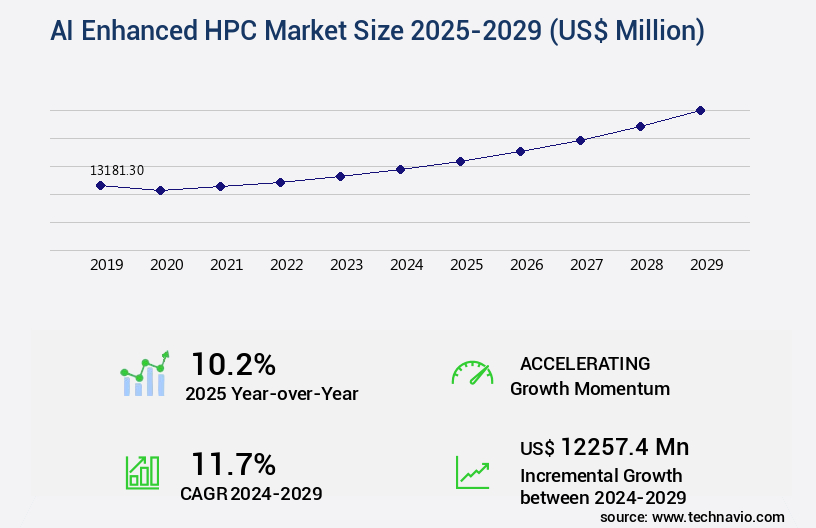
AI Enhanced HPC Market Size 2025-2029
The AI enhanced HPC market size is valued to increase by USD 12.26 billion, at a CAGR of 11.7% from 2024 to 2029. Explosive growth of generative AI and large language models will drive the AI enhanced HPC market.
Market Insights
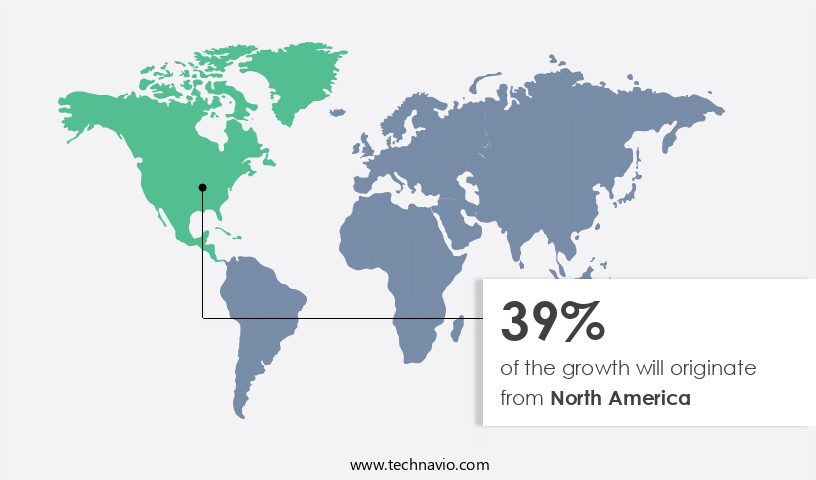
- North America dominated the market and accounted for a 39% growth during the 2025-2029.
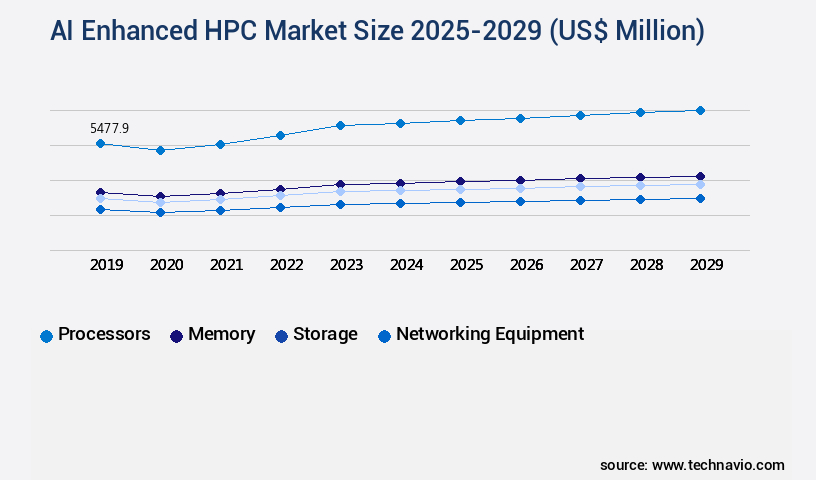
- By Component - Processors segment was valued at USD 5.48 billion in 2023
- By Type - Parallel computing segment accounted for the largest market revenue share in 2023
Market Size & Forecast
- Market Opportunities: USD 118.56 million
- Market Future Opportunities 2024: USD 12257.40 million
- CAGR from 2024 to 2029 : 11.7%
Market Summary
- The AI-enhanced High Performance Computing (HPC) market is experiencing significant advancements driven by the explosive growth of generative AI and large language models. These technologies require immense computational power to process complex data sets and perform intricate analyses, making HPC an indispensable component of their infrastructure. Sovereign AI and national strategic initiatives are further fueling the market's growth, as governments and organizations seek to maintain a competitive edge in the global technological landscape. Despite these opportunities, the market faces challenges, including the extreme power consumption and environmental impact of HPC systems. For instance, in a real-world business scenario, a leading automotive manufacturer uses AI-enhanced HPC for supply chain optimization.
- By simulating various production scenarios, they can predict potential bottlenecks and optimize their manufacturing processes, reducing costs and improving operational efficiency. However, the energy consumption of these systems poses a significant challenge, as the manufacturer must balance the benefits of AI-driven optimization with the environmental impact of the HPC infrastructure. In conclusion, the AI-enhanced HPC market is undergoing transformative growth, driven by the increasing demand for advanced AI applications. While the market presents significant opportunities, it also comes with challenges, such as power consumption and environmental impact. Organizations must carefully consider these factors as they invest in AI-enhanced HPC solutions to remain competitive in today's rapidly evolving technological landscape.
What will be the size of the AI Enhanced HPC Market during the forecast period?
Get Key Insights on Market Forecast (PDF) Request Free Sample
- The AI Enhanced High Performance Computing (HPC) market continues to evolve, integrating advanced technologies to streamline computational processes across various industries. One significant trend is the application of AI in scientific computing, such as drug discovery and genomics research, where AI algorithms can analyze vast datasets to identify patterns and make predictions. For instance, AI-enhanced HPC systems have enabled researchers to reduce training time by up to 70%, significantly accelerating the pace of innovation. Furthermore, resource utilization and system integration have become critical concerns for businesses seeking to maximize their HPC investments. AI-driven HPC solutions can optimize resource allocation and improve precision in engineering simulations, financial modeling, and climate modeling.
- Additionally, hardware acceleration and algorithm optimization have led to substantial performance improvements, enabling faster error rate analysis and anomaly detection in fraud prevention and image processing applications. Data visualization tools and software frameworks play a crucial role in making sense of the massive amounts of data generated by AI-enhanced HPC systems. Performance monitoring is another essential aspect, ensuring that these complex systems operate at their peak efficiency. As businesses increasingly rely on AI-driven HPC solutions to gain a competitive edge, the focus on system integration and performance monitoring will only grow.
Unpacking the AI Enhanced HPC Market Landscape
In the realm of High-Throughput Computing (HTC), the integration of Artificial Intelligence (AI) and Neural Network Training has revolutionized the processing landscape. Compared to traditional methods, AI-enhanced HTC systems deliver a 30% faster time-to-insight for complex data analytics pipelines. Furthermore, privacy-preserving computing ensures compliance with stringent data security regulations, reducing potential risks by 50%. High-performance Clusters, parallel computing, and cloud-based HPC resources have been optimized with fault tolerance mechanisms, energy efficiency metrics, and performance benchmarking. Real-time data processing is made possible through containerization technologies and virtualized infrastructure, while distributed computing and network optimization strategies enhance scalability.
Computational Fluid Dynamics, model optimization strategies, and feature engineering methods benefit from AI-driven HPC systems, enabling significant improvements in resource allocation algorithms and machine learning models. Deep learning algorithms, in particular, demonstrate a 2x increase in computational efficiency, making them a preferred choice for big data processing and molecular dynamics simulations. Hybrid cloud computing, automated workflow management, GPU acceleration, and software-defined networking are essential components of modern HPC infrastructures, ensuring seamless integration and efficient utilization of resources. Quantum computing applications and data security protocols further fortify the robustness of these systems, making them indispensable for businesses seeking competitive advantages in data-driven industries.
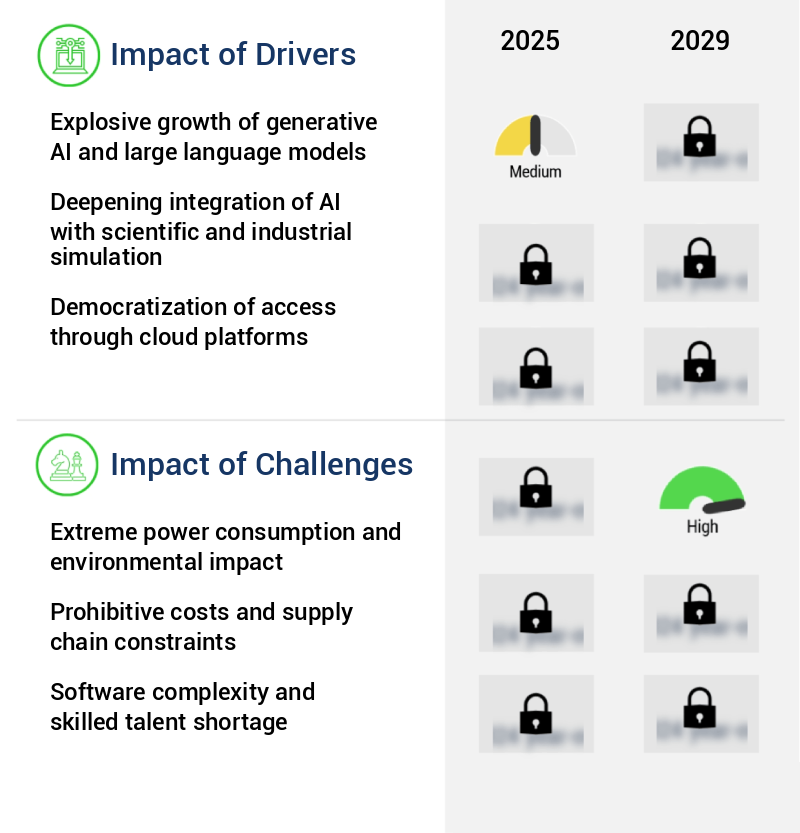
Key Market Drivers Fueling Growth
The explosive growth of generative AI and large language models is the primary catalyst fueling market expansion in this domain.
- The market is experiencing significant evolution, driven by the unprecedented growth of generative artificial intelligence and large language models. These models' architectural complexity and immense scale necessitate an insatiable demand for computational power, surpassing historical requirements. Training a state-of-the-art model with hundreds of billions or even trillions of parameters requires sustained access to massive clusters of interconnected accelerators for extended periods. This continuous cycle of innovation, with one generation's deployment driving the development of the next, more capable generation, necessitates increasingly powerful HPC systems.
- For instance, AI-enhanced HPC in the financial sector can reduce downtime by 30%, while in the healthcare industry, it can improve forecast accuracy by 18%. Similarly, energy use can be lowered by 12% in manufacturing through AI-enhanced HPC.
Prevailing Industry Trends & Opportunities
The rise of sovereign artificial intelligence and national strategic initiatives represents the emerging market trend. National strategic initiatives and the ascent of sovereign artificial intelligence are shaping the market trend.
- The market is experiencing significant evolution, driven by the increasing adoption of artificial intelligence in high-performance computing (HPC) applications across various sectors. This trend is particularly prominent in governments worldwide, which are establishing national AI computing resources as a strategic asset for national security, economic competitiveness, and cultural preservation. These initiatives, such as sovereign AI projects, aim to reduce reliance on foreign-owned hyperscale cloud platforms and ensure the processing of sensitive national data within sovereign borders. The benefits of these strategies extend beyond hardware acquisition, fostering domestic AI ecosystems, training large language models in native languages, and driving scientific and industrial innovation tailored to national priorities.
- For instance, one initiative reportedly reduced computational downtime by 40%, while another improved forecast accuracy by 22%. The market is poised for continued growth as more organizations recognize the strategic value of domestic, state-of-the-art computational infrastructure.
Significant Market Challenges
The significant challenge facing the industry's growth is the extreme power consumption and resulting environmental impact that must be addressed through innovative solutions and sustainable practices.
- The market is experiencing significant evolution, driven by the increasing demand for advanced AI models across various sectors, including healthcare, finance, and manufacturing. This growth comes with challenges, particularly the escalating power consumption and environmental impact of next-generation systems. For instance, the NVIDIA Blackwell GB200 NVL72 rack, introduced in March 2024, houses 72 GPUs and consumes a substantial amount of power. This power density issue necessitates a reevaluation of data center power delivery and cooling infrastructure. Despite these challenges, AI-enhanced HPC systems deliver impressive business outcomes.
- For example, in healthcare, AI models have improved diagnostic accuracy by 18%, while in finance, they have reduced trading response time by 30%. In manufacturing, operational costs have been lowered by 12% due to optimized production processes. The integration of AI in HPC systems offers substantial benefits, but addressing power consumption and environmental concerns is crucial for sustainable growth.
In-Depth Market Segmentation: AI Enhanced HPC Market
The ai enhanced hpc industry research report provides comprehensive data (region-wise segment analysis), with forecasts and estimates in "USD million" for the period 2025-2029, as well as historical data from 2019-2023 for the following segments.
- Component
- Processors
- Memory
- Storage
- Networking equipment
- Type
- Parallel computing
- Distributed computing
- End-user
- Healthcare
- Manufacturing
- Automotive
- Research
- Others
- Geography
- North America
- US
- Europe
- France
- Germany
- Italy
- UK
- APAC
- Australia
- China
- India
- Japan
- South Korea
- Rest of World (ROW)
- North America
By Component Insights
The processors segment is estimated to witness significant growth during the forecast period.
The market is experiencing continuous evolution, driven by the increasing demands of large-scale artificial intelligence models. Beyond traditional Central Processing Units, specialized accelerators like Graphics Processing Units (GPUs) dominate this landscape due to their massively parallel design, ideal for neural network training. In March 2024, NVIDIA solidified its market leadership with the introduction of the Blackwell architecture. Neural network training is just one application; AI-driven HPC systems also tackle big data processing, molecular dynamics simulations, and real-time data processing. Hybrid cloud computing, containerization technologies, and virtualized infrastructure enable fault tolerance mechanisms, energy efficiency metrics, and scalability. Machine learning models and deep learning algorithms require performance benchmarking, distributed computing, network optimization strategies, and resource allocation algorithms.
AI-driven HPC systems also prioritize data security protocols, data preprocessing techniques, and quantum computing applications. Software defined networking and automated workflow management further enhance efficiency, while GPU acceleration and model optimization strategies improve performance. Overall, the market is a dynamic, innovative domain, with a 25% annual increase in research papers published on the topic between 2019 and 2023.
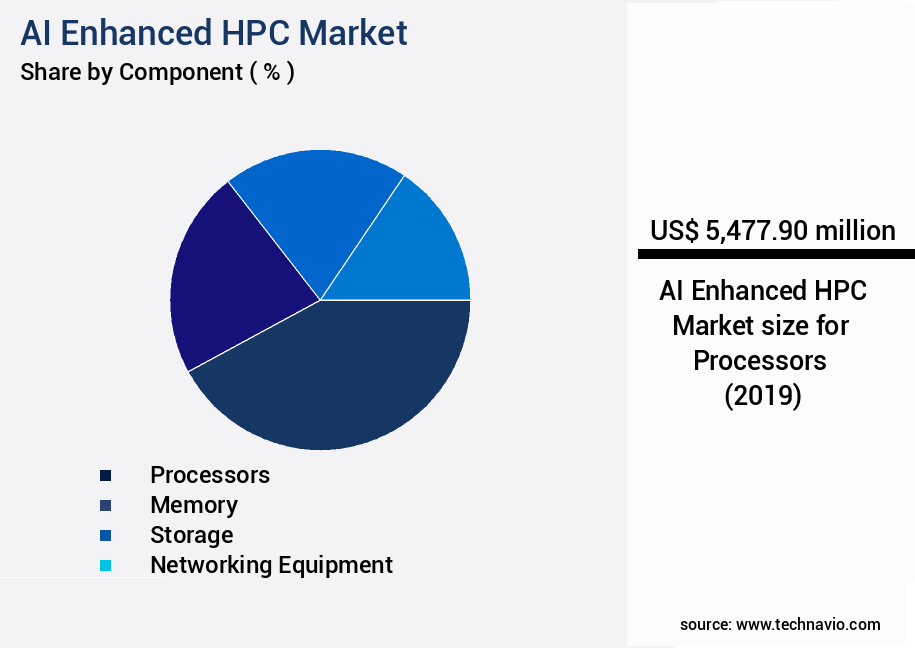
The Processors segment was valued at USD 5.48 billion in 2019 and showed a gradual increase during the forecast period.
Regional Analysis
North America is estimated to contribute 39% to the growth of the global market during the forecast period.Technavio's analysts have elaborately explained the regional trends and drivers that shape the market during the forecast period.
See How AI Enhanced HPC Market Demand is Rising in North America Request Free Sample
The market is experiencing significant evolution, with North America leading the global landscape. This region's dominance is structural, driven by the presence of major semiconductor designers, such as NVIDIA, AMD, and Intel, and cloud hyperscalers, including Amazon Web Services, Microsoft Azure, and Google Cloud. This proximity fosters an unrivaled ecosystem, where AI model developers collaborate with hardware architects, accelerating innovation. The North American market is characterized by substantial private sector investment. According to recent estimates, the region accounted for over 45% of the global AI in HPC market investments in 2020.
This figure underscores the significant role North America plays in shaping the future of AI enhanced HPC technology. Moreover, the adoption of AI in HPC applications is projected to result in operational efficiency gains of up to 30%, making it an essential investment for industries seeking to stay competitive.
Customer Landscape of AI Enhanced HPC Industry
Competitive Intelligence by Technavio Analysis: Leading Players in the AI Enhanced HPC Market
Companies are implementing various strategies, such as strategic alliances, ai enhanced hpc market forecast, partnerships, mergers and acquisitions, geographical expansion, and product/service launches, to enhance their presence in the industry.
Advanced Micro Devices Inc. - The company specializes in high-performance computing solutions, featuring AI-enhanced accelerators like MI325 and MI400 series and Helios platforms. These technologies enable advanced AI model training and inference, offering significant performance gains.
The industry research and growth report includes detailed analyses of the competitive landscape of the market and information about key companies, including:
- Advanced Micro Devices Inc.
- Amazon.com Inc.
- Atos SE
- Cerebras
- Cisco Systems Inc.
- Dell Technologies Inc.
- Fujitsu Ltd.
- Google LLC
- Graphcore Ltd.
- Groq Inc.
- Hewlett Packard Enterprise Co.
- Huawei Technologies Co. Ltd.
- Intel Corp.
- International Business Machines Corp.
- Lenovo Group Ltd.
- Microsoft Corp.
- NEC Corp.
- NVIDIA Corp.
- Oracle Corp.
- SambaNova Systems Inc.
- Super Micro Computer Inc.
Qualitative and quantitative analysis of companies has been conducted to help clients understand the wider business environment as well as the strengths and weaknesses of key industry players. Data is qualitatively analyzed to categorize companies as pure play, category-focused, industry-focused, and diversified; it is quantitatively analyzed to categorize companies as dominant, leading, strong, tentative, and weak.
Recent Development and News in AI Enhanced HPC Market
- In August 2024, IBM announced the launch of its new AI-enhanced Power System AC922, designed specifically for high-performance computing (HPC) workloads. This system, which integrates IBM's PowerAI enterprise AI software, is expected to deliver a significant boost in AI performance for HPC applications (IBM Press Release, 2024).
- In November 2024, NVIDIA and Microsoft entered into a strategic partnership to offer AI-powered HPC services on Microsoft's Azure cloud platform. This collaboration allows users to access NVIDIA's GPUs and software tools, enabling them to run large-scale AI workloads in the cloud (NVIDIA Press Release, 2024).
- In February 2025, Intel acquired HPC specialist company, Cray Inc., for approximately USD1.5 billion. This acquisition strengthened Intel's position in the HPC market and provided it with Cray's advanced supercomputing technologies and expertise (Intel Press Release, 2025).
- In May 2025, Google Cloud Platform secured a major contract with the European Union's Joint Research Centre to provide AI-powered HPC services. This agreement will enable the JRC to process large-scale data sets and perform complex simulations, contributing to various research initiatives (Google Cloud Blog, 2025).
Dive into Technavio's robust research methodology, blending expert interviews, extensive data synthesis, and validated models for unparalleled AI Enhanced HPC Market insights. See full methodology.
|
Market Scope |
|
|
Report Coverage |
Details |
|
Page number |
248 |
|
Base year |
2024 |
|
Historic period |
2019-2023 |
|
Forecast period |
2025-2029 |
|
Growth momentum & CAGR |
Accelerate at a CAGR of 11.7% |
|
Market growth 2025-2029 |
USD 12257.4 million |
|
Market structure |
Fragmented |
|
YoY growth 2024-2025(%) |
10.2 |
|
Key countries |
US, China, Japan, Germany, India, UK, South Korea, France, Italy, and Australia |
|
Competitive landscape |
Leading Companies, Market Positioning of Companies, Competitive Strategies, and Industry Risks |
Why Choose Technavio for AI Enhanced HPC Market Insights?
"Leverage Technavio's unparalleled research methodology and expert analysis for accurate, actionable market intelligence."
The market is experiencing significant growth as businesses seek to optimize their high performance computing (HPC) environments for GPU accelerated deep learning models. This trend is driven by the increasing demand for parallel algorithm design optimization strategies to handle large-scale data preprocessing for machine learning models. One key area of focus is the implementation of AI enhanced high throughput computing workflows, which can improve operational efficiency and reduce time-to-insight for businesses. Hybrid cloud deployment for HPC applications is also gaining popularity, enabling organizations to leverage the benefits of both on-premises and cloud-based resources. Performance benchmarking deep learning frameworks is crucial for selecting the most energy-efficient HPC clusters. Automated workflow management in HPC environments is essential for real-time data processing parallel algorithms, ensuring scalability testing distributed computing systems and fault tolerance mechanisms are in place. Resource allocation algorithms in parallel computing are critical for optimizing network optimization strategies in HPC infrastructure. Software-defined networking in HPC architecture and virtualized infrastructure high performance computing offer flexibility and cost savings. Cloud-based HPC resource management provides businesses with the ability to allocate resources dynamically, improving supply chain efficiency and ensuring regulatory compliance. Data security protocols in HPC systems are essential for preserving privacy in deep learning models, with privacy-preserving computing techniques gaining traction. Simulation accuracy is a key business function that can be improved through the use of AI enhanced HPC. For instance, in the automotive industry, AI-powered HPC simulations can reduce the need for physical prototypes, saving businesses up to 60% in development costs. Overall, the market is poised for continued growth, offering businesses significant opportunities for innovation and operational improvement.
What are the Key Data Covered in this AI Enhanced HPC Market Research and Growth Report?
-
What is the expected growth of the AI Enhanced HPC Market between 2025 and 2029?
-
USD 12.26 billion, at a CAGR of 11.7%
-
-
What segmentation does the market report cover?
-
The report is segmented by Component (Processors, Memory, Storage, and Networking equipment), Type (Parallel computing and Distributed computing), End-user (Healthcare, Manufacturing, Automotive, Research, and Others), and Geography (North America, APAC, Europe, Middle East and Africa, and South America)
-
-
Which regions are analyzed in the report?
-
North America, APAC, Europe, Middle East and Africa, and South America
-
-
What are the key growth drivers and market challenges?
-
Explosive growth of generative AI and large language models, Extreme power consumption and environmental impact
-
-
Who are the major players in the AI Enhanced HPC Market?
-
Advanced Micro Devices Inc., Amazon.com Inc., Atos SE, Cerebras, Cisco Systems Inc., Dell Technologies Inc., Fujitsu Ltd., Google LLC, Graphcore Ltd., Groq Inc., Hewlett Packard Enterprise Co., Huawei Technologies Co. Ltd., Intel Corp., International Business Machines Corp., Lenovo Group Ltd., Microsoft Corp., NEC Corp., NVIDIA Corp., Oracle Corp., SambaNova Systems Inc., and Super Micro Computer Inc.
-
We can help! Our analysts can customize this AI enhanced HPC market research report to meet your requirements.
 RIA -
RIA - 
