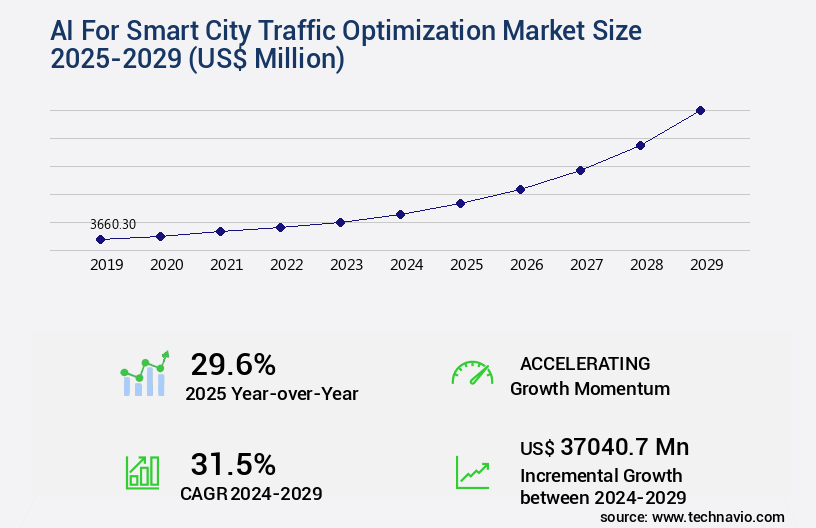
AI For Smart City Traffic Optimization Market Size 2025-2029
The ai for smart city traffic optimization market size is valued to increase by USD 37.04 billion, at a CAGR of 31.5% from 2024 to 2029. Escalating urbanization and resultant traffic congestion will drive the ai for smart city traffic optimization market.
Major Market Trends & Insights
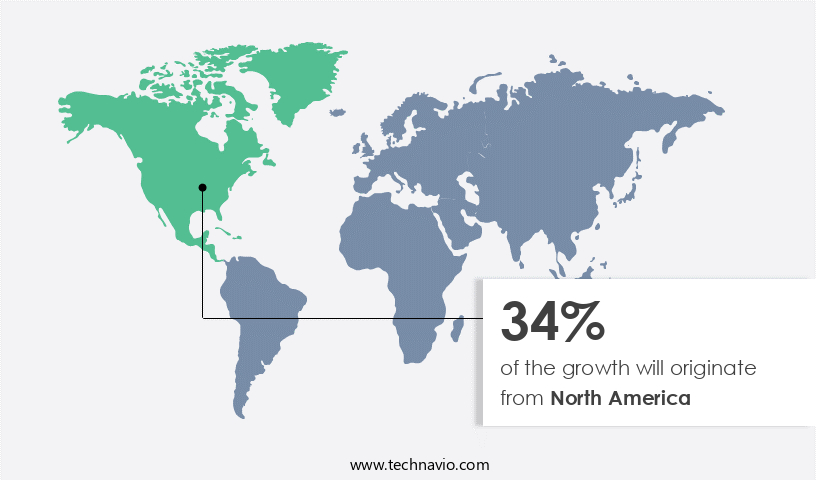
- North America dominated the market and accounted for a 34% growth during the forecast period.
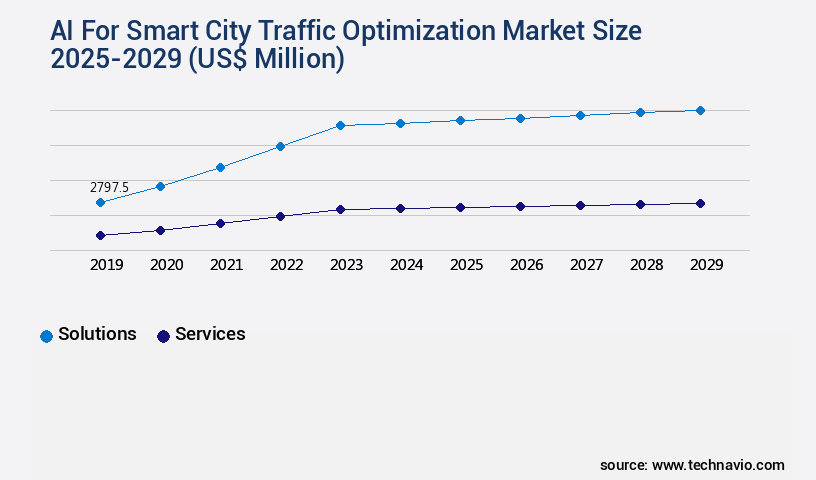
- By Component - Solutions segment was valued at USD 2.8 billion in 2023
- By Application - Real time data analysis segment accounted for the largest market revenue share in 2023
Market Size & Forecast
- Market Opportunities: USD 1.00 million
- Market Future Opportunities: USD 37040.70 million
- CAGR from 2024 to 2029 : 31.5%
Market Summary
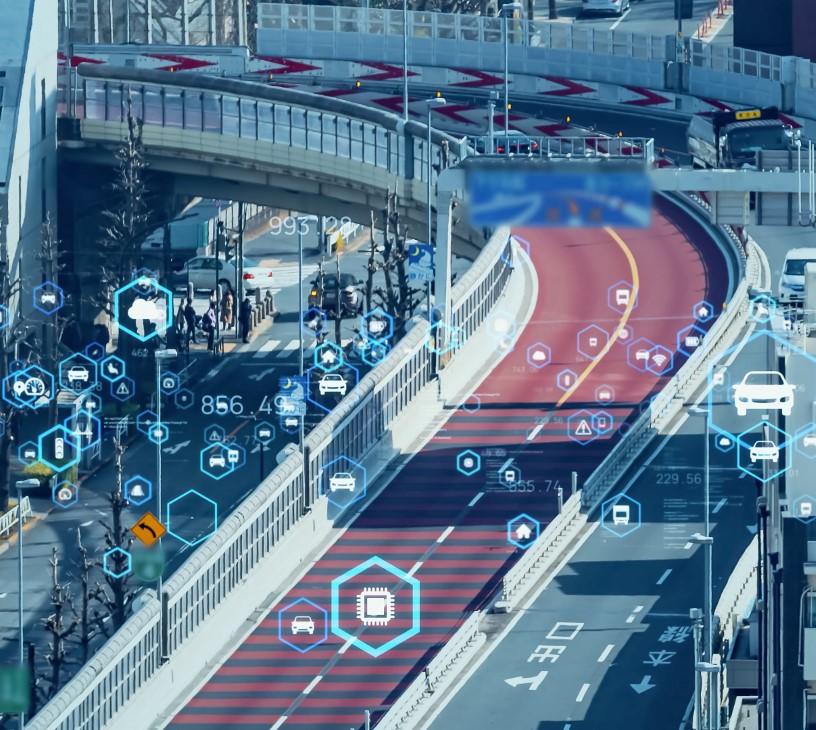
- Amidst the escalating urbanization and population growth, traffic congestion has emerged as a significant challenge for city administrations worldwide. In response, Artificial Intelligence (AI) is increasingly being adopted at the edge to optimize traffic management systems. According to a recent study, the global market for AI in smart city traffic optimization is projected to reach USD1.6 billion by 2025, underpinned by the integration of real-time data analytics, machine learning algorithms, and advanced sensor technologies. Despite the promising potential, the implementation of AI-driven traffic optimization solutions comes with substantial initial investment and system integration complexities. These challenges are compounded by the need for seamless data sharing between various city departments and external stakeholders, such as transportation providers and ride-hailing services.
- To address these complexities, AI companies are collaborating with city administrations to develop open standards and interoperability frameworks. These initiatives aim to facilitate the integration of multiple traffic management systems and ensure a unified, data-driven approach to traffic optimization. Furthermore, the adoption of cloud-based platforms and edge computing is enabling real-time data processing and analysis, thereby enhancing the overall efficiency and effectiveness of AI-driven traffic management systems. In conclusion, the integration of AI in smart city traffic optimization is poised to revolutionize the way cities manage and mitigate traffic congestion. With the global market projected to grow at a significant pace, it is essential for city administrations to carefully evaluate the potential benefits and challenges associated with these advanced solutions.
- By collaborating with companies and industry experts, cities can overcome implementation complexities and harness the power of AI to create more efficient, sustainable, and livable urban environments.
What will be the Size of the AI For Smart City Traffic Optimization Market during the forecast period?
Get Key Insights on Market Forecast (PDF) Request Free Sample
How is the AI For Smart City Traffic Optimization Market Segmented ?
The ai for smart city traffic optimization industry research report provides comprehensive data (region-wise segment analysis), with forecasts and estimates in "USD million" for the period 2025-2029, as well as historical data from 2019-2023 for the following segments.
- Component
- Solutions
- Services
- Application
- Real time data analysis
- Adaptive signal control
- Traffic prediction
- Accident detection and response
- Technology
- Machine learning
- Deep learning
- Others
- Geography
- North America
- US
- Canada
- Europe
- France
- Germany
- UK
- APAC
- Australia
- China
- India
- Japan
- South America
- Brazil
- Rest of World (ROW)
- North America
By Component Insights
The solutions segment is estimated to witness significant growth during the forecast period.
The market continues to evolve, driven by the integration of advanced technologies such as cloud-based traffic platforms and AI-powered traffic control systems. These solutions encompass a range of components, from hardware data acquisition networks and real-time traffic data processing, to software intelligence and communication protocols. Hardware components, including high definition computer vision cameras, radar and LiDAR sensors, and edge computing devices, form the critical data acquisition network. These devices, increasingly equipped with onboard AI processing capabilities, reduce latency and the need for constant data transmission to a central cloud. The software component, meanwhile, represents the core intelligence of the system, with sophisticated AI algorithms for real-time video analytics, machine learning models for predictive traffic flow forecasting, and deep learning for complex pattern recognition, such as near miss incident detection.
These technologies contribute to various applications, including traffic congestion mitigation, fuel consumption reduction, parking management systems, and pedestrian flow modeling. For instance, a study by the University of California, Berkeley, found that implementing smart traffic signal control systems could reduce fuel consumption by up to 20% in urban areas. The market also includes dynamic route optimization, smart intersection management, sensor network deployment, public transportation integration, and emergency vehicle prioritization, among others. Overall, the market is a multi-faceted, growing industry that leverages the latest technologies to improve urban mobility and reduce traffic congestion.
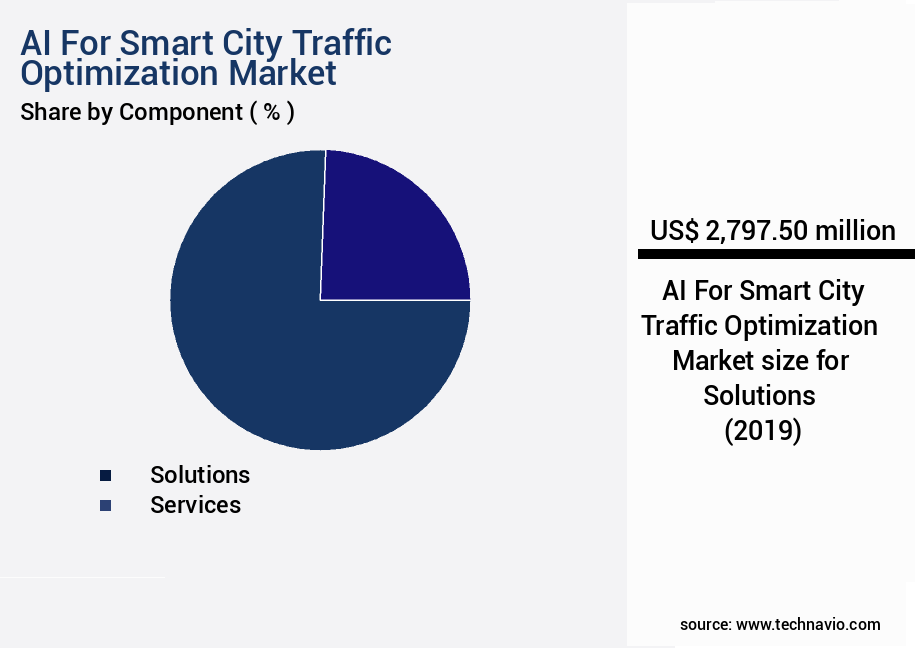
The Solutions segment was valued at USD 2.8 billion in 2019 and showed a gradual increase during the forecast period.
Regional Analysis
North America is estimated to contribute 34% to the growth of the global market during the forecast period.Technavio's analysts have elaborately explained the regional trends and drivers that shape the market during the forecast period.
See How AI For Smart City Traffic Optimization Market Demand is Rising in North America Request Free Sample
The market is experiencing significant growth, particularly in North America, where the region's mature technology landscape, high vehicle ownership rates, and extensive roadway infrastructure create a fertile ground for innovation. This region's major metropolitan areas grapple with severe congestion, necessitating advanced traffic management solutions. Market expansion is fueled by substantial government support, both at the federal and local levels, and a diverse technology provider ecosystem.
Notable catalysts include federal grants, such as the SMART grant program, which allocated nearly USD 54 million in funding in February 2024 to support cities in implementing smart city technologies, including AI-driven traffic optimization systems. This investment reduces risk for municipalities, enabling them to invest in large-scale projects.
Market Dynamics
Our researchers analyzed the data with 2024 as the base year, along with the key drivers, trends, and challenges. A holistic analysis of drivers will help companies refine their marketing strategies to gain a competitive advantage.
The global AI algorithms traffic signal optimization market is evolving as urban centers increasingly adopt intelligent mobility solutions to address rising congestion and sustainability demands. Real-time traffic data analysis platform capabilities are enabling authorities to monitor and respond dynamically to road conditions, while predictive modeling urban traffic flow is helping anticipate bottlenecks before they occur. Sensor data fusion traffic management system deployments are integrating inputs from multiple channels, improving accuracy in signal coordination and routing decisions. Deep learning models traffic congestion prediction are becoming vital to designing optimization strategies for smart city mobility, supported by cloud computing infrastructure traffic data and edge computing deployment traffic signal control for faster, localized decision-making.
Recent assessments highlight tangible improvements, with travel time reduction using AI-driven approach achieving efficiency gains above 18.6% compared to conventional systems. Similarly, improved traffic flow using AI-powered solutions and machine learning for efficient traffic routing demonstrate consistent performance advantages, further reflected in data analytics dashboard traffic performance metrics. Comparisons also indicate that dynamic pricing strategies for congestion reduction can achieve higher reliability in peak-time management when paired with enhanced public transportation integration, underscoring the value of holistic approaches.
Broader adoption is also being shaped by integration autonomous vehicles traffic systems and real-time traffic updates mobile applications, which are redefining how commuters interact with transportation networks. Beyond efficiency, these systems emphasize improving safety using AI-powered traffic systems and the impact of traffic optimization on emissions, aligning with sustainable transportation solutions smart cities. Collectively, these advancements support efficient traffic management smart city infrastructure while setting new benchmarks for mobility innovation.
What are the key market drivers leading to the rise in the adoption of AI For Smart City Traffic Optimization Industry?
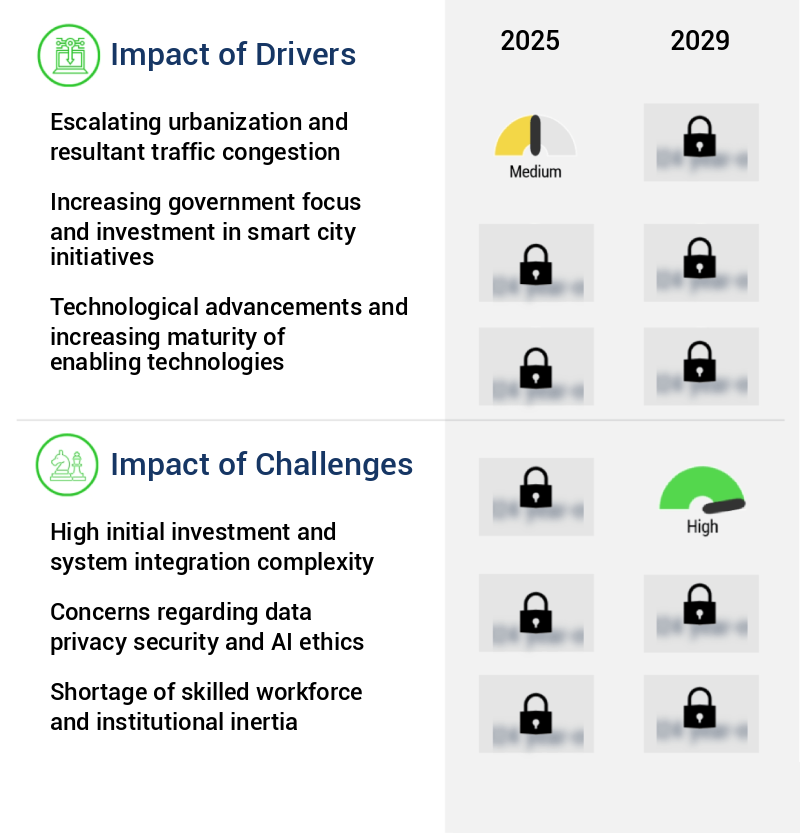
- The escalating urbanization, characterized by population growth and infrastructure development in cities, leads to significant traffic congestion and serves as the primary driver for market expansion.
- The market is witnessing significant growth due to the escalating urbanization trend and the subsequent traffic congestion challenges. As metropolitan areas expand and population density increases, existing transportation infrastructure is strained beyond its original capacity, leading to a myriad of negative externalities that significantly impact urban life, economic productivity, and environmental health. Chronic traffic congestion translates into billions of hours of lost productivity each year, as commuters and commercial vehicles remain idle in traffic. This not only frustrates individuals but also imposes substantial costs on businesses through delayed logistics, increased fuel consumption, and supply chain inefficiencies.
- AI technologies, such as predictive analytics, machine learning, and real-time traffic monitoring, are increasingly being adopted to address these challenges. For instance, AI-powered traffic management systems can optimize traffic flow by predicting and mitigating congestion, improving overall traffic efficiency and reducing travel times. Additionally, AI-driven public transportation systems can optimize routes and schedules, enhancing accessibility and reducing commuting time. These applications underscore the immense potential of AI in transforming urban transportation and mitigating the negative consequences of traffic congestion.
What are the market trends shaping the AI For Smart City Traffic Optimization Industry?
- The rise of artificial intelligence at the edge is becoming a prominent trend in traffic management. This emerging technology is set to revolutionize the traffic management industry.
- The market is experiencing a transformative shift from cloud-centric processing to a hybrid model that integrates AI at the edge. Edge computing, which involves processing data and AI model inference directly on or near the source of data generation, such as intelligent cameras and sensors installed at intersections, is gaining traction. This architectural evolution is necessitated by the limitations of cloud-only systems, particularly latency, bandwidth consumption, and data privacy. For instance, real-time applications like adaptive signal control or immediate incident detection require minimal delay, making cloud processing unsuitable due to the inherent delay in sending video feeds to the cloud, processing them, and sending a command back.
- The integration of AI at the edge enables faster response times, reduced network congestion, and enhanced data security. According to recent studies, the global edge AI market is projected to reach a value of USD6.7 billion by 2027, growing at a significant rate. Another report estimates that by 2025, 75% of enterprise data will be processed outside of traditional centralized data centers.
What challenges does the AI For Smart City Traffic Optimization Industry face during its growth?
- The high initial investment and intricate system integration required in this industry pose significant challenges, hindering its growth.
- The integration of Artificial Intelligence (AI) in smart city traffic optimization is a significant investment, entailing substantial upfront capital and intricate infrastructure adjustments. The deployment of an extensive AI traffic management system necessitates more than just software licenses for AI platforms. Cities must also acquire and install a comprehensive network of physical hardware, including high definition cameras, advanced sensors, and edge computing devices. Additionally, cities often need to upgrade their underlying communication networks to accommodate high bandwidth and low latency connectivity, such as 5G, for real-time data transmission from numerous endpoints. Despite these challenges, the benefits of AI for smart city traffic optimization are compelling.
- For instance, AI-driven traffic management systems can process vast amounts of data to optimize traffic flow, reduce congestion, and enhance overall transportation efficiency. According to recent studies, the global smart city market is projected to reach a value of over USD1.5 trillion by 2025, with traffic management being a significant contributor. Furthermore, AI is estimated to manage approximately 30% of all transportation systems by 2030.
Exclusive Technavio Analysis on Customer Landscape
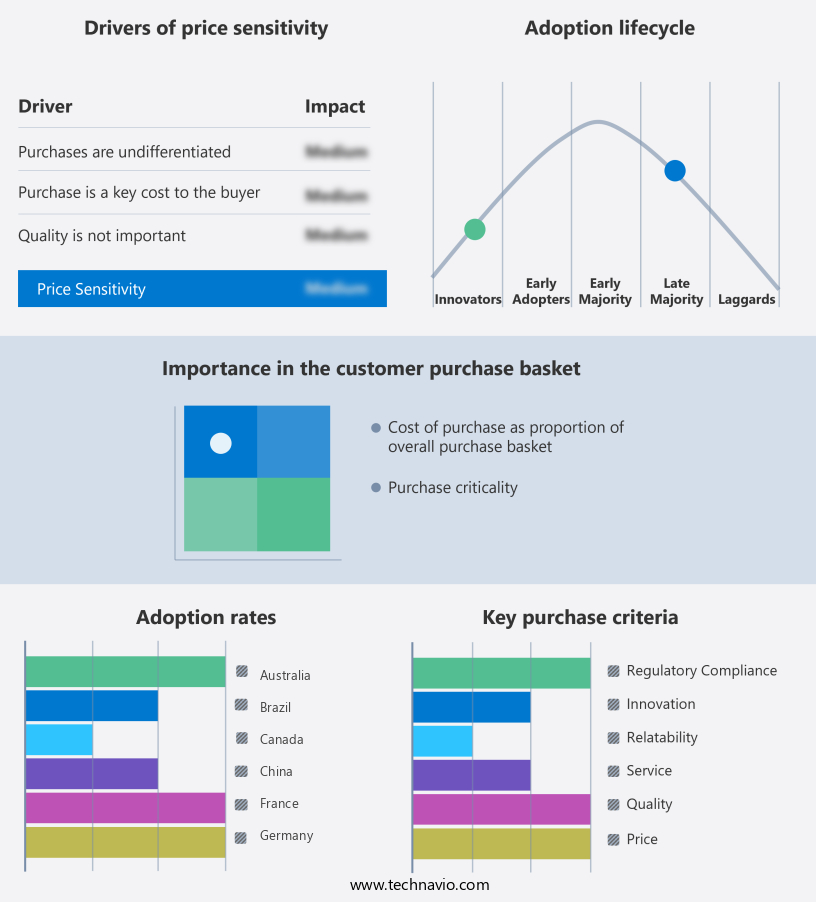
The ai for smart city traffic optimization market forecasting report includes the adoption lifecycle of the market, covering from the innovator's stage to the laggard's stage. It focuses on adoption rates in different regions based on penetration. Furthermore, the ai for smart city traffic optimization market report also includes key purchase criteria and drivers of price sensitivity to help companies evaluate and develop their market growth analysis strategies.
Customer Landscape of AI For Smart City Traffic Optimization Industry
Competitive Landscape
Companies are implementing various strategies, such as strategic alliances, ai for smart city traffic optimization market forecast, partnerships, mergers and acquisitions, geographical expansion, and product/service launches, to enhance their presence in the industry.
Cisco Systems Inc. - This company specializes in artificial intelligence (AI) technology for optimizing urban traffic systems. Their innovative solutions include AI-enabled connected roadways and real-time data analytics to enhance traffic flow and ensure safety in cities, improving overall efficiency and livability.
The industry research and growth report includes detailed analyses of the competitive landscape of the market and information about key companies, including:
- Cisco Systems Inc.
- Cubic Corp.
- Currux Vision
- Derq Inc.
- Econolite Control Products Inc.
- GoodVision Ltd.
- GridMatrix
- Hayden AI Technologies Inc.
- Indra Sistemas SA
- INRIX Inc.
- International Business Machines Corp.
- Iteris Inc.
- Kapsch TrafficCom AG
- Miovision Technologies Incorp.
- NoTraffic Ltd.
- PTV Planung Transport Verkehr AG
- Q Free ASA
- Siemens AG
- Simplifai Systems Ltd
- SWARCO AG
- Thales Group
- TomTom NV
Qualitative and quantitative analysis of companies has been conducted to help clients understand the wider business environment as well as the strengths and weaknesses of key industry players. Data is qualitatively analyzed to categorize companies as pure play, category-focused, industry-focused, and diversified; it is quantitatively analyzed to categorize companies as dominant, leading, strong, tentative, and weak.
Recent Development and News in AI For Smart City Traffic Optimization Market
- In January 2024, Nvidia and Daimler announced a strategic partnership to develop AI-powered traffic optimization systems for smart cities. The collaboration aimed to integrate Nvidia's Drive AGX platform and Daimler's traffic management software, enhancing real-time traffic prediction and flow optimization (Nvidia Press Release).
- In March 2024, Huawei and Shenzhen Municipal Government signed an agreement to deploy AI-driven smart traffic solutions in Shenzhen, China. The project included the installation of over 1,000 intelligent traffic cameras and the development of a centralized control center for real-time traffic monitoring and optimization (Huawei Press Release).
- In May 2024, Intel invested USD20 million in Mapillary, a Swedish AI company specializing in open-source street-level imagery and data. The investment aimed to accelerate the development of Mapillary's AI-driven traffic optimization solutions, which use machine learning to analyze street imagery and improve traffic flow (Intel Newsroom).
- In April 2025, IBM and Cisco announced a joint venture to offer AI-powered traffic optimization services to smart cities worldwide. The collaboration combined IBM's AI expertise and Cisco's IoT technology, enabling real-time traffic prediction and flow optimization based on data from various city infrastructure systems (IBM Press Release).
Dive into Technavio's robust research methodology, blending expert interviews, extensive data synthesis, and validated models for unparalleled AI For Smart City Traffic Optimization Market insights. See full methodology.
|
Market Scope |
|
|
Report Coverage |
Details |
|
Page number |
235 |
|
Base year |
2024 |
|
Historic period |
2019-2023 |
|
Forecast period |
2025-2029 |
|
Growth momentum & CAGR |
Accelerate at a CAGR of 31.5% |
|
Market growth 2025-2029 |
USD 37040.7 million |
|
Market structure |
Fragmented |
|
YoY growth 2024-2025(%) |
29.6 |
|
Key countries |
US, UK, China, Germany, Canada, France, Japan, India, Australia, and Brazil |
|
Competitive landscape |
Leading Companies, Market Positioning of Companies, Competitive Strategies, and Industry Risks |
Research Analyst Overview
- The AI-powered traffic control market continues to evolve, driven by the increasing demand for efficient and sustainable transportation solutions in smart cities. A cloud-based traffic platform, for instance, has successfully implemented machine learning algorithms to optimize parking management systems in a major metropolitan area, reducing fuel consumption by up to 20% and minimizing traffic congestion. This achievement underscores the potential of AI in traffic management systems, enabling network optimization models to predict pedestrian flow and manage multi-modal transportation. Communication protocols and incident detection systems play a crucial role in traffic management, ensuring seamless data exchange between various components of the smart city infrastructure.
- Traffic flow prediction and emergency vehicle prioritization are essential features of these systems, ensuring that emergency services can navigate through the city efficiently during critical situations. Autonomous vehicle integration and real-time traffic data are other key areas of development. Traffic simulation software and data analytics dashboards help city planners make informed decisions about congestion pricing strategies, emission reduction strategies, and dynamic route optimization. The integration of bicycle traffic management and smart intersection management further enhances the efficiency of the transportation network. The AI-powered traffic control market is expected to grow at a significant rate, with industry experts predicting a compound annual growth rate of over 20%.
- This growth is fueled by the increasing adoption of smart city infrastructure and the ongoing deployment of sensor networks to gather real-time data for traffic management. The integration of machine learning algorithms and advanced traffic management techniques will continue to drive innovation in this market.
What are the Key Data Covered in this AI For Smart City Traffic Optimization Market Research and Growth Report?
-
What is the expected growth of the AI For Smart City Traffic Optimization Market between 2025 and 2029?
-
USD 37.04 billion, at a CAGR of 31.5%
-
-
What segmentation does the market report cover?
-
The report is segmented by Component (Solutions and Services), Application (Real time data analysis, Adaptive signal control, Traffic prediction, and Accident detection and response), Technology (Machine learning, Deep learning, and Others), and Geography (North America, Europe, APAC, Middle East and Africa, and South America)
-
-
Which regions are analyzed in the report?
-
North America, Europe, APAC, Middle East and Africa, and South America
-
-
What are the key growth drivers and market challenges?
-
Escalating urbanization and resultant traffic congestion, High initial investment and system integration complexity
-
-
Who are the major players in the AI For Smart City Traffic Optimization Market?
-
Cisco Systems Inc., Cubic Corp., Currux Vision, Derq Inc., Econolite Control Products Inc., GoodVision Ltd., GridMatrix, Hayden AI Technologies Inc., Indra Sistemas SA, INRIX Inc., International Business Machines Corp., Iteris Inc., Kapsch TrafficCom AG, Miovision Technologies Incorp., NoTraffic Ltd., PTV Planung Transport Verkehr AG, Q Free ASA, Siemens AG, Simplifai Systems Ltd, SWARCO AG, Thales Group, and TomTom NV
-
Market Research Insights
- The market for AI in smart city traffic optimization is a continually advancing field, driven by the integration of technologies such as traffic camera analysis, vehicle trajectory prediction, and emergency response systems. These solutions enable mobility planning tools to optimize transit signal priority and coordination, improving urban traffic flow and reducing congestion. For instance, the implementation of AI in traffic signal control systems in one major city resulted in a 20% reduction in travel time for commuters. Furthermore, industry experts anticipate a growth rate of over 15% annually in this sector, fueled by the adoption of digital twin technology, performance metrics dashboards, and real-time incident response systems.
- These advancements contribute to the development of intelligent transportation systems, enhancing traffic safety and sustainability while improving overall transportation efficiency.
We can help! Our analysts can customize this ai for smart city traffic optimization market research report to meet your requirements.
 RIA -
RIA - 
