AI In Appliances And Electronics Market Size 2025-2029
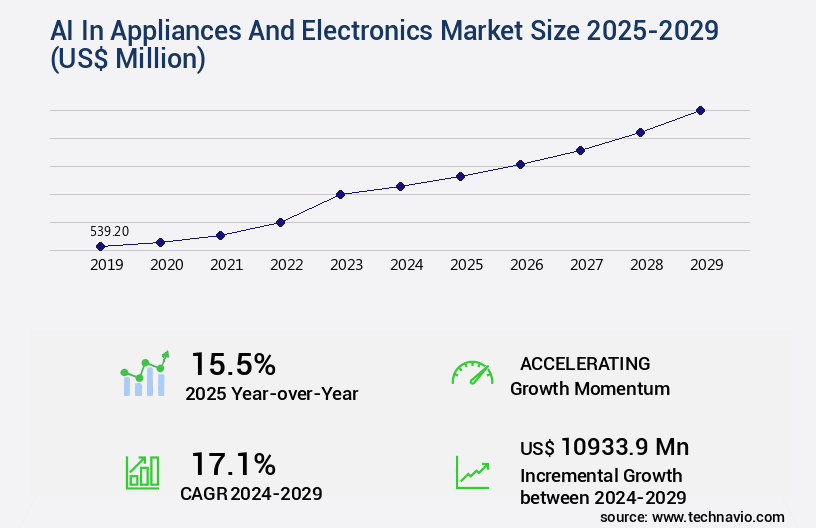
The ai in appliances and electronics market size is valued to increase by USD 10.93 billion, at a CAGR of 17.1% from 2024 to 2029. Surging consumer demand for enhanced convenience and personalization will drive the ai in appliances and electronics market.
Major Market Trends & Insights
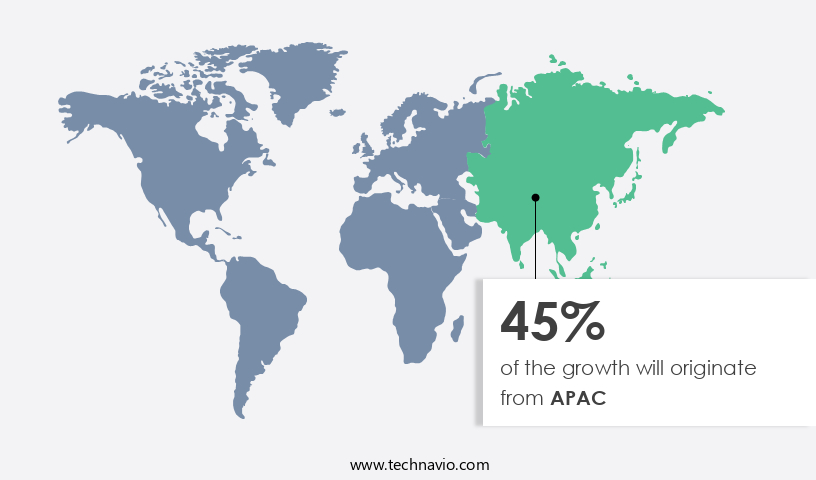
- APAC dominated the market and accounted for a 45% growth during the forecast period.
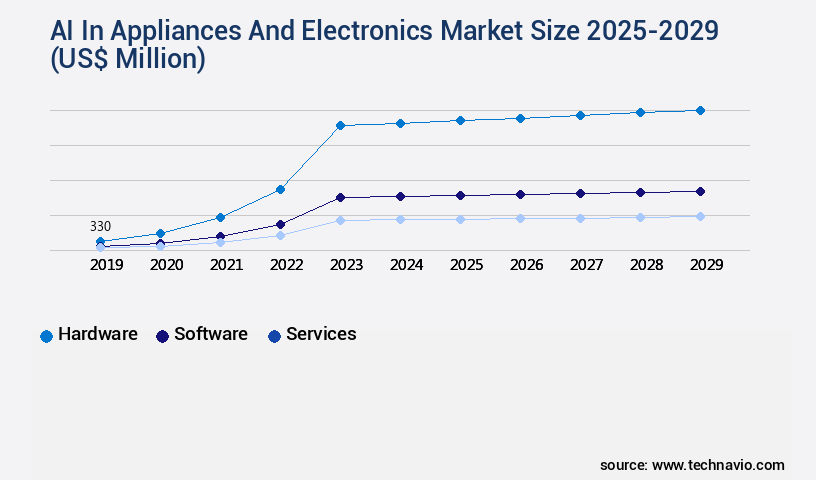
- By Component - Hardware segment was valued at USD 330.00 billion in 2023
- By Technology - Edge AI segment accounted for the largest market revenue share in 2023
Market Size & Forecast
- Market Opportunities: USD 3.00 million
- Market Future Opportunities: USD 10933.90 million
- CAGR from 2024 to 2029 : 17.1%
Market Summary
- In the realm of appliances and electronics, artificial intelligence (AI) is revolutionizing the user experience through advanced functionalities. According to recent market intelligence, The market is projected to reach a value of USD35.3 billion by 2026, underscoring its immense potential. This growth is fueled by escalating consumer expectations for convenience and personalization. AI integration enables hyper-personalized experiences, such as voice recognition and predictive analytics, catering to individual preferences. Conversational interfaces, powered by natural language processing, facilitate seamless communication between users and devices. However, this evolution comes with challenges. Data privacy and security concerns loom large as AI-enabled appliances collect and process vast amounts of personal information.
- Despite these hurdles, the future of AI in appliances and electronics remains promising. Continued advancements in machine learning and deep learning algorithms will lead to more sophisticated applications, further enhancing user experiences. As the market matures, we can expect a shift towards more integrated, interconnected ecosystems, where appliances and electronics work in harmony to create smart homes and cities. Ultimately, the goal is to create a more intuitive, efficient, and enjoyable user experience, setting the stage for a future where technology seamlessly merges with our daily lives.
What will be the Size of the AI In Appliances And Electronics Market during the forecast period?
Get Key Insights on Market Forecast (PDF) Request Free Sample
How is the AI In Appliances And Electronics Market Segmented ?
The ai in appliances and electronics industry research report provides comprehensive data (region-wise segment analysis), with forecasts and estimates in "USD million" for the period 2025-2029, as well as historical data from 2019-2023 for the following segments.
- Component
- Hardware
- Software
- Services
- Technology
- Edge AI
- Machine Learning
- Computer Vision
- NLP
- Others
- Application
- Smart Refrigerators
- Smart Entertainment Systems
- Smart Washing Machines
- Smart Air Conditioners
- Others
- Geography
- North America
- US
- Canada
- Europe
- Germany
- UK
- Middle East and Africa
- UAE
- APAC
- China
- India
- Japan
- Singapore
- South Korea
- Rest of World (ROW)
- North America
By Component Insights
The hardware segment is estimated to witness significant growth during the forecast period.
The market is experiencing continuous evolution, with real-time data processing and smart home automation becoming increasingly common. AI ethics considerations and data privacy regulations are shaping the development of AI-powered appliance control, including anomaly detection systems, voice recognition technology, and facial recognition security. Reinforcement learning and machine learning algorithms are at the heart of these advancements, with deep learning models and neural network architectures, such as convolutional neural networks and recurrent neural networks, driving innovation. AI model training is also a critical component, with cloud-based AI platforms facilitating the integration of IoT device data and sensor data fusion.
Edge computing devices, such as smart appliance diagnostics, enable AI-driven optimization and predictive maintenance, while user experience AI enhances energy efficiency and personalization. Robotic process automation and gesture control interfaces further expand the market's reach, with AI explainability techniques ensuring model accuracy and transparency. The hardware component segment forms the foundational layer, with AI-optimized processors, like Neural Processing Units (NPUs), Graphics Processing Units (GPUs), and custom Application-Specific Integrated Circuits (ASICs), powering these advancements. For instance, a recent study revealed that the global market for AI in appliances and electronics is projected to reach a value of USD118.6 billion by 2025, underscoring the significant growth potential in this sector.
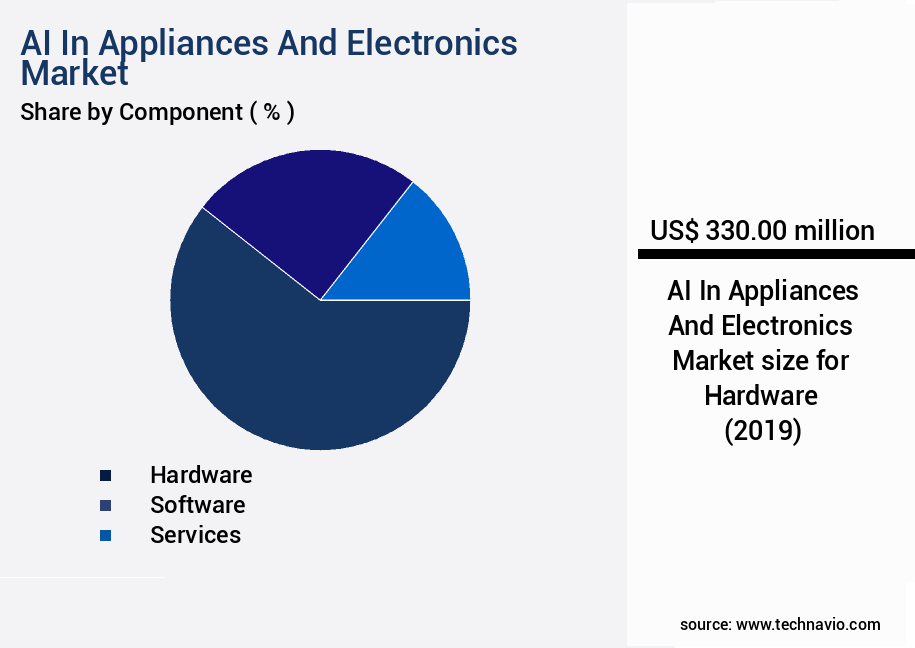
The Hardware segment was valued at USD 330.00 billion in 2019 and showed a gradual increase during the forecast period.
Regional Analysis
APAC is estimated to contribute 45% to the growth of the global market during the forecast period.Technavio's analysts have elaborately explained the regional trends and drivers that shape the market during the forecast period.
See How AI In Appliances And Electronics Market Demand is Rising in APAC Request Free Sample
The Asia-Pacific (APAC) market for AI in appliances and electronics is experiencing robust growth, driven by its large and diverse consumer base, technological innovation, and the mobile-first culture. With countries like China and South Korea leading the way in electronics manufacturing and R&D, the region is home to major players such as Samsung, LG, Haier, and Hisense, pushing the market towards advanced AI capabilities. The APAC region's massive population and increasing affluence create a significant demand for smart home devices, leading to intense competition and rapid product evolution.
Consumers in this region, with their high smartphone penetration, have come to expect seamless app-based control of their appliances, making it a fundamental requirement for market success. According to recent studies, the APAC market for AI in appliances and electronics is projected to surpass the North American market in size by 2025, underscoring its importance in the global context.
Market Dynamics
Our researchers analyzed the data with 2024 as the base year, along with the key drivers, trends, and challenges. A holistic analysis of drivers will help companies refine their marketing strategies to gain a competitive advantage.
The market is experiencing rapid growth as technology advances and consumers seek more intelligent and connected devices for their homes. AI algorithms for appliance control are becoming increasingly common, enabling deep learning models for home automation and optimizing energy consumption. Computer vision in smart home security systems ensures enhanced safety, while natural language processing for appliance commands offers a more intuitive user experience. Sensor data fusion for smart appliance diagnostics enables predictive maintenance using machine learning, reducing downtime and maintenance costs. AI-powered energy management in appliances is another significant trend, utilizing real-time data analytics for smart home devices to optimize energy usage and reduce bills. Cloud-based AI platforms for appliance control offer remote access and management, while edge computing for smart home security systems ensures faster response times and improved security. IoT device integration for AI-powered appliances enables seamless connectivity and data sharing between devices. AI-driven appliance optimization for energy efficiency is a key focus area, with AI-based anomaly detection in home appliances helping to identify and address issues before they become major problems. Robotic process automation for appliance maintenance reduces the need for manual intervention, and machine learning for personalized appliance settings ensures a more comfortable and efficient user experience. As the adoption of AI technology in appliances and electronics continues to grow, it is essential to consider AI ethics guidelines for smart home technology and address data privacy concerns. AI model training for improved appliance performance and measuring the accuracy of AI models in appliances are critical to ensuring the reliability and effectiveness of these systems. Implementing AI explainability techniques in smart homes is also crucial to build trust and transparency with users.
What are the key market drivers leading to the rise in the adoption of AI In Appliances And Electronics Industry?
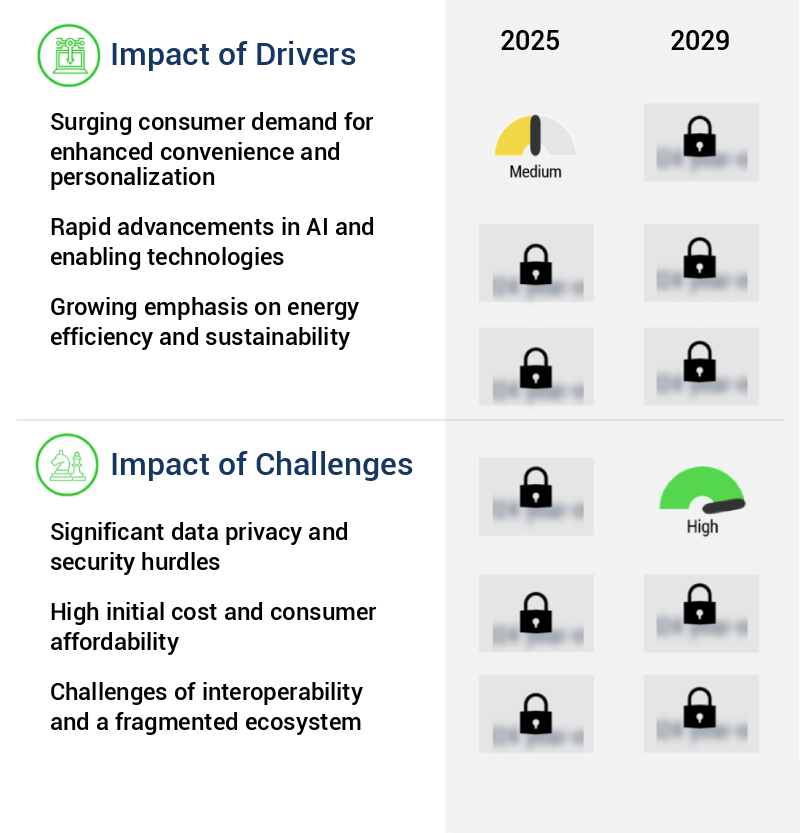
- The surging consumer demand for enhanced convenience and personalization is the primary catalyst fueling market growth, as companies strive to meet customers' increasing expectations for customized products and services.
- The market is experiencing significant growth due to the increasing consumer preference for convenience, automation, and personalized experiences. Modern lifestyles, marked by hectic schedules, have fueled the demand for devices that can simplify daily routines and adapt to user behavior. Artificial Intelligence (AI) is the technology spearheading this transition from manually operated gadgets to intelligent, autonomous systems. This trend is exemplified by the increasing adoption of generative AI in home appliances. For instance, in March 2024, GE Appliances unveiled its Flavorly AI feature within its SmartHQ app.
- This innovative application uses generative AI to create personalized recipes based on existing ingredients, addressing the consumer's desire for convenience and waste reduction. The integration of AI in appliances and electronics is a robust response to the evolving market landscape, with the technology expected to revolutionize various sectors, including healthcare, transportation, and education.
What are the market trends shaping the AI In Appliances And Electronics Industry?
- The integration of generative AI for hyper-personalization and conversational interfaces is an emerging market trend. This advancement in technology enables more effective and efficient customer engagement.
- The market is undergoing a transformative shift, with the integration of generative AI and large language models (LLMs) becoming a dominant trend. This evolution goes beyond the basic, command-based voice assistants of the past, enabling devices to understand context, nuance, and complex user intent. Consequently, appliances are becoming more human-like partners and knowledgeable advisors in the home. Samsung's September 2023 announcement of its strategic plan to incorporate generative AI into its Bixby voice assistant and across its appliance range underscores this trend.
- This integration allows for hyper-personalized user experiences and highly intuitive, conversational interfaces. The AI-driven appliances of the future are poised to revolutionize the way we interact with technology.
What challenges does the AI In Appliances And Electronics Industry face during its growth?
- The growth of the industry is significantly impeded by the presence of substantial data privacy and security challenges. These hurdles necessitate rigorous adherence to regulatory frameworks and the implementation of robust security measures to safeguard sensitive information and maintain consumer trust.
- The market is experiencing a surge in applications across various sectors, driven by advancements in technology and consumer demand. Intelligent devices, such as smart refrigerators and voice assistants, collect vast amounts of personal and behavioral data, leading to growing concerns about data privacy and security. A study published in early 2024 revealed that 57% of homeowners are concerned about data management by smart devices, with 40% of users unaware of the data collection methods employed by their devices. This continuous data collection creates significant privacy risks, as consumers are uncertain about what information is being collected, how it is being used, and with whom it is being shared.
Exclusive Technavio Analysis on Customer Landscape
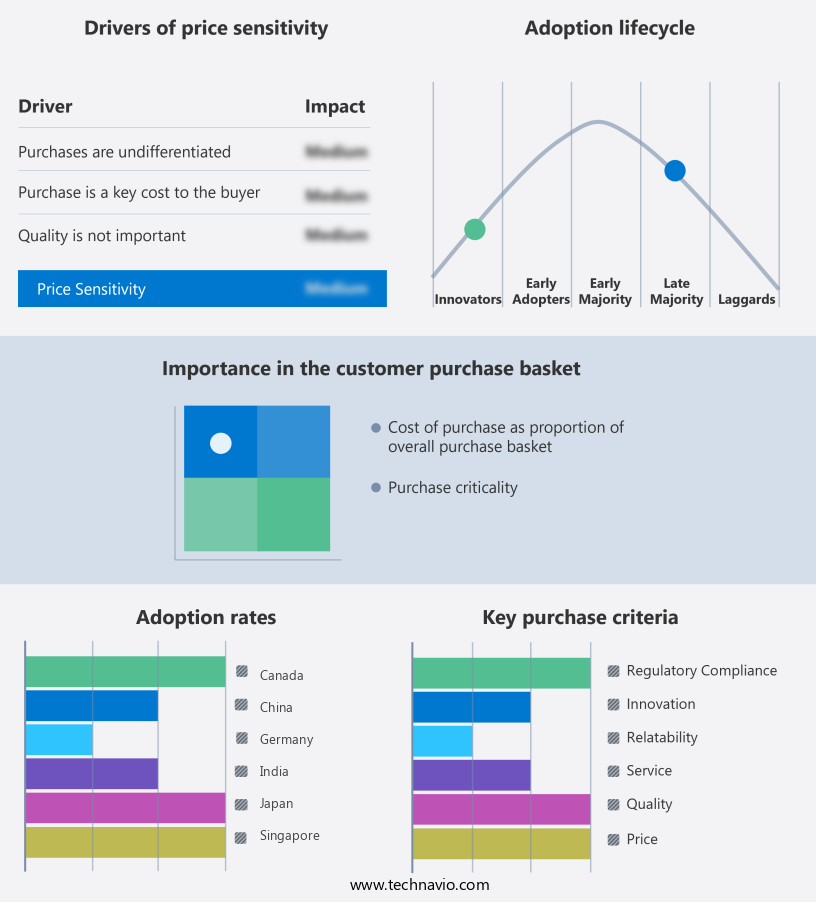
The ai in appliances and electronics market forecasting report includes the adoption lifecycle of the market, covering from the innovator's stage to the laggard's stage. It focuses on adoption rates in different regions based on penetration. Furthermore, the ai in appliances and electronics market report also includes key purchase criteria and drivers of price sensitivity to help companies evaluate and develop their market growth analysis strategies.
Customer Landscape of AI In Appliances And Electronics Industry
Competitive Landscape
Companies are implementing various strategies, such as strategic alliances, ai in appliances and electronics market forecast, partnerships, mergers and acquisitions, geographical expansion, and product/service launches, to enhance their presence in the industry.
Arcelik Marketing Inc. - This company specializes in integrating artificial intelligence technology into appliances and electronics, including advanced features in smart refrigerators and dishwashers, enhancing user convenience and efficiency.
The industry research and growth report includes detailed analyses of the competitive landscape of the market and information about key companies, including:
- Arcelik Marketing Inc.
- Breville Group Ltd.
- Dyson Group Co.
- Electrolux Group
- Glen Dimplex Group.
- Gorenje Group
- Haier Smart Home Co. Ltd.
- Hamilton Beach Brands Inc.
- Koninklijke Philips NV
- LG Electronics Inc.
- Midea Group Co. Ltd.
- Miele and Cie. KG
- Panasonic Holdings Corp.
- Robert Bosch GmbH
- Samsung Electronics Co. Ltd.
- SOCIETE SAS
- TEKA INDUSTRIAL SA
- Whirlpool Corp.
Qualitative and quantitative analysis of companies has been conducted to help clients understand the wider business environment as well as the strengths and weaknesses of key industry players. Data is qualitatively analyzed to categorize companies as pure play, category-focused, industry-focused, and diversified; it is quantitatively analyzed to categorize companies as dominant, leading, strong, tentative, and weak.
Recent Development and News in AI In Appliances And Electronics Market
- In January 2024, LG Electronics unveiled its new line of AI-enabled appliances, including refrigerators and washing machines, at the Consumer Electronics Show (CES). These appliances were equipped with deep learning algorithms and voice recognition technology, enabling them to learn user preferences and optimize energy consumption (LG Electronics Press Release, 2024).
- In March 2024, Samsung and Microsoft announced a strategic partnership to integrate Microsoft's Azure AI platform into Samsung's home appliances and electronics. This collaboration aimed to enhance user experiences through voice recognition, predictive maintenance, and personalized recommendations (Microsoft News Center, 2024).
- In May 2024, Haier Group completed the acquisition of BlueStar, a leading manufacturer of high-performance commercial appliances. The acquisition expanded Haier's product portfolio and strengthened its presence in the commercial appliances market (Haier Group Press Release, 2024).
- In April 2025, the European Union approved new regulations for energy efficiency labels for appliances, mandating the use of AI and machine learning technologies to optimize energy consumption. This policy change is expected to drive market growth and innovation in the AI in appliances and electronics sector (European Commission Press Release, 2025).
Dive into Technavio's robust research methodology, blending expert interviews, extensive data synthesis, and validated models for unparalleled AI In Appliances And Electronics Market insights. See full methodology.
|
Market Scope |
|
|
Report Coverage |
Details |
|
Page number |
247 |
|
Base year |
2024 |
|
Historic period |
2019-2023 |
|
Forecast period |
2025-2029 |
|
Growth momentum & CAGR |
Accelerate at a CAGR of 17.1% |
|
Market growth 2025-2029 |
USD 10933.9 million |
|
Market structure |
Fragmented |
|
YoY growth 2024-2025(%) |
15.5 |
|
Key countries |
US, China, India, Japan, South Korea, UK, Germany, Canada, UAE, and Singapore |
|
Competitive landscape |
Leading Companies, Market Positioning of Companies, Competitive Strategies, and Industry Risks |
Research Analyst Overview
- The market continues to evolve at an unprecedented pace, with real-time data processing becoming a standard feature in various sectors. Smart home automation, for instance, has seen significant growth, with an estimated 64.3% increase in global smart home device shipments in 2020. This trend is driven by the integration of AI-powered appliance control, voice recognition technology, and natural language processing. AI ethics considerations are also gaining importance, with reinforcement learning and deep learning models increasingly being used to optimize energy efficiency and enhance user experience. Neural network architectures and machine learning algorithms are at the heart of these advancements, enabling anomaly detection systems and predictive maintenance AI.
- Moreover, data privacy regulations are shaping the market, with AI model training and data analytics dashboards adhering to strict security protocols. Edge computing devices and IoT device integration are further facilitating real-time data processing and analysis, while facial recognition security and gesture control interfaces add a new level of convenience. AI-driven optimization and sensor data fusion are key areas of focus, with AI explainability techniques ensuring transparency and trust. The industry is expected to grow at a robust rate, with a recent study projecting a 21.5% compound annual growth rate in the global AI market for appliances and electronics.
- For instance, a leading appliance manufacturer reported a 15% increase in sales due to the implementation of AI-powered diagnostics and performance metrics in their smart washing machines. This success underscores the potential of AI in enhancing appliance functionality and user experience.
What are the Key Data Covered in this AI In Appliances And Electronics Market Research and Growth Report?
-
What is the expected growth of the AI In Appliances And Electronics Market between 2025 and 2029?
-
USD 10.93 billion, at a CAGR of 17.1%
-
-
What segmentation does the market report cover?
-
The report is segmented by Component (Hardware, Software, and Services), Technology (Edge AI, Machine Learning, Computer Vision, NLP, and Others), Application (Smart Refrigerators, Smart Entertainment Systems, Smart Washing Machines, Smart Air Conditioners, and Others), and Geography (APAC, North America, Europe, Middle East and Africa, and South America)
-
-
Which regions are analyzed in the report?
-
APAC, North America, Europe, Middle East and Africa, and South America
-
-
What are the key growth drivers and market challenges?
-
Surging consumer demand for enhanced convenience and personalization, Significant data privacy and security hurdles
-
-
Who are the major players in the AI In Appliances And Electronics Market?
-
Arcelik Marketing Inc., Breville Group Ltd., Dyson Group Co., Electrolux Group, Glen Dimplex Group., Gorenje Group, Haier Smart Home Co. Ltd., Hamilton Beach Brands Inc., Koninklijke Philips NV, LG Electronics Inc., Midea Group Co. Ltd., Miele and Cie. KG, Panasonic Holdings Corp., Robert Bosch GmbH, Samsung Electronics Co. Ltd., SOCIETE SAS, TEKA INDUSTRIAL SA, and Whirlpool Corp.
-
Market Research Insights
- The market for AI in appliances and electronics is a dynamic and ever-evolving landscape. Two key areas of growth are user preference learning and smart home security. For instance, AI algorithms can analyze usage patterns to optimize appliance settings for individual users, resulting in significant energy savings. In fact, a study suggests that smart homes can reduce energy consumption by up to 30%.
- Moreover, the industry anticipates a steady expansion, with growth expectations projected at around 20% annually. AI-powered diagnostics and predictive maintenance are driving this trend, enabling efficient resource management and reducing maintenance costs. For example, a leading appliance manufacturer reported a 40% increase in sales due to their AI-driven automation and improved appliance lifespan offerings.
We can help! Our analysts can customize this ai in appliances and electronics market research report to meet your requirements.
 RIA -
RIA - 
