AI In Predictive Maintenance Market Analysis North America, Europe, APAC, Middle East and Africa, South America - US, China, Germany, Japan, UK, India, Canada, France, South Korea, Italy - Size and Forecast 2025-2029

AI In Predictive Maintenance Market Analysis North America, Europe, APAC, Middle East and Africa, South America - US, China, Germany, Japan, UK, India, Canada, France, South Korea, Italy - Size and Forecast 2025-2029

Published: Dec 2024 211 Pages SKU: IRTNTR80470

Market Overview at a Glance

$988.6 Mn
Market Opportunity
17%
CAGR
16.7
YoY growth 2024-2025(%)

What is the Size of AI In Predictive Maintenance Market?

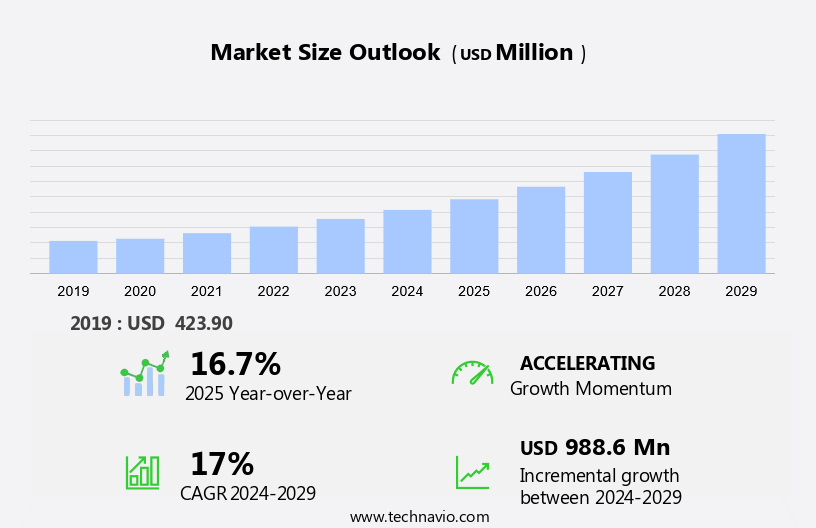
The AI In Predictive Maintenance Market size is forecast to increase by USD 988.6 million, at a CAGR of 17% between 2024 and 2029. The market is experiencing significant growth due to the launch of new solutions and innovations by vendors. These advancements enable organizations to proactively address maintenance needs, reducing downtime and increasing operational efficiency. However, privacy and security concerns associated with the use of artificial intelligence (AI) in predictive maintenance are emerging challenges. Vendors must address these issues to ensure data security and protect against potential breaches. Additionally, the integration of AI with existing systems and processes can be complex, requiring careful planning and implementation. Despite these challenges, the benefits of predictive maintenance, such as improved asset performance and reduced maintenance costs, make it a valuable investment for organizations in the region.

AI In Predictive Maintenance Market Size

Request Free Market Sample

Market Segmentation

The market research report provides comprehensive data (region-wise segment analysis), with forecasts and estimates in "USD million" for the period 2025-2029, as well as historical data from 2019 - 2023 for the following segments.
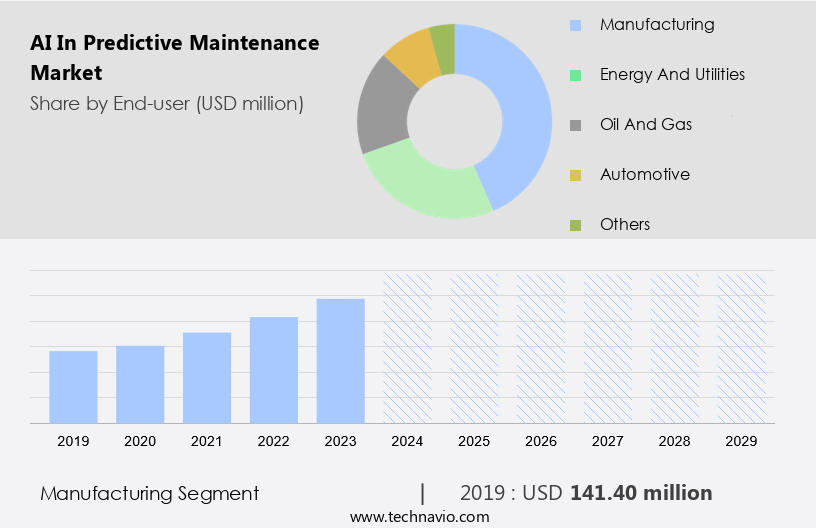
  • End-user
    • Manufacturing
    • Energy and utilities
    • Oil and gas
    • Automotive
    • Others
  • Solution
    • Integrated solutions
    • Standalone solutions
  • Geography
    • North America
      • Canada
      • US
    • Europe
      • Germany
      • UK
      • France
      • Italy
    • APAC
      • China
      • India
      • Japan
      • South Korea
    • Middle East and Africa
    • South America

Which is the largest segment driving market growth?

The manufacturing segment is estimated to witness significant growth during the forecast period. In the manufacturing industry, the implementation of AI-driven predictive maintenance solutions is becoming increasingly popular to boost productivity and maintain a competitive edge. The optimization of manufacturing processes is essential, encompassing productivity enhancement, rigorous quality control, cost reduction, and risk management of compliance. To accomplish these objectives, manufacturers are embracing automation and advanced technologies, with AI playing a significant role.

AI In Predictive Maintenance Market Size

Get a glance at the market share of various regions. Download the PDF Sample

The manufacturing segment was valued at USD 141.40 million in 2019.  AI technologies are revolutionizing manufacturing by offering cost-effective improvements beyond traditional automation. One of the significant advancements is the utilization of digital twin technology and AI-powered predictive maintenance. Digital twins generate virtual replicas of physical assets, enabling real-time monitoring and analysis. This technology, in conjunction with predictive maintenance, helps prolong equipment life by identifying potential issues before they result in failures. Edge computing is another crucial aspect of AI-driven predictive maintenance, enabling data processing at the source for quicker response times and improved efficiency. Asset management in manufacturing is also enhanced by AI predictive maintenance, ensuring network equipment and production processes operate at optimal levels for sustainability. The scalability of AI solutions allows for seamless integration into existing systems, making it an attractive option for manufacturers.

Which region is leading the market?

AI In Predictive Maintenance Market Share by Geography

For more insights on the market share of various regions, Request Free Sample

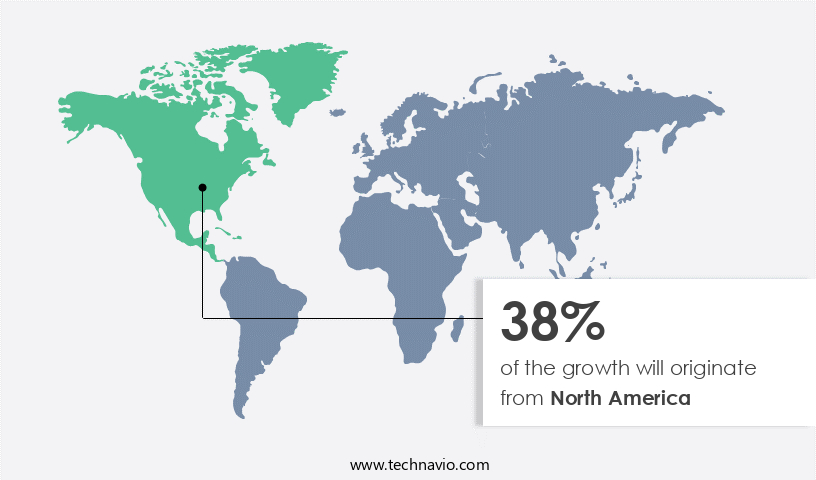
North America is estimated to contribute 38% to the growth of the global market during the forecast period. Technavio's analysts have elaborately explained the regional market trends and drivers that shape the market during the forecast period.  In North America, the use of AI in predictive maintenance is gaining momentum due to technological advancements and strategic partnerships. Companies in various sectors are adopting AI-driven solutions to increase efficiency and decrease maintenance costs. For instance, in November 2024, GE unveiled an innovative tool that employs generative AI to expedite access to essential maintenance records for airlines and lessors. This groundbreaking solution is designed to cut down the time spent on searching for records from hours to minutes. Moreover, GE is employing AI to monitor engine performance, anticipate maintenance requirements, keep track of fuel consumption, optimize fuel efficiency, and forecast the necessary work orders and components for engine repairs before induction. System integration of AR technology with real-world data plays a crucial role in enhancing predictive maintenance capabilities. By visualizing data in real-time, maintenance teams can make informed decisions, thereby improving asset utilization and minimizing machine downtime.

How do company ranking index and market positioning come to your aid?

Companies are implementing various strategies, such as strategic alliances, partnerships, mergers and acquisitions, geographical expansion, and product/service launches, to enhance their presence in the market.

ABB Ltd. - This company offers AI in predictive maintenance like the ABB Ability condition monitoring, use AI and sensor data to monitor equipment conditions.

Technavio provides the ranking index for the top 17 companies along with insights on the market positioning of:

  • C3.ai Inc.
  • ClairViz Technology Systems Pvt. Ltd.
  • DB E.C.O. Group
  • DINGO Software Pty. Ltd.
  • ExactSpace
  • Faclon Labs Pvt. Ltd.
  • GE Vernova Inc.
  • Honeywell International Inc.
  • International Business Machines Corp.
  • KCF Technologies Inc.
  • Machinestalk
  • PTC Inc.
  • Radix U.S. LLC.
  • SAP SE
  • Siemens AG
  • Uptake Technologies Inc.

Explore our company rankings and market positioning. Request Free Sample

How can Technavio assist you in making critical decisions?

AI In Predictive Maintenance Market Size

What is the market structure and year-over-year growth of the Market?

Market structure

Fragmented

YoY growth 2024-2025

16.7

Market Dynamics

The market is undergoing a significant transformation as businesses seek to optimize their operations, reduce costs, and enhance asset performance. The adoption of artificial intelligence (AI) in predictive maintenance is a key driver of this transformation. This approach leverages data-driven insights to anticipate equipment failures, schedule maintenance proactively, and improve overall operational efficiency. The integration of AI in predictive maintenance is revolutionizing maintenance best practices. Traditional reactive and preventive maintenance strategies are being replaced by condition-based maintenance and predictive maintenance, which rely on real-time data analysis and machine learning models to predict equipment failures before they occur. This shift towards data-driven decision making is enabling maintenance optimization, downtime reduction, and asset lifecycle management. The adoption of AI in predictive maintenance is also influencing maintenance outsourcing trends. As businesses increasingly rely on AI-powered maintenance solutions, there is a growing demand for specialized maintenance service providers. Self-driving vehicles and industrial automation are further driving the need for advanced maintenance capabilities, as these systems require minimal human intervention and high levels of reliability. Data analytics plays a crucial role in the successful implementation of AI in predictive maintenance. By collecting and analyzing environmental data, maintenance scheduling, and asset performance data, businesses can gain valuable insights into their operations.

Data visualization tools and asset integration enable maintenance teams to monitor asset health in real-time, enabling them to make informed decisions and take proactive action to prevent equipment failures. Condition monitoring is a critical component of predictive maintenance, and AI-powered solutions offer significant advantages over traditional methods. Machine learning models can analyze vast amounts of data to identify patterns and anomalies that may indicate impending equipment failures. This enables maintenance teams to take preventive action, reducing the risk of unexpected downtime and minimizing maintenance costs. AI-powered predictive maintenance solutions enable businesses to optimize their asset performance by providing real-time insights into asset health and predicting potential failures. This enables maintenance teams to schedule maintenance proactively, reducing downtime and improving operational efficiency. Our researchers analyzed the data with 2024 as the base year, along with the key drivers, trends, and challenges. A holistic analysis of drivers will help companies refine their marketing strategies to gain a competitive advantage.

What are the primary factors driving the market growth?

The launch of new solutions is notably driving the market growth. The market is experiencing significant growth in the US, fueled by the integration of advanced technologies such as 5G, IoT devices, and edge computing. These innovations enable real-time data collection and analysis, allowing for more efficient asset management and improved machine efficiency. Predictive analytics and machine learning algorithms are at the heart of AI-driven predictive maintenance, enabling the identification of potential component failures before they cause downtime or asset failures. Guidewheel's latest offering, Scout, is an example of this technological advancement. This solution uses AI and ML to analyze operational history and performance data from physical assets, providing automated reporting and troubleshooting recommendations. By detecting anomalies and alerting maintenance personnel in real-time, Scout helps prevent unplanned downtime and reduces maintenance costs. Scalability and compatibility are crucial considerations in the implementation of AI predictive maintenance solutions. Asset management systems often consist of disparate systems and hardware components, requiring careful system integration.

Domain expertise is also essential to ensure accurate predictions and reliable troubleshooting. The benefits of AI predictive maintenance extend beyond cost savings and improved machine uptime. It also enhances sustainability by optimizing production processes and reducing infrastructure costs. Moreover, it contributes to workplace safety by minimizing the need for manual inspection and reducing the risk of equipment failure. The implementation cost of AI predictive maintenance solutions can be a concern for some organizations. However, the long-term benefits, including reduced downtime, improved asset utilization, and increased productivity, often outweigh the initial investment. As the technology continues to evolve, affordable price points and advanced monitoring techniques will make AI predictive maintenance accessible to a broader range of industries and applications. Thus, such factors are driving the growth of the market during the forecast period.

What are the significant trends being witnessed in the market?

Innovations by companies are an emerging trend shaping market growth.  The market is experiencing substantial growth due to the integration of advanced technologies such as 5G, IoT devices, and edge computing. These innovations enable more efficient and cost-effective maintenance processes by enabling real-time data collection and analysis. Predictive analytics, machine learning, and digital twin technology are key components of AI-driven predictive maintenance, allowing for the identification of potential component failures before they occur. Operational efficiency and sustainability are significant benefits of implementing AI predictive maintenance in manufacturing plants and other industrial settings. By utilizing automated reporting and AR technology, maintenance personnel can quickly address issues, reducing downtime and increasing asset utilization.

Additionally, the use of generative AI enhances the conversational nature of predictive maintenance platforms, streamlining human-machine interactions. Scalability and domain expertise are essential considerations in the implementation of AI predictive maintenance systems. Companies must address compatibility concerns with disparate systems and ensure seamless system integration. Infrastructure costs and the operational history of physical assets are also critical factors in the adoption of these technologies. The integration of advanced monitoring techniques and ML algorithms into predictive maintenance platforms enables manufacturers to optimize production processes and minimize additional costs associated with asset failures. Thus, such trends will shape the growth of the market during the forecast period.

What are the major market challenges?

Privacy and security issues a significant challenges hindering the market growth. The market is experiencing significant growth as organizations seek to reduce maintenance costs and improve operational efficiency and machine efficiency. With the integration of 5G technology and IoT devices, real-time data collection from physical assets is now possible, enabling advanced predictive analytics to identify potential component failures before they occur. AI-driven predictive maintenance using machine learning algorithms can simulate the output of machinery and digital twin technology to provide accurate and affordable solutions. However, challenges remain in implementing these systems, including compatibility concerns between disparate systems and the need for domain expertise to ensure accurate analysis. The integration of AI predictive maintenance into production processes requires system integration and troubleshooting, which can add additional costs. Asset management and asset utilization are improved through automated reporting and AR technology, but concerns around privacy and security must be addressed.

Ensuring data governance frameworks include stringent access controls and strong encryption mechanisms is essential to protect sensitive information and maintain workplace safety. Edge computing and network equipment scalability are also critical factors in the success of AI in predictive maintenance. Manufacturing plants and remote equipment can benefit from real-world data and predictive maintenance, reducing downtime and increasing productivity. Implementation costs and infrastructure costs can be mitigated through technological advancements and the affordability of AI solutions. The market for AI in predictive maintenance is expected to continue growing as organizations prioritize sustainability and seek to optimize their maintenance strategies. Hence, the above factors will impede the growth of the market during the forecast period.

Exclusive Customer Landscape

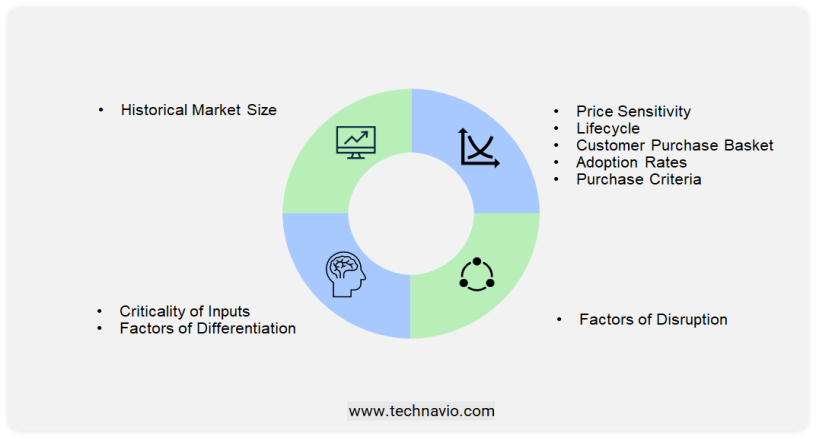
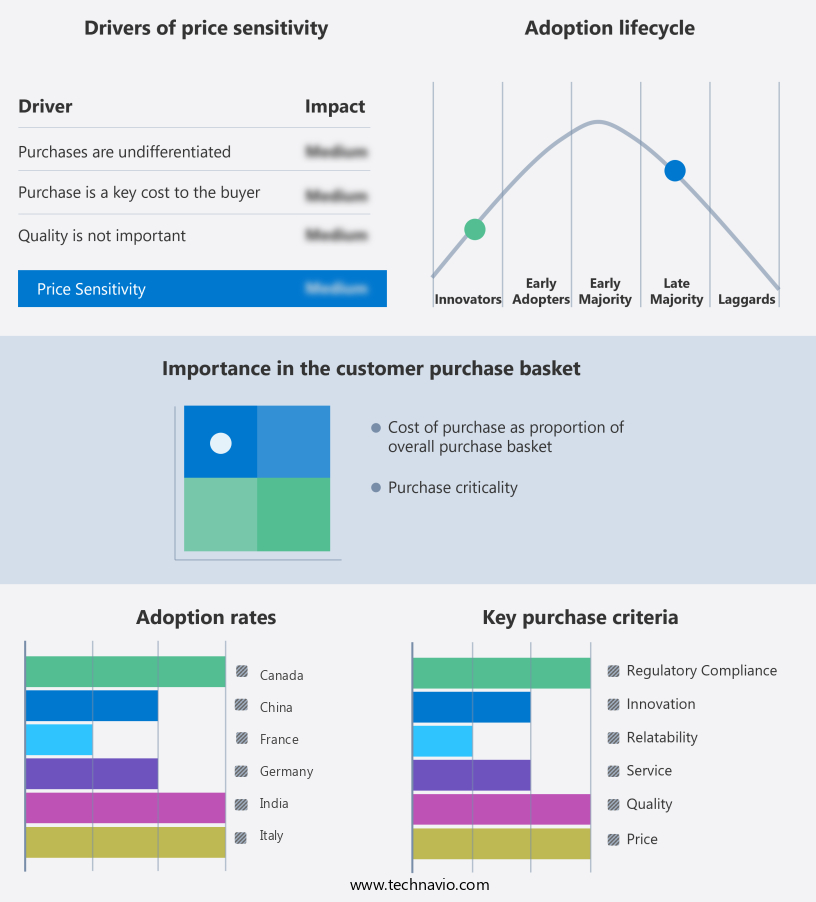
The market forecasting report includes the adoption lifecycle of the market research and growth, covering from the innovator's stage to the laggard's stage. It focuses on adoption rates in different regions based on penetration. Furthermore, the report also includes key purchase criteria and drivers of price sensitivity to help companies evaluate and develop their market growth analysis strategies.

AI In Predictive Maintenance Market Share by Geography

 Customer Landscape

Market Analyst Overview

The integration of Artificial Intelligence (AI) in predictive maintenance has emerged as a game-changer in the industrial sector, particularly in the context of 5G technology. This technological advancement is transforming the way organizations manage their physical assets, optimize production processes, and ensure workplace safety. 5G technology, with its high-speed connectivity and low latency, is paving the way for the widespread adoption of IoT devices and edge computing. These technologies are crucial components of AI-driven predictive maintenance, enabling real-time data collection and advanced analytics. Predictive maintenance, which leverages AI, ML, and IoT, offers significant advantages over traditional preventive maintenance. By analyzing operational history, asset life, and machine efficiency, predictive maintenance identifies potential component failures before they occur.

This proactive approach not only reduces downtime but also minimizes maintenance costs and enhances asset utilization. However, the implementation of AI predictive maintenance comes with challenges. Misinformation and disparate systems can hinder the accuracy of predictive analytics. Compatibility concerns with various hardware components and infrastructure costs are other factors that organizations need to consider. Despite these challenges, the benefits of AI predictive maintenance far outweigh the costs. By automating reporting and troubleshooting, organizations can save on servicing and maintenance personnel. Furthermore, the use of digital twin technology allows for simulated output analysis and visualization, providing valuable insights into asset behavior and performance. The role of domain expertise in implementing AI predictive maintenance cannot be overstated.

Market Scope

Report Coverage

Details

Page number

211

Base year

2024

Historic period

2019 - 2023

Forecast period

2025-2029

Growth momentum & CAGR

Accelerate at a CAGR of 17%

Market growth 2025-2029

USD 988.6 million

Regional analysis

North America, Europe, APAC, Middle East and Africa, and South America

Performing market contribution

North America at 38%

Key countries

US, China, Germany, Japan, UK, India, Canada, France, South Korea, and Italy

Competitive landscape

Leading Companies, Market Positioning of Companies, Competitive Strategies, and Industry Risks

Key companies profiled

ABB Ltd., C3.ai Inc., ClairViz Technology Systems Pvt. Ltd., DB E.C.O. Group, DINGO Software Pty. Ltd., ExactSpace, Faclon Labs Pvt. Ltd., GE Vernova Inc., Honeywell International Inc., International Business Machines Corp., KCF Technologies Inc., Machinestalk, PTC Inc., Radix U.S. LLC., SAP SE, Siemens AG, and Uptake Technologies Inc.

Market Segmentation

End-user (Manufacturing, Energy and utilities, Oil and gas, Automotive, and Others), Solution (Integrated solutions and Standalone solutions), and Geography (North America, Europe, APAC, Middle East and Africa, and South America)

Customization purview

If our market report has not included the data that you are looking for, you can reach out to our analysts and get segments customized.

Download PDF Sample

What are the Key Data Covered in this Market Research Report?

  • CAGR of the market during the market forecast period
  • Detailed information on factors that will drive the market growth and forecasting between 2025 and 2029
  • Precise estimation of the size of the market  and its contribution of the market in focus to the parent market
  • Accurate predictions about upcoming market growth and trends and changes in consumer behavior
  • Growth of the market across North America, Europe, APAC, Middle East and Africa, and South America
  • Thorough analysis of the market's competitive landscape and detailed information about companies
  • Comprehensive analysis of factors that will challenge the growth of market companies

1 Executive Summary

  • 1.1 Market overview
    • Executive Summary - Chart on Market Overview
    • Executive Summary - Data Table on Market Overview
    • Executive Summary - Chart on Global Market Characteristics
    • Executive Summary - Chart on Market by Geography
    • Executive Summary - Chart on Market Segmentation by End-user
    • Executive Summary - Chart on Market Segmentation by Solution
    • Executive Summary - Chart on Incremental Growth
    • Executive Summary - Data Table on Incremental Growth
    • Executive Summary - Chart on Company Market Positioning

2 Technavio Analysis

  • 2.1 Analysis of price sensitivity, lifecycle, customer purchase basket, adoption rates, and purchase criteria
    • Analysis of price sensitivity, lifecycle, customer purchase basket, adoption rates, and purchase criteria
  • 2.2 Criticality of inputs and Factors of differentiation
    • Overview on criticality of inputs and factors of differentiation
  • 2.3 Factors of disruption
    • Overview on factors of disruption
  • 2.4 Impact of drivers and challenges
    • Impact of drivers and challenges in 2024 and 2029

3 Market Landscape

  • 3.1 Market ecosystem
    • Parent Market
    • Data Table on - Parent Market
  • 3.2 Market characteristics
    • Market characteristics analysis
  • 3.3 Value chain analysis
    • Value chain analysis

4 Market Sizing

  • 4.1 Market definition
    • Offerings of companies included in the market definition
  • 4.2 Market segment analysis
    • Market segments
  • 4.3 Market size 2024
    • 4.4 Market outlook: Forecast for 2024-2029
      • Chart on Global - Market size and forecast 2024-2029 ($ million)
      • Data Table on Global - Market size and forecast 2024-2029 ($ million)
      • Chart on Global Market: Year-over-year growth 2024-2029 (%)
      • Data Table on Global Market: Year-over-year growth 2024-2029 (%)

    5 Historic Market Size

    • 5.1 Global AI In Predictive Maintenance Market 2019 - 2023
      • Historic Market Size - Data Table on Global AI In Predictive Maintenance Market 2019 - 2023 ($ million)
    • 5.2 End-user segment analysis 2019 - 2023
      • Historic Market Size - End-user Segment 2019 - 2023 ($ million)
    • 5.3 Solution segment analysis 2019 - 2023
      • Historic Market Size - Solution Segment 2019 - 2023 ($ million)
    • 5.4 Geography segment analysis 2019 - 2023
      • Historic Market Size - Geography Segment 2019 - 2023 ($ million)
    • 5.5 Country segment analysis 2019 - 2023
      • Historic Market Size - Country Segment 2019 - 2023 ($ million)

    6 Qualitative Analysis

    • 6.1 Impact of AI on Global AI in Predictive Maintenance Market

      7 Five Forces Analysis

      • 7.1 Five forces summary
        • Five forces analysis - Comparison between 2024 and 2029
      • 7.2 Bargaining power of buyers
        • Bargaining power of buyers - Impact of key factors 2024 and 2029
      • 7.3 Bargaining power of suppliers
        • Bargaining power of suppliers - Impact of key factors in 2024 and 2029
      • 7.4 Threat of new entrants
        • Threat of new entrants - Impact of key factors in 2024 and 2029
      • 7.5 Threat of substitutes
        • Threat of substitutes - Impact of key factors in 2024 and 2029
      • 7.6 Threat of rivalry
        • Threat of rivalry - Impact of key factors in 2024 and 2029
      • 7.7 Market condition
        • Chart on Market condition - Five forces 2024 and 2029

      8 Market Segmentation by End-user

      • 8.1 Market segments
        • Chart on End-user - Market share 2024-2029 (%)
        • Data Table on End-user - Market share 2024-2029 (%)
      • 8.2 Comparison by End-user
        • Chart on Comparison by End-user
        • Data Table on Comparison by End-user
      • 8.3 Manufacturing - Market size and forecast 2024-2029
        • Chart on Manufacturing - Market size and forecast 2024-2029 ($ million)
        • Data Table on Manufacturing - Market size and forecast 2024-2029 ($ million)
        • Chart on Manufacturing - Year-over-year growth 2024-2029 (%)
        • Data Table on Manufacturing - Year-over-year growth 2024-2029 (%)
      • 8.4 Energy and utilities - Market size and forecast 2024-2029
        • Chart on Energy and utilities - Market size and forecast 2024-2029 ($ million)
        • Data Table on Energy and utilities - Market size and forecast 2024-2029 ($ million)
        • Chart on Energy and utilities - Year-over-year growth 2024-2029 (%)
        • Data Table on Energy and utilities - Year-over-year growth 2024-2029 (%)
      • 8.5 Oil and gas - Market size and forecast 2024-2029
        • Chart on Oil and gas - Market size and forecast 2024-2029 ($ million)
        • Data Table on Oil and gas - Market size and forecast 2024-2029 ($ million)
        • Chart on Oil and gas - Year-over-year growth 2024-2029 (%)
        • Data Table on Oil and gas - Year-over-year growth 2024-2029 (%)
      • 8.6 Automotive - Market size and forecast 2024-2029
        • Chart on Automotive - Market size and forecast 2024-2029 ($ million)
        • Data Table on Automotive - Market size and forecast 2024-2029 ($ million)
        • Chart on Automotive - Year-over-year growth 2024-2029 (%)
        • Data Table on Automotive - Year-over-year growth 2024-2029 (%)
      • 8.7 Others - Market size and forecast 2024-2029
        • Chart on Others - Market size and forecast 2024-2029 ($ million)
        • Data Table on Others - Market size and forecast 2024-2029 ($ million)
        • Chart on Others - Year-over-year growth 2024-2029 (%)
        • Data Table on Others - Year-over-year growth 2024-2029 (%)
      • 8.8 Market opportunity by End-user
        • Market opportunity by End-user ($ million)
        • Data Table on Market opportunity by End-user ($ million)

      9 Market Segmentation by Solution

      • 9.1 Market segments
        • Chart on Solution - Market share 2024-2029 (%)
        • Data Table on Solution - Market share 2024-2029 (%)
      • 9.2 Comparison by Solution
        • Chart on Comparison by Solution
        • Data Table on Comparison by Solution
      • 9.3 Integrated solutions - Market size and forecast 2024-2029
        • Chart on Integrated solutions - Market size and forecast 2024-2029 ($ million)
        • Data Table on Integrated solutions - Market size and forecast 2024-2029 ($ million)
        • Chart on Integrated solutions - Year-over-year growth 2024-2029 (%)
        • Data Table on Integrated solutions - Year-over-year growth 2024-2029 (%)
      • 9.4 Standalone solutions - Market size and forecast 2024-2029
        • Chart on Standalone solutions - Market size and forecast 2024-2029 ($ million)
        • Data Table on Standalone solutions - Market size and forecast 2024-2029 ($ million)
        • Chart on Standalone solutions - Year-over-year growth 2024-2029 (%)
        • Data Table on Standalone solutions - Year-over-year growth 2024-2029 (%)
      • 9.5 Market opportunity by Solution
        • Market opportunity by Solution ($ million)
        • Data Table on Market opportunity by Solution ($ million)

      10 Customer Landscape

      • 10.1 Customer landscape overview
        • Analysis of price sensitivity, lifecycle, customer purchase basket, adoption rates, and purchase criteria

      11 Geographic Landscape

      • 11.1 Geographic segmentation
        • Chart on Market share by geography 2024-2029 (%)
        • Data Table on Market share by geography 2024-2029 (%)
      • 11.2 Geographic comparison
        • Chart on Geographic comparison
        • Data Table on Geographic comparison
      • 11.3 North America - Market size and forecast 2024-2029
        • Chart on North America - Market size and forecast 2024-2029 ($ million)
        • Data Table on North America - Market size and forecast 2024-2029 ($ million)
        • Chart on North America - Year-over-year growth 2024-2029 (%)
        • Data Table on North America - Year-over-year growth 2024-2029 (%)
      • 11.4 Europe - Market size and forecast 2024-2029
        • Chart on Europe - Market size and forecast 2024-2029 ($ million)
        • Data Table on Europe - Market size and forecast 2024-2029 ($ million)
        • Chart on Europe - Year-over-year growth 2024-2029 (%)
        • Data Table on Europe - Year-over-year growth 2024-2029 (%)
      • 11.5 APAC - Market size and forecast 2024-2029
        • Chart on APAC - Market size and forecast 2024-2029 ($ million)
        • Data Table on APAC - Market size and forecast 2024-2029 ($ million)
        • Chart on APAC - Year-over-year growth 2024-2029 (%)
        • Data Table on APAC - Year-over-year growth 2024-2029 (%)
      • 11.6 Middle East and Africa - Market size and forecast 2024-2029
        • Chart on Middle East and Africa - Market size and forecast 2024-2029 ($ million)
        • Data Table on Middle East and Africa - Market size and forecast 2024-2029 ($ million)
        • Chart on Middle East and Africa - Year-over-year growth 2024-2029 (%)
        • Data Table on Middle East and Africa - Year-over-year growth 2024-2029 (%)
      • 11.7 South America - Market size and forecast 2024-2029
        • Chart on South America - Market size and forecast 2024-2029 ($ million)
        • Data Table on South America - Market size and forecast 2024-2029 ($ million)
        • Chart on South America - Year-over-year growth 2024-2029 (%)
        • Data Table on South America - Year-over-year growth 2024-2029 (%)
      • 11.8 US - Market size and forecast 2024-2029
        • Chart on US - Market size and forecast 2024-2029 ($ million)
        • Data Table on US - Market size and forecast 2024-2029 ($ million)
        • Chart on US - Year-over-year growth 2024-2029 (%)
        • Data Table on US - Year-over-year growth 2024-2029 (%)
      • 11.9 China - Market size and forecast 2024-2029
        • Chart on China - Market size and forecast 2024-2029 ($ million)
        • Data Table on China - Market size and forecast 2024-2029 ($ million)
        • Chart on China - Year-over-year growth 2024-2029 (%)
        • Data Table on China - Year-over-year growth 2024-2029 (%)
      • 11.10 Germany - Market size and forecast 2024-2029
        • Chart on Germany - Market size and forecast 2024-2029 ($ million)
        • Data Table on Germany - Market size and forecast 2024-2029 ($ million)
        • Chart on Germany - Year-over-year growth 2024-2029 (%)
        • Data Table on Germany - Year-over-year growth 2024-2029 (%)
      • 11.11 Japan - Market size and forecast 2024-2029
        • Chart on Japan - Market size and forecast 2024-2029 ($ million)
        • Data Table on Japan - Market size and forecast 2024-2029 ($ million)
        • Chart on Japan - Year-over-year growth 2024-2029 (%)
        • Data Table on Japan - Year-over-year growth 2024-2029 (%)
      • 11.12 UK - Market size and forecast 2024-2029
        • Chart on UK - Market size and forecast 2024-2029 ($ million)
        • Data Table on UK - Market size and forecast 2024-2029 ($ million)
        • Chart on UK - Year-over-year growth 2024-2029 (%)
        • Data Table on UK - Year-over-year growth 2024-2029 (%)
      • 11.13 India - Market size and forecast 2024-2029
        • Chart on India - Market size and forecast 2024-2029 ($ million)
        • Data Table on India - Market size and forecast 2024-2029 ($ million)
        • Chart on India - Year-over-year growth 2024-2029 (%)
        • Data Table on India - Year-over-year growth 2024-2029 (%)
      • 11.14 Canada - Market size and forecast 2024-2029
        • Chart on Canada - Market size and forecast 2024-2029 ($ million)
        • Data Table on Canada - Market size and forecast 2024-2029 ($ million)
        • Chart on Canada - Year-over-year growth 2024-2029 (%)
        • Data Table on Canada - Year-over-year growth 2024-2029 (%)
      • 11.15 France - Market size and forecast 2024-2029
        • Chart on France - Market size and forecast 2024-2029 ($ million)
        • Data Table on France - Market size and forecast 2024-2029 ($ million)
        • Chart on France - Year-over-year growth 2024-2029 (%)
        • Data Table on France - Year-over-year growth 2024-2029 (%)
      • 11.16 South Korea - Market size and forecast 2024-2029
        • Chart on South Korea - Market size and forecast 2024-2029 ($ million)
        • Data Table on South Korea - Market size and forecast 2024-2029 ($ million)
        • Chart on South Korea - Year-over-year growth 2024-2029 (%)
        • Data Table on South Korea - Year-over-year growth 2024-2029 (%)
      • 11.17 Italy - Market size and forecast 2024-2029
        • Chart on Italy - Market size and forecast 2024-2029 ($ million)
        • Data Table on Italy - Market size and forecast 2024-2029 ($ million)
        • Chart on Italy - Year-over-year growth 2024-2029 (%)
        • Data Table on Italy - Year-over-year growth 2024-2029 (%)
      • 11.18 Market opportunity by geography
        • Market opportunity by geography ($ million)
        • Data Tables on Market opportunity by geography ($ million)

      12 Drivers, Challenges, and Opportunity/Restraints

      • 12.1 Market drivers
        • 12.2 Market challenges
          • 12.3 Impact of drivers and challenges
            • Impact of drivers and challenges in 2024 and 2029
          • 12.4 Market opportunities/restraints

            13 Competitive Landscape

            • 13.1 Overview
              • 13.2 Competitive Landscape
                • Overview on criticality of inputs and factors of differentiation
              • 13.3 Landscape disruption
                • Overview on factors of disruption
              • 13.4 Industry risks
                • Impact of key risks on business

              14 Competitive Analysis

              • 14.1 Companies profiled
                • Companies covered
              • 14.2 Company ranking index
                • Company ranking index
              • 14.3 Market positioning of companies
                • Matrix on companies position and classification
              • 14.4 ABB Ltd.
                • ABB Ltd. - Overview
                • ABB Ltd. - Business segments
                • ABB Ltd. - Key news
                • ABB Ltd. - Key offerings
                • ABB Ltd. - Segment focus
                • SWOT
              • 14.5 C3.ai Inc.
                • C3.ai Inc. - Overview
                • C3.ai Inc. - Product / Service
                • C3.ai Inc. - Key news
                • C3.ai Inc. - Key offerings
                • SWOT
              • 14.6 ClairViz Technology Systems Pvt. Ltd.
                • ClairViz Technology Systems Pvt. Ltd. - Overview
                • ClairViz Technology Systems Pvt. Ltd. - Product / Service
                • ClairViz Technology Systems Pvt. Ltd. - Key offerings
                • SWOT
              • 14.7 DB E.C.O. Group
                • DB E.C.O. Group - Overview
                • DB E.C.O. Group - Product / Service
                • DB E.C.O. Group - Key offerings
                • SWOT
              • 14.8 DINGO Software Pty. Ltd.
                • DINGO Software Pty. Ltd. - Overview
                • DINGO Software Pty. Ltd. - Product / Service
                • DINGO Software Pty. Ltd. - Key offerings
                • SWOT
              • 14.9 GE Vernova Inc.
                • GE Vernova Inc. - Overview
                • GE Vernova Inc. - Product / Service
                • GE Vernova Inc. - Key offerings
                • SWOT
              • 14.10 Honeywell International Inc.
                • Honeywell International Inc. - Overview
                • Honeywell International Inc. - Business segments
                • Honeywell International Inc. - Key news
                • Honeywell International Inc. - Key offerings
                • Honeywell International Inc. - Segment focus
                • SWOT
              • 14.11 International Business Machines Corp.
                • International Business Machines Corp. - Overview
                • International Business Machines Corp. - Business segments
                • International Business Machines Corp. - Key news
                • International Business Machines Corp. - Key offerings
                • International Business Machines Corp. - Segment focus
                • SWOT
              • 14.12 KCF Technologies Inc.
                • KCF Technologies Inc. - Overview
                • KCF Technologies Inc. - Product / Service
                • KCF Technologies Inc. - Key offerings
                • SWOT
              • 14.13 Machinestalk
                • Machinestalk - Overview
                • Machinestalk - Product / Service
                • Machinestalk - Key offerings
                • SWOT
              • 14.14 PTC Inc.
                • PTC Inc. - Overview
                • PTC Inc. - Business segments
                • PTC Inc. - Key news
                • PTC Inc. - Key offerings
                • PTC Inc. - Segment focus
                • SWOT
              • 14.15 Radix U.S. LLC.
                • Radix U.S. LLC. - Overview
                • Radix U.S. LLC. - Product / Service
                • Radix U.S. LLC. - Key offerings
                • SWOT
              • 14.16 SAP SE
                • SAP SE - Overview
                • SAP SE - Business segments
                • SAP SE - Key news
                • SAP SE - Key offerings
                • SAP SE - Segment focus
                • SWOT
              • 14.17 Siemens AG
                • Siemens AG - Overview
                • Siemens AG - Business segments
                • Siemens AG - Key news
                • Siemens AG - Key offerings
                • Siemens AG - Segment focus
                • SWOT
              • 14.18 Uptake Technologies Inc.
                • Uptake Technologies Inc. - Overview
                • Uptake Technologies Inc. - Product / Service
                • Uptake Technologies Inc. - Key offerings
                • SWOT

              15 Appendix

              • 15.1 Scope of the report
                • 15.2 Inclusions and exclusions checklist
                  • Inclusions checklist
                  • Exclusions checklist
                • 15.3 Currency conversion rates for US$
                  • Currency conversion rates for US$
                • 15.4 Research methodology
                  • Research methodology
                • 15.5 Data procurement
                  • Information sources
                • 15.6 Data validation
                  • Data validation
                • 15.7 Validation techniques employed for market sizing
                  • Validation techniques employed for market sizing
                • 15.8 Data synthesis
                  • Data synthesis
                • 15.9 360 degree market analysis
                  • 360 degree market analysis
                • 15.10 List of abbreviations
                  • List of abbreviations

                Research Methodology

                Technavio presents a detailed picture of the market by way of study, synthesis, and summation of data from multiple sources. The analysts have presented the various facets of the market with a particular focus on identifying the key industry influencers. The data thus presented is comprehensive, reliable, and the result of extensive research, both primary and secondary.

                INFORMATION SOURCES

                Primary sources

                • Manufacturers and suppliers
                • Channel partners
                • Industry experts
                • Strategic decision makers

                Secondary sources

                • Industry journals and periodicals
                • Government data
                • Financial reports of key industry players
                • Historical data
                • Press releases

                DATA ANALYSIS

                Data Synthesis

                • Collation of data
                • Estimation of key figures
                • Analysis of derived insights

                Data Validation

                • Triangulation with data models
                • Reference against proprietary databases
                • Corroboration with industry experts

                REPORT WRITING

                Qualitative

                • Market drivers
                • Market challenges
                • Market trends
                • Five forces analysis

                Quantitative

                • Market size and forecast
                • Market segmentation
                • Geographical insights
                • Competitive landscape

                Interested in this report?

                Get your sample now to see our research methodology and insights!

                Download Now

                Frequently Asked Questions

                Ai In Predictive Maintenance market growth will increase by $ 988.6 mn during 2025-2029.

                The Ai In Predictive Maintenance market is expected to grow at a CAGR of 17% during 2025-2029.

                Ai In Predictive Maintenance market is segmented by End-user( Manufacturing, Energy and utilities, Oil and gas, Automotive, Others) Solution( Integrated solutions, Standalone solutions)

                ABB Ltd., C3.ai Inc., ClairViz Technology Systems Pvt. Ltd., DB E.C.O. Group, DINGO Software Pty. Ltd., ExactSpace, Faclon Labs Pvt. Ltd., GE Vernova Inc., Honeywell International Inc., International Business Machines Corp., KCF Technologies Inc., Machinestalk, PTC Inc., Radix U.S. LLC., SAP SE, Siemens AG, Uptake Technologies Inc. are a few of the key vendors in the Ai In Predictive Maintenance market.

                North America will register the highest growth rate of 38% among the other regions. Therefore, the Ai In Predictive Maintenance market in North America is expected to garner significant business opportunities for the vendors during the forecast period.

                US, China, Germany, Japan, UK, India, Canada, France, South Korea, Italy

                • Launch of new solutionsThe global AI in predictive maintenance market is experiencing robust growth is the driving factor this market.
                • driven by the continuous launch of innovative solutions designed to enhance operational efficiency and minimize downtime. A key driver of this growth is the introduction of new AI-driven products that offer advanced capabilities for predicting maintenance needs and identifying potential issues before they escalate into significant problems.In July 2024 is the driving factor this market.
                • a notable development in this space was the launch of a new product by Guidewheel is the driving factor this market.
                • Scout. This cutting-edge solution is designed to assist manufacturers in predicting maintenance requirements and detecting early warning signs of potential issues. By continuously analyzing machine performance data is the driving factor this market.
                • Scout can identify anomalies and promptly alert maintenance teams to address these issues before they lead to costly downtime or equipment failure. The introduction of Scout exemplifies the focus of the industry on leveraging AI to provide real-time insights into machine health. This proactive approach allows manufacturers to optimize their maintenance schedules is the driving factor this market.
                • reduce unexpected breakdowns is the driving factor this market.
                • and extend the lifespan of their equipment. The ability to detect and address issues early not only enhances operational efficiency but also contributes to significant cost savings.The launch of new AI-driven solutions such as Scout is a testament to the ongoing innovation within the global AI in the predictive maintenance market. These advancements are crucial in meeting the growing demand for more reliable and efficient maintenance strategies. As more companies recognize the benefits of AI in predictive maintenance is the driving factor this market.
                • the market is expected to witness increased adoption of these technologies.Overall is the driving factor this market.
                • the continuous introduction of new AI solutions is a major driver of growth in the global AI in predictive maintenance market These innovations are transforming how companies approach maintenance is the driving factor this market.
                • enabling them to operate more efficiently and effectively. As the market evolves is the driving factor this market.
                • further advancements will continue to push the boundaries of what is possible with AI in predictive maintenance. is the driving factor this market.

                The Ai In Predictive Maintenance market vendors should focus on grabbing business opportunities from the Manufacturing segment as it accounted for the largest market share in the base year.