AI Trust, Risk And Security Management Market Analysis, Size, and Forecast 2025-2029: North America (US and Canada), Europe (France, Germany, and UK), APAC (Australia, China, India, Japan, and South Korea), and Rest of World (ROW)

AI Trust, Risk And Security Management Market Analysis, Size, and Forecast 2025-2029:
North America (US and Canada), Europe (France, Germany, and UK), APAC (Australia, China, India, Japan, and South Korea), and Rest of World (ROW)

Published: Jul 2025 262 Pages SKU: IRTNTR80724

Market Overview at a Glance

$4.29 B
Market Opportunity
26.4%
CAGR
25.1
YoY growth 2024-2025(%)

AI Trust, Risk And Security Management Market Size 2025-2029

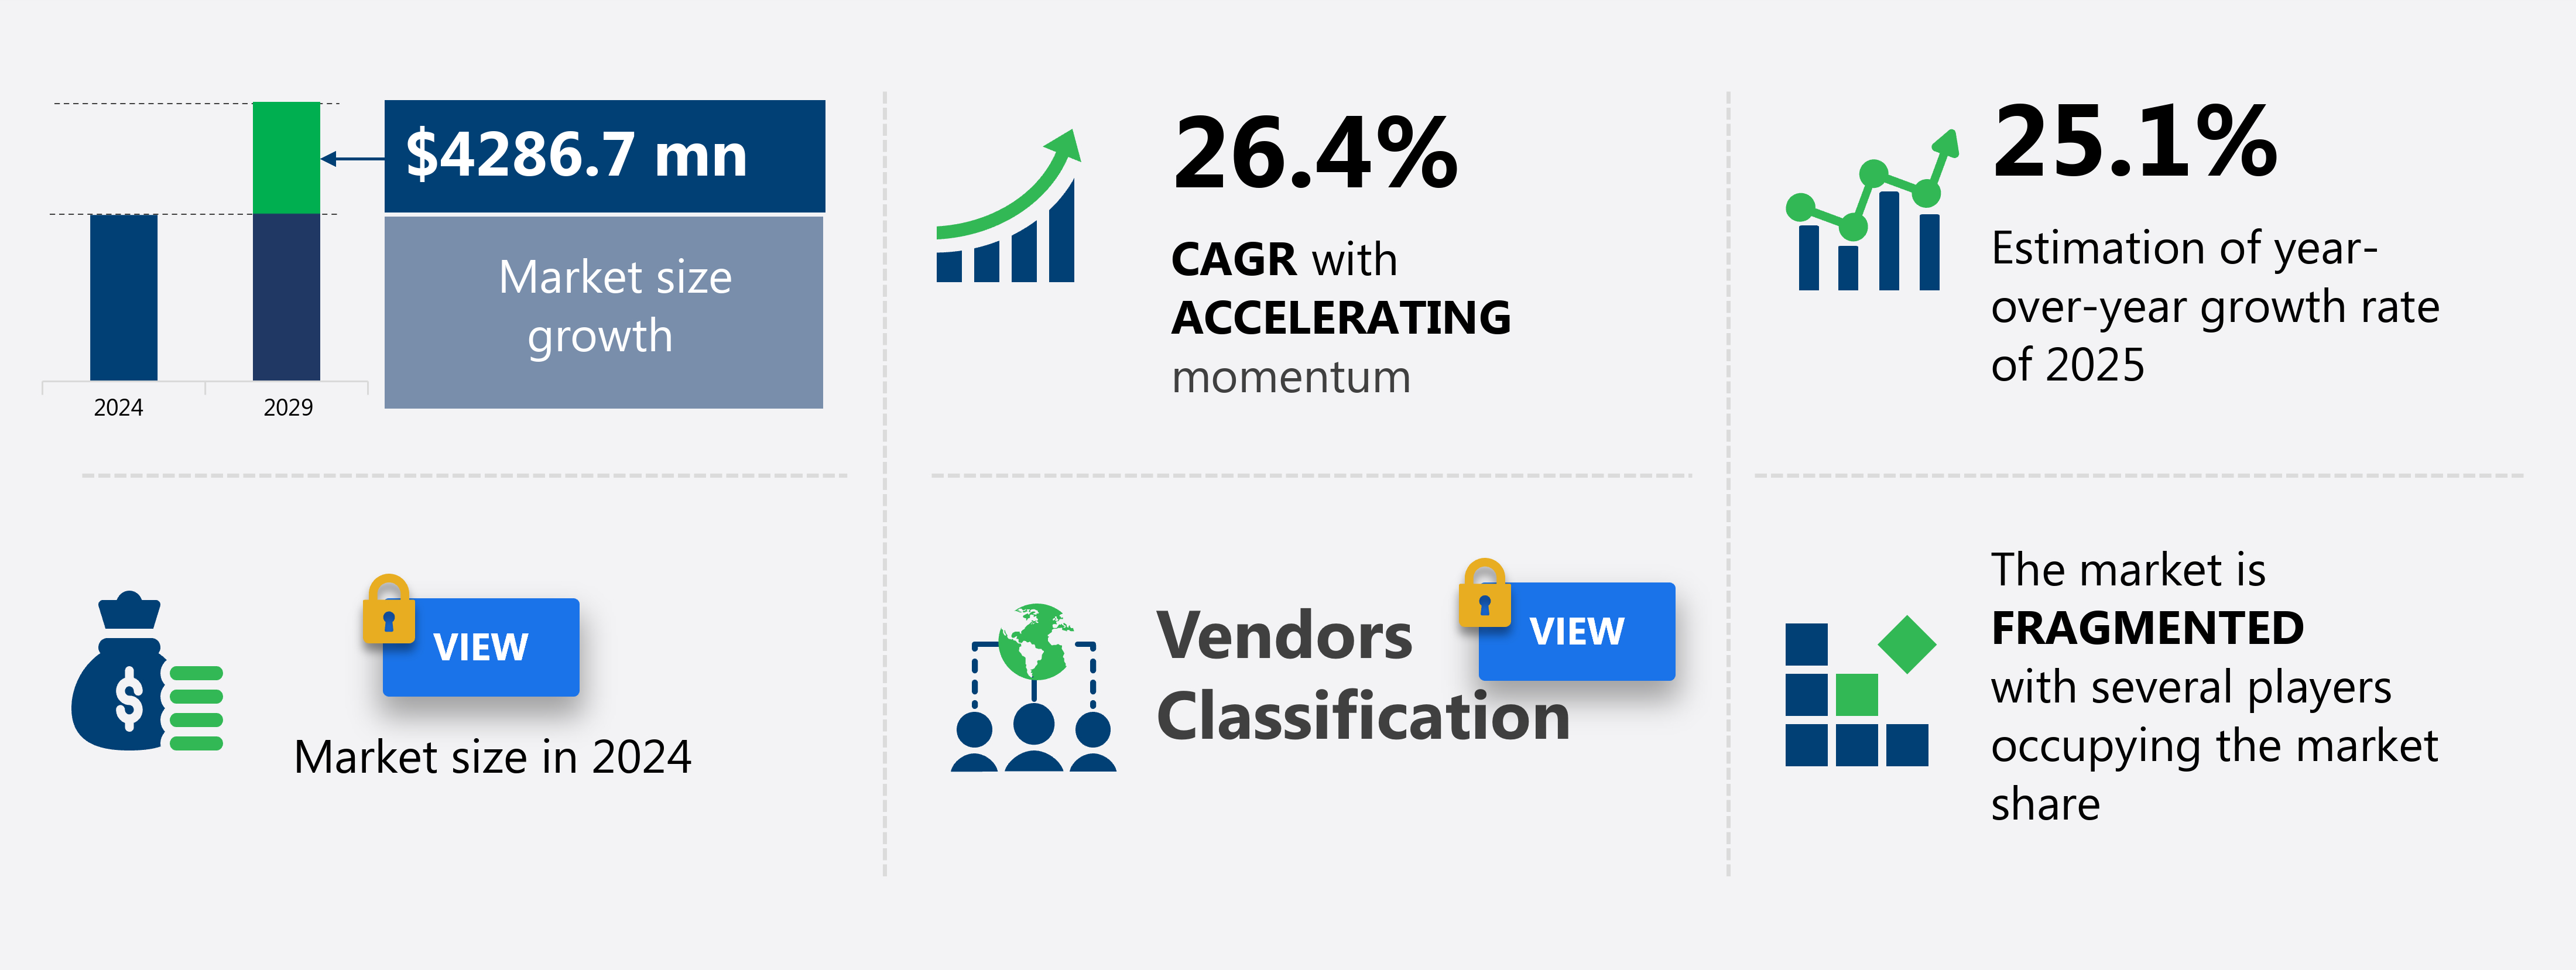
The AI trust, risk and security management market size is forecast to increase by USD 4.29 billion, at a CAGR of 26.4% between 2024 and 2029.

  • The AI Trust, Risk, and Security Management Market is experiencing significant growth, driven by escalating regulatory scrutiny and the push for standardized governance. As global regulatory frameworks continue to mandate accountability for AI systems, organizations are increasingly focusing on implementing robust trust, risk, and security management solutions. However, challenges persist in the form of intensifying regulatory complexity and the emergence of Shadow AI, which can operate outside of established governance frameworks. Data security and privacy remain paramount, with cloud computing and edge computing solutions offering secure alternatives.
  • Companies seeking to capitalize on market opportunities and navigate these challenges effectively must prioritize the development and implementation of agile, adaptive, and accountable AI governance frameworks. By addressing these challenges, organizations can build trust with stakeholders, mitigate risks, and enhance the overall security of their AI systems. Furthermore, the lack of visibility into AI decision-making processes poses a significant challenge, requiring advanced monitoring and transparency capabilities. ML models are being applied across various sectors, from fraud detection and sales forecasting to speech recognition and image recognition.

What will be the Size of the AI Trust, Risk And Security Management Market during the forecast period?

AI Trust, Risk And Security Management Market Size

Explore in-depth regional segment analysis with market size data - historical 2019-2023 and forecasts 2025-2029 - in the full report.   
Request Free Sample

The market for AI trust, risk, and security management continues to evolve, with applications spanning various sectors from finance to healthcare and manufacturing. Authorization protocols and access control lists are essential components of AI governance frameworks, ensuring secure data access. Data privacy regulations, such as GDPR and HIPAA, mandate model explainability and AI ethics training to maintain transparency and accountability. AI risk scoring and security incident response are crucial elements of an effective risk management framework. A recent study revealed a 67% increase in security incidents related to AI systems in the past year. Data breach response and data loss prevention strategies are vital for minimizing the impact of such incidents.

AI system resilience and cybersecurity standards, including AI explainability tools and incident management, help organizations mitigate risks and ensure trust and safety. Business impact analysis, AI model monitoring, and risk register are integral parts of proactive risk management. AI bias mitigation and model retraining are essential for maintaining fairness and accuracy in AI systems. Information security management, including data masking methods and authentication protocols, further strengthens the security posture. The AI trust, risk, and security management market is expected to grow by over 20% in the next five years, reflecting the ongoing demand for robust security solutions. Quantum computing and cognitive computing are emerging trends, offering faster processing power and advanced reasoning capabilities.

How is this AI Trust, Risk And Security Management Market segmented?

The AI trust, risk and security management market research report provides comprehensive data (region-wise segment analysis), with forecasts and estimates in "USD million" for the period 2025-2029, as well as historical data from 2019-2023 for the following segments.
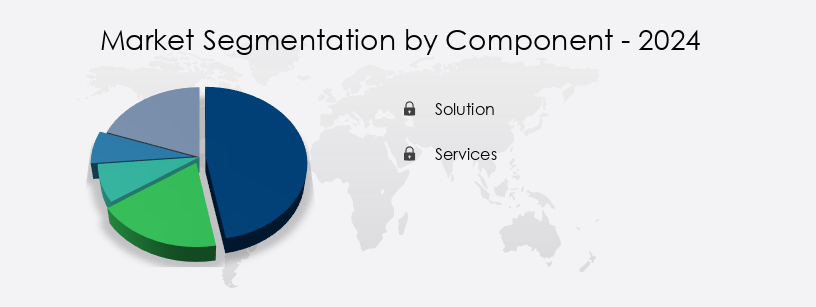
  • Component
    • Solution
    • Services
  • Deployment
    • On-premises
    • Cloud
  • Sector
    • Large enterprises
    • SMEs
  • Application
    • Explainability
    • ModelOps
    • Data anomaly detection
    • Data protection
    • AI app security
  • End-user
    • IT and Telecom
    • BFSI
    • E-commerce
    • Healthcare
    • Others
  • Geography
    • North America
      • US
      • Canada
    • Europe
      • France
      • Germany
      • UK
    • APAC
      • Australia
      • China
      • India
      • Japan
      • South Korea
    • Rest of World (ROW)

By Component Insights

The Solution segment is estimated to witness significant growth during the forecast period. The AI trust, risk, and security management market is witnessing significant growth as organizations recognize the importance of responsible AI initiatives. Solutions in this market, including AI fairness metrics, incident response planning, risk assessment models, AI risk scoring, AI security testing, AI model validation, intrusion detection systems, data anonymization techniques, data provenance tracking, threat intelligence platforms, data encryption methods, and more, form the foundation for operationalizing ethical AI principles. The market's expansion is fueled by several factors, including the increasing use of powerful yet complex AI models, a growing regulatory landscape, and heightened awareness among C-suite executives about the potential risks associated with unmanaged AI. Machine learning, computer vision, speech recognition, and image recognition are integral components of cloud AI, driving innovation in various sectors.

The AI Trust, Risk and Security Management Market is expanding as enterprises prioritize AI governance framework to ensure ethical and compliant AI use. Solutions now integrate access control list protocols and robust security architecture to safeguard systems. Continuous AI model retraining and AI system governance support adaptability and regulatory alignment. Rising demand for cloud-based applications highlights the need for AI-driven cybersecurity solutions to protect cloud environments from advanced cyberattacks. Key components include data retention policies, a defined risk appetite statement, and advanced AI auditing tools for transparency. Organizations are adopting AI explainability methods and rigorous AI auditing procedures to enhance trust.

These risks encompass business continuity and brand reputation, making it crucial for enterprises to invest in robust AI trust, risk, and security management solutions. Additionally, the market is influenced by cybersecurity frameworks, security awareness training, compliance frameworks, privacy enhancing technologies, ethical AI guidelines, vulnerability management systems, model risk management, model transparency techniques, AI bias detection, regulatory compliance, algorithmic accountability, and AI ethics frameworks. Semantic reasoning and predictive analytics are transforming decision making, while AI-powered chatbots and virtual assistants enhance customer service.

AI Trust, Risk And Security Management Market Share by Component

Get a glance at the market share of various segments Request Free Sample

Regional Analysis

APAC is estimated to contribute 35% to the growth of the global market during the forecast period. Technavio's analysts have elaborately explained the regional trends and drivers that shape the market during the forecast period.

AI Trust, Risk And Security Management Market Share by Geography

 Request Free Sample

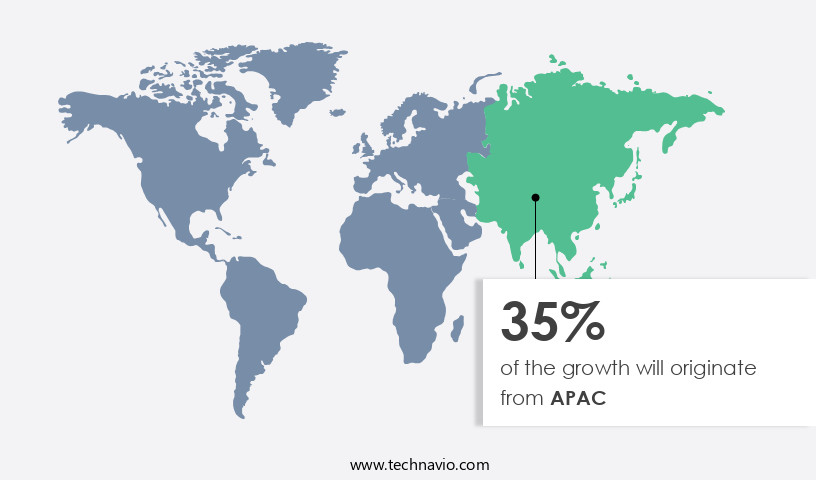
The North American market for AI trust, risk, and security management leads the global landscape, driven by a high concentration of AI technology developers, substantial enterprise-level adoption, significant investment in research, and a proactive regulatory environment. The United States, with its robust technology sector in Silicon Valley and other hubs, serves as the epicenter of innovation and demand. AI is extensively deployed across industries such as finance, business continuity management, risk mitigation strategies, access control policies, data governance frameworks, data security protocols, auditing procedures, explainability methods, data breach prevention, responsible development, model transparency techniques, bias detection, regulatory compliance, algorithmic accountability, and ethics frameworks.

These solutions are integral to ensuring AI systems operate fairly, securely, and ethically, mitigating risks, and maintaining compliance with evolving regulations. Moreover, the development of hybrid cloud solutions, which can access videos from both the internet and digital video broadcasting, is a significant innovation. Ensuring AI system reliability is central to managing operational risks. Emphasis on responsible AI development is reshaping corporate strategies to balance innovation with accountability in this critical and evolving domain.

Market Dynamics

Our researchers analyzed the data with 2024 as the base year, along with the key drivers, trends, and challenges. A holistic analysis of drivers will help companies refine their marketing strategies to gain a competitive advantage.

What are the key market drivers leading to the rise in the adoption of AI Trust, Risk And Security Management Industry?

  • The escalating regulatory scrutiny and push for standardized governance are primary factors driving market growth and shaping industry trends. The AI trust, risk, and security management (AI TRiSM) market is experiencing significant growth due to the increasing regulatory pressure on organizations to adopt structured approaches to managing the risks associated with artificial intelligence. For instance, a leading financial services firm reported a 35% increase in sales after implementing an AI TRiSM solution to meet new regulatory requirements.
  • The AI TRiSM market is expected to grow by over 20% in the next five years, reflecting the increasing importance of demonstrable AI governance in a rapidly evolving regulatory landscape. Governments and international bodies are transitioning from ethical guidelines to enforceable laws, leading to a rise in demand for AI TRiSM solutions. These tools enable organizations to ensure compliance, conduct audits, and generate reports, making them essential for operational and legal necessity.

What are the market trends shaping the AI Trust, Risk And Security Management Industry?

  • The trend in the global market is toward more stringent regulatory frameworks mandating accountability for artificial intelligence (AI) systems. This intensifying regulatory landscape is a significant development for businesses and organizations implementing AI technologies. The AI trust, risk, and security management market is experiencing a rise due to the intensifying regulatory landscape for artificial intelligence systems. The high stakes of noncompliance, including substantial financial penalties, reputational damage, and loss of market access, make investment in TRiSM a strategic imperative.
  • According to recent research, the global AI market in risk management is expected to grow by 25% in the next year. This growth underscores the market's significance as organizations increasingly rely on AI to manage their risks and maintain regulatory compliance. Governments and international bodies are moving from ethical guidelines to enacting concrete legislation, creating a complex compliance landscape. This shift from principles to legal obligations necessitates robust TRiSM solutions for organizations, making AI governance a critical component of risk management.

What challenges does the AI Trust, Risk And Security Management Industry face during its growth?

  • The integration of advanced technologies like Shadow AI into industries is crucial for growth, but the lack of transparency and visibility in their implementation poses a significant challenge. The global AI trust, risk, and security management market faces a significant challenge with the emergence of shadow AI systems, which are developed or deployed without proper oversight or governance. These unauthorized models pose substantial risks as they bypass organizational protocols, operating outside the purview of risk management and compliance teams. Neural networks and machine translation have revolutionized the education sector, providing personalized learning experiences and improving language translation services.
  • Organizations find it difficult to maintain a comprehensive inventory of AI assets, assess their risk profiles, or ensure alignment with ethical and regulatory standards. This statistic underscores the need for effective AI trust, risk, and security management strategies to mitigate these risks and ensure the ethical and compliant use of AI technology within organizations. Consequences of this lack of visibility can include the use of sensitive data, unvalidated outputs, and integration with critical infrastructure without adequate safeguards. The challenge is amplified by the decentralized nature of AI development, where business units or individual developers can easily access open-source models and cloud-based tools.

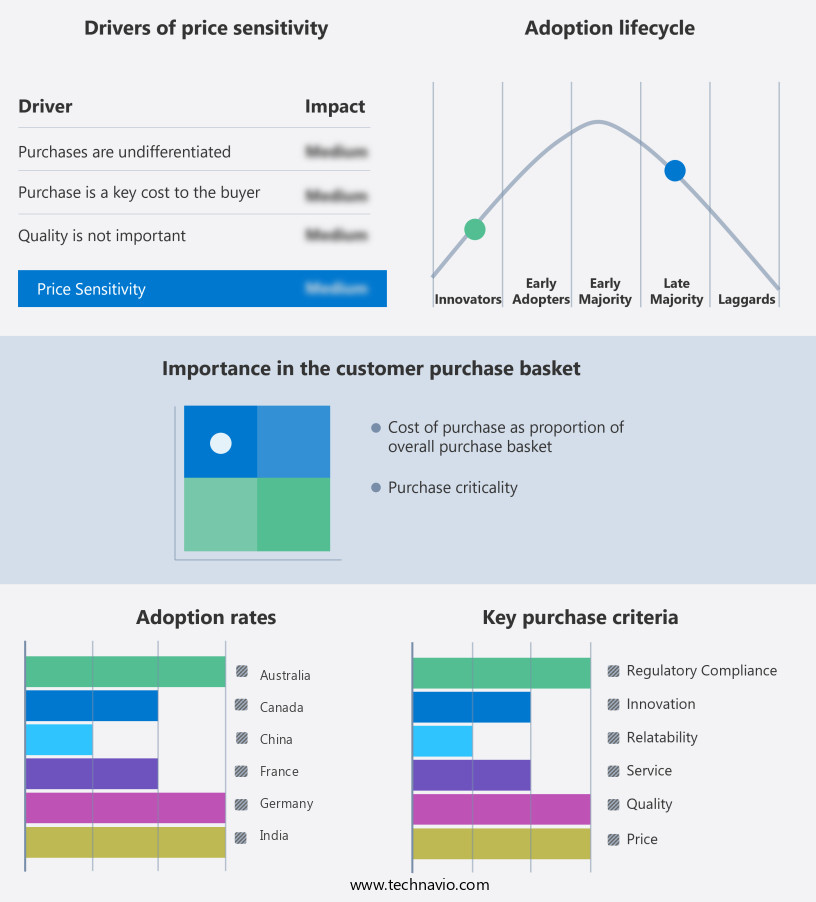
Exclusive Customer Landscape

The AI trust, risk and security management market forecasting report includes the adoption lifecycle of the market, covering from the innovator's stage to the laggard's stage. It focuses on adoption rates in different regions based on penetration. Furthermore, the AI trust, risk and security management market report also includes key purchase criteria and drivers of price sensitivity to help companies evaluate and develop their market growth analysis strategies.

AI Trust, Risk And Security Management Market Share by Geography

 Customer Landscape

Key Companies & Market Insights

Companies are implementing various strategies, such as strategic alliances, AI trust, risk and security management market forecast, partnerships, mergers and acquisitions, geographical expansion, and product/service launches, to enhance their presence in the industry.

Accenture PLC - The company specializes in AI trust, risk, and security management services.

The industry research and growth report includes detailed analyses of the competitive landscape of the market and information about key companies, including:

  • Accenture PLC
  • Balbix Inc.
  • BigID Inc.
  • ComplyAdvantage
  • CrowdStrike Inc.
  • Darktrace Holdings Ltd.
  • Datasunrise
  • Fortinet Inc.
  • Google LLC
  • Holistic AI Inc
  • International Business Machines Corp.
  • Microsoft Corp.
  • OneTrust LLC
  • Oracle Corp.
  • Palantir Technologies Inc.
  • Palo Alto Networks Inc.
  • SAS Institute Inc.
  • Securiti, Inc
  • ValidMind Inc.
  • Wiz Inc.

Qualitative and quantitative analysis of companies has been conducted to help clients understand the wider business environment as well as the strengths and weaknesses of key industry players. Data is qualitatively analyzed to categorize companies as pure play, category-focused, industry-focused, and diversified; it is quantitatively analyzed to categorize companies as dominant, leading, strong, tentative, and weak.

Recent Development and News in AI Trust, Risk And Security Management Market

  • In January 2024, IBM announced the launch of its new AI-powered security information and event management (SIEM) system, IBM QRadar Advisor with Watson, designed to enhance threat detection and response using advanced AI and machine learning algorithms (IBM Press Release).
  • In March 2024, Microsoft and Accenture entered into a strategic partnership to develop and implement AI-driven security solutions for enterprise clients, combining Microsoft's Azure AI capabilities with Accenture's security services (Microsoft News Center).
  • In May 2024, Darktrace, a leading AI cybersecurity company, raised USD 100 million in a Series E funding round, bringing its total funding to USD 300 million, to expand its global presence and accelerate product development (Darktrace Press Release).
  • In February 2025, the European Union's General Data Protection Regulation (GDPR) was updated to include provisions for AI accountability and transparency, requiring organizations to explain how AI systems make decisions that impact individuals (European Commission Press Release).

Research Analyst Overview

The market for AI trust, risk, and security management continues to evolve, with applications spanning various sectors from finance to healthcare and manufacturing. Authorization protocols and access control lists are essential components of AI governance frameworks, ensuring secure data access. Data privacy regulations, such as GDPR and HIPAA, mandate model explainability and AI ethics training to maintain transparency and accountability. AI risk scoring and security incident response are crucial elements of an effective risk management framework. A recent study revealed a 67% increase in security incidents related to AI systems in the past year. Data breach response and data loss prevention strategies are vital for minimizing the impact of such incidents.

AI system resilience and cybersecurity standards, including AI explainability tools and incident management, help organizations mitigate risks and ensure trust and safety. Business impact analysis, AI model monitoring, and risk register are integral parts of proactive risk management. AI bias mitigation and model retraining are essential for maintaining fairness and accuracy in AI systems. Information security management, including data masking methods and authentication protocols, further strengthens the security posture. The AI trust, risk, and security management market is expected to grow by over 20% in the next five years, reflecting the ongoing demand for robust security solutions.

Dive into Technavio's robust research methodology, blending expert interviews, extensive data synthesis, and validated models for unparalleled AI Trust, Risk And Security Management Market insights. See full methodology.


Market Scope

Report Coverage

Details

Page number

262

Base year

2024

Historic period

2019-2023

Forecast period

2025-2029

Growth momentum & CAGR

Accelerate at a CAGR of 26.4%

Market growth 2025-2029

USD 4.29 billion

Market structure

Fragmented

YoY growth 2024-2025(%)

25.1

Key countries

China, South Korea, Japan, India, Australia, Germany, UK, France, US, and Canada

Competitive landscape

Leading Companies, Market Positioning of Companies, Competitive Strategies, and Industry Risks

Request Free Sample

What are the Key Data Covered in this AI Trust, Risk And Security Management Market Research and Growth Report?

  • CAGR of the AI Trust, Risk And Security Management industry during the forecast period
  • Detailed information on factors that will drive the growth and forecasting between 2025 and 2029
  • Precise estimation of the size of the market and its contribution of the industry in focus to the parent market
  • Accurate predictions about upcoming growth and trends and changes in consumer behaviour
  • Growth of the market across North America, APAC, Europe, South America, and Middle East and Africa
  • Thorough analysis of the market's competitive landscape and detailed information about companies
  • Comprehensive analysis of factors that will challenge the AI trust, risk and security management market growth of industry companies

We can help! Our analysts can customize this AI trust, risk and security management market research report to meet your requirements.

Get in touch

1 Executive Summary

  • 1.1 Market overview
    • Executive Summary - Chart on Market Overview
    • Executive Summary - Data Table on Market Overview
    • Executive Summary - Chart on Global Market Characteristics
    • Executive Summary - Chart on Market by Geography
    • Executive Summary - Chart on Market Segmentation by Component
    • Executive Summary - Chart on Market Segmentation by Deployment
    • Executive Summary - Chart on Market Segmentation by Sector
    • Executive Summary - Chart on Market Segmentation by Application
    • Executive Summary - Chart on Market Segmentation by End-user
    • Executive Summary - Chart on Incremental Growth
    • Executive Summary - Data Table on Incremental Growth
    • Executive Summary - Chart on Company Market Positioning

2 Technavio Analysis

  • 2.1 Analysis of price sensitivity, lifecycle, customer purchase basket, adoption rates, and purchase criteria
    • Analysis of price sensitivity, lifecycle, customer purchase basket, adoption rates, and purchase criteria
  • 2.2 Criticality of inputs and Factors of differentiation
    • Overview on criticality of inputs and factors of differentiation
  • 2.3 Factors of disruption
    • Overview on factors of disruption
  • 2.4 Impact of drivers and challenges
    • Impact of drivers and challenges in 2024 and 2029

3 Market Landscape

  • 3.1 Market ecosystem
    • Parent Market
    • Data Table on - Parent Market
  • 3.2 Market characteristics
    • Market characteristics analysis
  • 3.3 Value chain analysis
    • Value chain analysis

4 Market Sizing

  • 4.1 Market definition
    • Offerings of companies included in the market definition
  • 4.2 Market segment analysis
    • Market segments
  • 4.3 Market size 2024
    • 4.4 Market outlook: Forecast for 2024-2029
      • Chart on Global - Market size and forecast 2024-2029 ($ million)
      • Data Table on Global - Market size and forecast 2024-2029 ($ million)
      • Chart on Global Market: Year-over-year growth 2024-2029 (%)
      • Data Table on Global Market: Year-over-year growth 2024-2029 (%)

    5 Five Forces Analysis

    • 5.1 Five forces summary
      • Five forces analysis - Comparison between 2024 and 2029
    • 5.2 Bargaining power of buyers
      • Bargaining power of buyers - Impact of key factors 2024 and 2029
    • 5.3 Bargaining power of suppliers
      • Bargaining power of suppliers - Impact of key factors in 2024 and 2029
    • 5.4 Threat of new entrants
      • Threat of new entrants - Impact of key factors in 2024 and 2029
    • 5.5 Threat of substitutes
      • Threat of substitutes - Impact of key factors in 2024 and 2029
    • 5.6 Threat of rivalry
      • Threat of rivalry - Impact of key factors in 2024 and 2029
    • 5.7 Market condition
      • Chart on Market condition - Five forces 2024 and 2029

    6 Market Segmentation by Component

    • 6.1 Market segments
      • Chart on Component - Market share 2024-2029 (%)
      • Data Table on Component - Market share 2024-2029 (%)
    • 6.2 Comparison by Component
      • Chart on Comparison by Component
      • Data Table on Comparison by Component
    • 6.3 Solution - Market size and forecast 2024-2029
      • Chart on Solution - Market size and forecast 2024-2029 ($ million)
      • Data Table on Solution - Market size and forecast 2024-2029 ($ million)
      • Chart on Solution - Year-over-year growth 2024-2029 (%)
      • Data Table on Solution - Year-over-year growth 2024-2029 (%)
    • 6.4 Services - Market size and forecast 2024-2029
      • Chart on Services - Market size and forecast 2024-2029 ($ million)
      • Data Table on Services - Market size and forecast 2024-2029 ($ million)
      • Chart on Services - Year-over-year growth 2024-2029 (%)
      • Data Table on Services - Year-over-year growth 2024-2029 (%)
    • 6.5 Market opportunity by Component
      • Market opportunity by Component ($ million)
      • Data Table on Market opportunity by Component ($ million)

    7 Market Segmentation by Deployment

    • 7.1 Market segments
      • Chart on Deployment - Market share 2024-2029 (%)
      • Data Table on Deployment - Market share 2024-2029 (%)
    • 7.2 Comparison by Deployment
      • Chart on Comparison by Deployment
      • Data Table on Comparison by Deployment
    • 7.3 On-premises - Market size and forecast 2024-2029
      • Chart on On-premises - Market size and forecast 2024-2029 ($ million)
      • Data Table on On-premises - Market size and forecast 2024-2029 ($ million)
      • Chart on On-premises - Year-over-year growth 2024-2029 (%)
      • Data Table on On-premises - Year-over-year growth 2024-2029 (%)
    • 7.4 Cloud - Market size and forecast 2024-2029
      • Chart on Cloud - Market size and forecast 2024-2029 ($ million)
      • Data Table on Cloud - Market size and forecast 2024-2029 ($ million)
      • Chart on Cloud - Year-over-year growth 2024-2029 (%)
      • Data Table on Cloud - Year-over-year growth 2024-2029 (%)
    • 7.5 Market opportunity by Deployment
      • Market opportunity by Deployment ($ million)
      • Data Table on Market opportunity by Deployment ($ million)

    8 Market Segmentation by Sector

    • 8.1 Market segments
      • Chart on Sector - Market share 2024-2029 (%)
      • Data Table on Sector - Market share 2024-2029 (%)
    • 8.2 Comparison by Sector
      • Chart on Comparison by Sector
      • Data Table on Comparison by Sector
    • 8.3 Large enterprises - Market size and forecast 2024-2029
      • Chart on Large enterprises - Market size and forecast 2024-2029 ($ million)
      • Data Table on Large enterprises - Market size and forecast 2024-2029 ($ million)
      • Chart on Large enterprises - Year-over-year growth 2024-2029 (%)
      • Data Table on Large enterprises - Year-over-year growth 2024-2029 (%)
    • 8.4 SMEs - Market size and forecast 2024-2029
      • Chart on SMEs - Market size and forecast 2024-2029 ($ million)
      • Data Table on SMEs - Market size and forecast 2024-2029 ($ million)
      • Chart on SMEs - Year-over-year growth 2024-2029 (%)
      • Data Table on SMEs - Year-over-year growth 2024-2029 (%)
    • 8.5 Market opportunity by Sector
      • Market opportunity by Sector ($ million)
      • Data Table on Market opportunity by Sector ($ million)

    9 Market Segmentation by Application

    • 9.1 Market segments
      • Chart on Application - Market share 2024-2029 (%)
      • Data Table on Application - Market share 2024-2029 (%)
    • 9.2 Comparison by Application
      • Chart on Comparison by Application
      • Data Table on Comparison by Application
    • 9.3 Explainability - Market size and forecast 2024-2029
      • Chart on Explainability - Market size and forecast 2024-2029 ($ million)
      • Data Table on Explainability - Market size and forecast 2024-2029 ($ million)
      • Chart on Explainability - Year-over-year growth 2024-2029 (%)
      • Data Table on Explainability - Year-over-year growth 2024-2029 (%)
    • 9.4 ModelOps - Market size and forecast 2024-2029
      • Chart on ModelOps - Market size and forecast 2024-2029 ($ million)
      • Data Table on ModelOps - Market size and forecast 2024-2029 ($ million)
      • Chart on ModelOps - Year-over-year growth 2024-2029 (%)
      • Data Table on ModelOps - Year-over-year growth 2024-2029 (%)
    • 9.5 Data anomaly detection - Market size and forecast 2024-2029
      • Chart on Data anomaly detection - Market size and forecast 2024-2029 ($ million)
      • Data Table on Data anomaly detection - Market size and forecast 2024-2029 ($ million)
      • Chart on Data anomaly detection - Year-over-year growth 2024-2029 (%)
      • Data Table on Data anomaly detection - Year-over-year growth 2024-2029 (%)
    • 9.6 Data protection - Market size and forecast 2024-2029
      • Chart on Data protection - Market size and forecast 2024-2029 ($ million)
      • Data Table on Data protection - Market size and forecast 2024-2029 ($ million)
      • Chart on Data protection - Year-over-year growth 2024-2029 (%)
      • Data Table on Data protection - Year-over-year growth 2024-2029 (%)
    • 9.7 AI app security - Market size and forecast 2024-2029
      • Chart on AI app security - Market size and forecast 2024-2029 ($ million)
      • Data Table on AI app security - Market size and forecast 2024-2029 ($ million)
      • Chart on AI app security - Year-over-year growth 2024-2029 (%)
      • Data Table on AI app security - Year-over-year growth 2024-2029 (%)
    • 9.8 Market opportunity by Application
      • Market opportunity by Application ($ million)
      • Data Table on Market opportunity by Application ($ million)

    10 Market Segmentation by End-user

    • 10.1 Market segments
      • Chart on End-user - Market share 2024-2029 (%)
      • Data Table on End-user - Market share 2024-2029 (%)
    • 10.2 Comparison by End-user
      • Chart on Comparison by End-user
      • Data Table on Comparison by End-user
    • 10.3 IT and telecom - Market size and forecast 2024-2029
      • Chart on IT and telecom - Market size and forecast 2024-2029 ($ million)
      • Data Table on IT and telecom - Market size and forecast 2024-2029 ($ million)
      • Chart on IT and telecom - Year-over-year growth 2024-2029 (%)
      • Data Table on IT and telecom - Year-over-year growth 2024-2029 (%)
    • 10.4 BFSI - Market size and forecast 2024-2029
      • Chart on BFSI - Market size and forecast 2024-2029 ($ million)
      • Data Table on BFSI - Market size and forecast 2024-2029 ($ million)
      • Chart on BFSI - Year-over-year growth 2024-2029 (%)
      • Data Table on BFSI - Year-over-year growth 2024-2029 (%)
    • 10.5 E-commerce - Market size and forecast 2024-2029
      • Chart on E-commerce - Market size and forecast 2024-2029 ($ million)
      • Data Table on E-commerce - Market size and forecast 2024-2029 ($ million)
      • Chart on E-commerce - Year-over-year growth 2024-2029 (%)
      • Data Table on E-commerce - Year-over-year growth 2024-2029 (%)
    • 10.6 Healthcare - Market size and forecast 2024-2029
      • Chart on Healthcare - Market size and forecast 2024-2029 ($ million)
      • Data Table on Healthcare - Market size and forecast 2024-2029 ($ million)
      • Chart on Healthcare - Year-over-year growth 2024-2029 (%)
      • Data Table on Healthcare - Year-over-year growth 2024-2029 (%)
    • 10.7 Others - Market size and forecast 2024-2029
      • Chart on Others - Market size and forecast 2024-2029 ($ million)
      • Data Table on Others - Market size and forecast 2024-2029 ($ million)
      • Chart on Others - Year-over-year growth 2024-2029 (%)
      • Data Table on Others - Year-over-year growth 2024-2029 (%)
    • 10.8 Market opportunity by End-user
      • Market opportunity by End-user ($ million)
      • Data Table on Market opportunity by End-user ($ million)

    11 Customer Landscape

    • 11.1 Customer landscape overview
      • Analysis of price sensitivity, lifecycle, customer purchase basket, adoption rates, and purchase criteria

    12 Geographic Landscape

    • 12.1 Geographic segmentation
      • Chart on Market share by geography 2024-2029 (%)
      • Data Table on Market share by geography 2024-2029 (%)
    • 12.2 Geographic comparison
      • Chart on Geographic comparison
      • Data Table on Geographic comparison
    • 12.3 North America - Market size and forecast 2024-2029
      • Chart on North America - Market size and forecast 2024-2029 ($ million)
      • Data Table on North America - Market size and forecast 2024-2029 ($ million)
      • Chart on North America - Year-over-year growth 2024-2029 (%)
      • Data Table on North America - Year-over-year growth 2024-2029 (%)
    • 12.4 APAC - Market size and forecast 2024-2029
      • Chart on APAC - Market size and forecast 2024-2029 ($ million)
      • Data Table on APAC - Market size and forecast 2024-2029 ($ million)
      • Chart on APAC - Year-over-year growth 2024-2029 (%)
      • Data Table on APAC - Year-over-year growth 2024-2029 (%)
    • 12.5 Europe - Market size and forecast 2024-2029
      • Chart on Europe - Market size and forecast 2024-2029 ($ million)
      • Data Table on Europe - Market size and forecast 2024-2029 ($ million)
      • Chart on Europe - Year-over-year growth 2024-2029 (%)
      • Data Table on Europe - Year-over-year growth 2024-2029 (%)
    • 12.6 South America - Market size and forecast 2024-2029
      • Chart on South America - Market size and forecast 2024-2029 ($ million)
      • Data Table on South America - Market size and forecast 2024-2029 ($ million)
      • Chart on South America - Year-over-year growth 2024-2029 (%)
      • Data Table on South America - Year-over-year growth 2024-2029 (%)
    • 12.7 Middle East and Africa - Market size and forecast 2024-2029
      • Chart on Middle East and Africa - Market size and forecast 2024-2029 ($ million)
      • Data Table on Middle East and Africa - Market size and forecast 2024-2029 ($ million)
      • Chart on Middle East and Africa - Year-over-year growth 2024-2029 (%)
      • Data Table on Middle East and Africa - Year-over-year growth 2024-2029 (%)
    • 12.8 US - Market size and forecast 2024-2029
      • Chart on US - Market size and forecast 2024-2029 ($ million)
      • Data Table on US - Market size and forecast 2024-2029 ($ million)
      • Chart on US - Year-over-year growth 2024-2029 (%)
      • Data Table on US - Year-over-year growth 2024-2029 (%)
    • 12.9 China - Market size and forecast 2024-2029
      • Chart on China - Market size and forecast 2024-2029 ($ million)
      • Data Table on China - Market size and forecast 2024-2029 ($ million)
      • Chart on China - Year-over-year growth 2024-2029 (%)
      • Data Table on China - Year-over-year growth 2024-2029 (%)
    • 12.10 Germany - Market size and forecast 2024-2029
      • Chart on Germany - Market size and forecast 2024-2029 ($ million)
      • Data Table on Germany - Market size and forecast 2024-2029 ($ million)
      • Chart on Germany - Year-over-year growth 2024-2029 (%)
      • Data Table on Germany - Year-over-year growth 2024-2029 (%)
    • 12.11 UK - Market size and forecast 2024-2029
      • Chart on UK - Market size and forecast 2024-2029 ($ million)
      • Data Table on UK - Market size and forecast 2024-2029 ($ million)
      • Chart on UK - Year-over-year growth 2024-2029 (%)
      • Data Table on UK - Year-over-year growth 2024-2029 (%)
    • 12.12 South Korea - Market size and forecast 2024-2029
      • Chart on South Korea - Market size and forecast 2024-2029 ($ million)
      • Data Table on South Korea - Market size and forecast 2024-2029 ($ million)
      • Chart on South Korea - Year-over-year growth 2024-2029 (%)
      • Data Table on South Korea - Year-over-year growth 2024-2029 (%)
    • 12.13 Canada - Market size and forecast 2024-2029
      • Chart on Canada - Market size and forecast 2024-2029 ($ million)
      • Data Table on Canada - Market size and forecast 2024-2029 ($ million)
      • Chart on Canada - Year-over-year growth 2024-2029 (%)
      • Data Table on Canada - Year-over-year growth 2024-2029 (%)
    • 12.14 Japan - Market size and forecast 2024-2029
      • Chart on Japan - Market size and forecast 2024-2029 ($ million)
      • Data Table on Japan - Market size and forecast 2024-2029 ($ million)
      • Chart on Japan - Year-over-year growth 2024-2029 (%)
      • Data Table on Japan - Year-over-year growth 2024-2029 (%)
    • 12.15 France - Market size and forecast 2024-2029
      • Chart on France - Market size and forecast 2024-2029 ($ million)
      • Data Table on France - Market size and forecast 2024-2029 ($ million)
      • Chart on France - Year-over-year growth 2024-2029 (%)
      • Data Table on France - Year-over-year growth 2024-2029 (%)
    • 12.16 India - Market size and forecast 2024-2029
      • Chart on India - Market size and forecast 2024-2029 ($ million)
      • Data Table on India - Market size and forecast 2024-2029 ($ million)
      • Chart on India - Year-over-year growth 2024-2029 (%)
      • Data Table on India - Year-over-year growth 2024-2029 (%)
    • 12.17 Australia - Market size and forecast 2024-2029
      • Chart on Australia - Market size and forecast 2024-2029 ($ million)
      • Data Table on Australia - Market size and forecast 2024-2029 ($ million)
      • Chart on Australia - Year-over-year growth 2024-2029 (%)
      • Data Table on Australia - Year-over-year growth 2024-2029 (%)
    • 12.18 Market opportunity by geography
      • Market opportunity by geography ($ million)
      • Data Tables on Market opportunity by geography ($ million)

    13 Drivers, Challenges, and Opportunity/Restraints

    • 13.1 Market drivers
      • 13.2 Market challenges
        • 13.3 Impact of drivers and challenges
          • Impact of drivers and challenges in 2024 and 2029
        • 13.4 Market opportunities/restraints

          14 Competitive Landscape

          • 14.1 Overview
            • 14.2 Competitive Landscape
              • Overview on criticality of inputs and factors of differentiation
            • 14.3 Landscape disruption
              • Overview on factors of disruption
            • 14.4 Industry risks
              • Impact of key risks on business

            15 Competitive Analysis

            • 15.1 Companies profiled
              • Companies covered
            • 15.2 Company ranking index
              • Company ranking index
            • 15.3 Market positioning of companies
              • Matrix on companies position and classification
            • 15.4 Accenture PLC
              • Accenture PLC - Overview
              • Accenture PLC - Business segments
              • Accenture PLC - Key news
              • Accenture PLC - Key offerings
              • Accenture PLC - Segment focus
              • SWOT
            • 15.5 BigID Inc.
              • BigID Inc. - Overview
              • BigID Inc. - Product / Service
              • BigID Inc. - Key offerings
              • SWOT
            • 15.6 ComplyAdvantage
              • ComplyAdvantage - Overview
              • ComplyAdvantage - Product / Service
              • ComplyAdvantage - Key offerings
              • SWOT
            • 15.7 CrowdStrike Inc.
              • CrowdStrike Inc. - Overview
              • CrowdStrike Inc. - Product / Service
              • CrowdStrike Inc. - Key offerings
              • SWOT
            • 15.8 Darktrace Holdings Ltd.
              • Darktrace Holdings Ltd. - Overview
              • Darktrace Holdings Ltd. - Product / Service
              • Darktrace Holdings Ltd. - Key offerings
              • SWOT
            • 15.9 Fortinet Inc.
              • Fortinet Inc. - Overview
              • Fortinet Inc. - Product / Service
              • Fortinet Inc. - Key news
              • Fortinet Inc. - Key offerings
              • SWOT
            • 15.10 Google LLC
              • Google LLC - Overview
              • Google LLC - Product / Service
              • Google LLC - Key offerings
              • SWOT
            • 15.11 Holistic AI Inc
              • Holistic AI Inc - Overview
              • Holistic AI Inc - Product / Service
              • Holistic AI Inc - Key offerings
              • SWOT
            • 15.12 International Business Machines Corp.
              • International Business Machines Corp. - Overview
              • International Business Machines Corp. - Business segments
              • International Business Machines Corp. - Key news
              • International Business Machines Corp. - Key offerings
              • International Business Machines Corp. - Segment focus
              • SWOT
            • 15.13 Microsoft Corp.
              • Microsoft Corp. - Overview
              • Microsoft Corp. - Business segments
              • Microsoft Corp. - Key news
              • Microsoft Corp. - Key offerings
              • Microsoft Corp. - Segment focus
              • SWOT
            • 15.14 OneTrust LLC
              • OneTrust LLC - Overview
              • OneTrust LLC - Product / Service
              • OneTrust LLC - Key offerings
              • SWOT
            • 15.15 Oracle Corp.
              • Oracle Corp. - Overview
              • Oracle Corp. - Business segments
              • Oracle Corp. - Key news
              • Oracle Corp. - Key offerings
              • Oracle Corp. - Segment focus
              • SWOT
            • 15.16 Palantir Technologies Inc.
              • Palantir Technologies Inc. - Overview
              • Palantir Technologies Inc. - Product / Service
              • Palantir Technologies Inc. - Key offerings
              • SWOT
            • 15.17 Palo Alto Networks Inc.
              • Palo Alto Networks Inc. - Overview
              • Palo Alto Networks Inc. - Product / Service
              • Palo Alto Networks Inc. - Key news
              • Palo Alto Networks Inc. - Key offerings
              • SWOT
            • 15.18 SAS Institute Inc.
              • SAS Institute Inc. - Overview
              • SAS Institute Inc. - Product / Service
              • SAS Institute Inc. - Key news
              • SAS Institute Inc. - Key offerings
              • SWOT

            16 Appendix

            • 16.1 Scope of the report
              • 16.2 Inclusions and exclusions checklist
                • Inclusions checklist
                • Exclusions checklist
              • 16.3 Currency conversion rates for US$
                • Currency conversion rates for US$
              • 16.4 Research methodology
                • Research methodology
              • 16.5 Data procurement
                • Information sources
              • 16.6 Data validation
                • Data validation
              • 16.7 Validation techniques employed for market sizing
                • Validation techniques employed for market sizing
              • 16.8 Data synthesis
                • Data synthesis
              • 16.9 360 degree market analysis
                • 360 degree market analysis
              • 16.10 List of abbreviations
                • List of abbreviations

              Research Methodology

              Technavio presents a detailed picture of the market by way of study, synthesis, and summation of data from multiple sources. The analysts have presented the various facets of the market with a particular focus on identifying the key industry influencers. The data thus presented is comprehensive, reliable, and the result of extensive research, both primary and secondary.

              INFORMATION SOURCES

              Primary sources

              • Manufacturers and suppliers
              • Channel partners
              • Industry experts
              • Strategic decision makers

              Secondary sources

              • Industry journals and periodicals
              • Government data
              • Financial reports of key industry players
              • Historical data
              • Press releases

              DATA ANALYSIS

              Data Synthesis

              • Collation of data
              • Estimation of key figures
              • Analysis of derived insights

              Data Validation

              • Triangulation with data models
              • Reference against proprietary databases
              • Corroboration with industry experts

              REPORT WRITING

              Qualitative

              • Market drivers
              • Market challenges
              • Market trends
              • Five forces analysis

              Quantitative

              • Market size and forecast
              • Market segmentation
              • Geographical insights
              • Competitive landscape

              Interested in this report?

              Get your sample now to see our research methodology and insights!

              Download Now

              Frequently Asked Questions

              Ai Trust, Risk And Security Management market growth will increase by $ 4286.7 mn during 2025-2029.

              The Ai Trust, Risk And Security Management market is expected to grow at a CAGR of 26.4% during 2025-2029.

              Ai Trust, Risk And Security Management market is segmented by Component( Solution, Services) Deployment( On-premises, Cloud) Sector( Large enterprises, SMEs)

              Accenture PLC, Balbix Inc., BigID Inc., ComplyAdvantage, CrowdStrike Inc., Darktrace Holdings Ltd., Datasunrise, Fortinet Inc., Google LLC, Holistic AI Inc, International Business Machines Corp., Microsoft Corp., OneTrust LLC, Oracle Corp., Palantir Technologies Inc., Palo Alto Networks Inc., SAS Institute Inc., Securiti, Inc, ValidMind Inc., Wiz Inc. are a few of the key vendors in the Ai Trust, Risk And Security Management market.

              APAC will register the highest growth rate of 35% among the other regions. Therefore, the Ai Trust, Risk And Security Management market in APAC is expected to garner significant business opportunities for the vendors during the forecast period.

              China, South Korea, Japan, India, Australia, Germany, UK, France, US, Canada

              • Escalating regulatory scrutiny and push for standardized governanceA primary and increasingly potent driver for the AI trust is the driving factor this market.
              • risk is the driving factor this market.
              • and security management (AI TRiSM) market is the global surge in legislative and regulatory frameworks governing the development and deployment of artificial intelligence. Governments and international bodies are transitioning from abstract ethical guidelines to enforceable laws is the driving factor this market.
              • compelling organizations to adopt structured approaches to manage AI risks. This regulatory pressure creates a direct and urgent demand for AI TRiSM solutions is the driving factor this market.
              • which provide the necessary tools for compliance is the driving factor this market.
              • auditing is the driving factor this market.
              • and reporting. The era of self-regulation is rapidly concluding is the driving factor this market.
              • replaced by a new paradigm where demonstrable AI governance is a legal and operational necessity. This shift is particularly evident in North America and the Asia Pacific (APAC) region is the driving factor this market.
              • although its influence is global. A landmark instance of this trend is the European Union AI Act. Following a political agreement in December 2023 is the driving factor this market.
              • the European parliament formally adopted this comprehensive legislation in March 2024. The EU AI Act establishes a risk-based framework is the driving factor this market.
              • categorizing AI systems from minimal to unacceptable risk is the driving factor this market.
              • and imposes stringent obligations on high-risk applications common in sectors like finance is the driving factor this market.
              • healthcare is the driving factor this market.
              • and critical infrastructure. These obligations include requirements for robust data governance is the driving factor this market.
              • detailed technical documentation is the driving factor this market.
              • human oversight is the driving factor this market.
              • and transparent logging of system performance is the driving factor this market.
              • all of which are core functionalities of AI TRiSM platforms. For companies operating within or marketing to the European Union is the driving factor this market.
              • noncompliance can result in fines of up to 35 million euros or 7 percent of global annual turnover is the driving factor this market.
              • making investment in compliance tools a critical business imperative.Similarly is the driving factor this market.
              • in the APAC region is the driving factor this market.
              • nations are actively crafting their own regulatory responses. China implemented its Interim Measures for the Management of Generative Artificial Intelligence Services in August 2023. These regulations require providers of generative AI services to ensure content is accurate is the driving factor this market.
              • to prevent discrimination is the driving factor this market.
              • and to register their algorithms with the state. This demonstrates a clear move toward state oversight of AI models and their outputs is the driving factor this market.
              • driving demand for TRiSM solutions that can enforce content policies and maintain compliance records. The collective force of these global regulatory actions creates a powerful is the driving factor this market.
              • non-negotiable driver for the global market for AI trust is the driving factor this market.
              • risk is the driving factor this market.
              • and security management is the driving factor this market.
              • transforming it from a niche consideration into a fundamental component of enterprise risk management. is the driving factor this market.

              The Ai Trust, Risk And Security Management market vendors should focus on grabbing business opportunities from the Solution segment as it accounted for the largest market share in the base year.
              RIA - Research AI Assistant
              Ask RIA