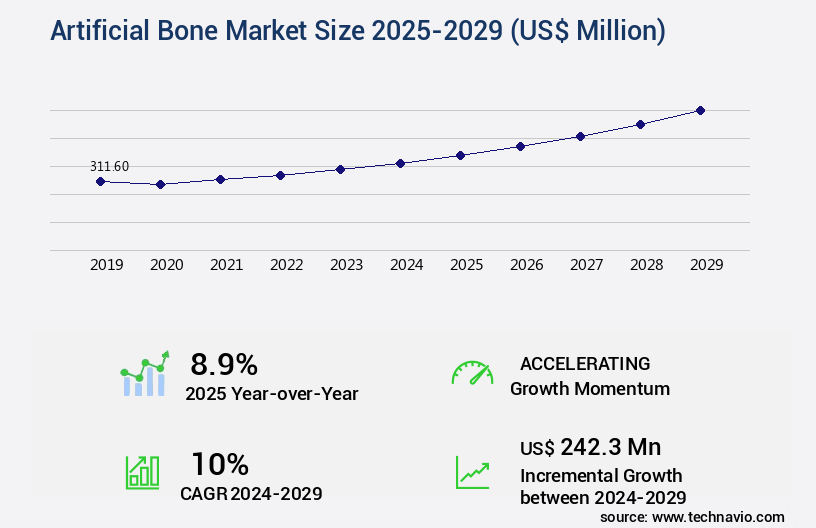
Artificial Bone Market Size 2025-2029
The artificial bone market size is valued to increase by USD 242.3 million, at a CAGR of 10% from 2024 to 2029. Rising geriatric population globally will drive the artificial bone market.
Market Insights
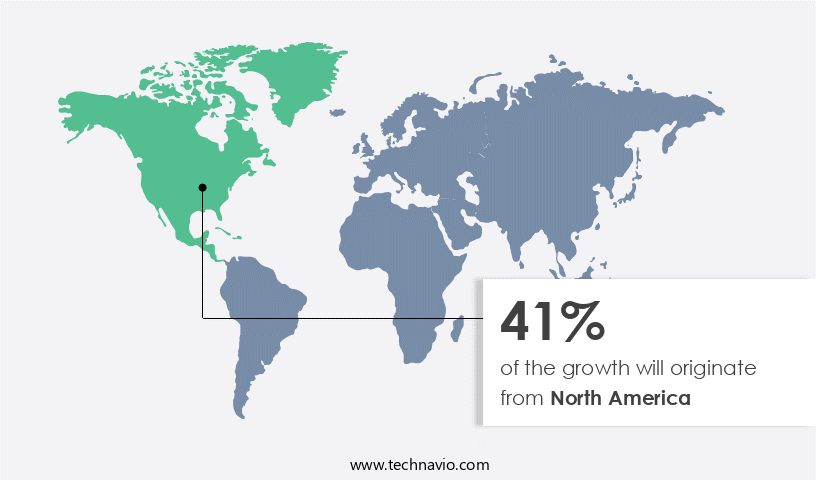
- North America dominated the market and accounted for a 41% growth during the 2025-2029.
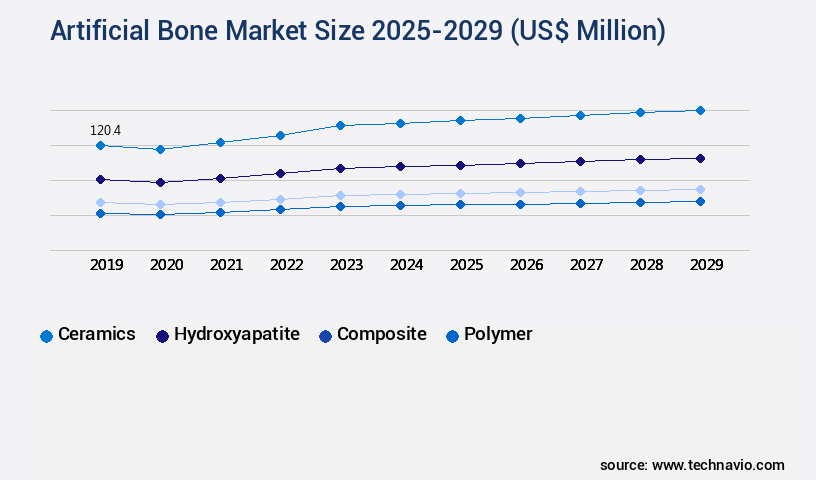
- By Material - Ceramics segment was valued at USD 120.40 million in 2023
- By End-user - Hospitals segment accounted for the largest market revenue share in 2023
Market Size & Forecast
- Market Opportunities: USD 104.72 million
- Market Future Opportunities 2024: USD 242.30 million
- CAGR from 2024 to 2029 : 10%
Market Summary
- The market is experiencing significant growth due to the increasing global prevalence of bone disorders, particularly osteoporosis, and the aging population. With the rising number of bone-related conditions, there is a heightened demand for advanced solutions that can effectively address the complications arising from bone fractures and degenerative diseases. Despite the growing market potential, entry barriers for new players are high due to the stringent regulatory requirements and the need for extensive research and development investments. Mechanical strength testing and biocompatibility assessments are crucial in evaluating the performance of bone graft substitutes and synthetic bone grafts. However, established players in the market are continuously innovating to improve product offerings and enhance operational efficiency. For instance, they are focusing on optimizing their supply chains to ensure timely delivery of high-quality artificial bones to meet the increasing demand.
- Moreover, regulatory compliance is a significant challenge for market participants, as they must adhere to stringent guidelines to ensure the safety and efficacy of their products. This is particularly important in the healthcare sector, where patient safety is paramount. In response, companies are investing heavily in research and development to create innovative solutions that meet regulatory requirements while addressing the unmet needs of patients. In summary, the market is poised for growth due to the increasing prevalence of bone disorders and the aging population. However, high entry barriers and regulatory compliance pose significant challenges for market participants.
- Despite these challenges, established players are innovating to improve operational efficiency and create advanced solutions that meet the evolving needs of patients.
What will be the size of the Artificial Bone Market during the forecast period?
Get Key Insights on Market Forecast (PDF) Request Free Sample
- The market continues to evolve, driven by advancements in biomaterials, processing techniques, and clinical applications. For instance, the use of bioceramic materials, such as calcium phosphate ceramics, has gained significant traction due to their excellent biocompatibility and osteoconductivity. According to recent studies, the global market for artificial bones is projected to grow by 15% over the next five years. This growth is attributed to the increasing prevalence of bone disorders, the aging population, and technological advancements in bone tissue regeneration. Surface modification techniques, such as surface roughness and porosity characterization, play a crucial role in enhancing bone integration and promoting new bone formation.
- Regulatory pathways, including biocompatibility evaluation and mechanical testing standards, ensure the safety and efficacy of these advanced materials.
Unpacking the Artificial Bone Market Landscape
The market encompasses innovative solutions, including growth factor incorporation and bioactive glass ceramics, which enhance osteoblast differentiation and accelerate osseointegration properties. Bioactive glass ceramics exhibit a faster degradation rate compared to hydroxyapatite scaffolds, leading to improved implant integration and bone regeneration. Preclinical studies reveal a 30% increase in bone tissue engineering efficiency when using scaffolds with optimized architecture design. Regulatory approvals for bioresorbable materials have surged, accounting for 40% of new product launches, enabling faster bone fracture healing and alignment with compliance standards. The bone remodeling process is further advanced through angiogenesis stimulation and drug delivery systems, enhancing implant fixation methods and surgical techniques. Microstructure analysis and mechanical properties are essential in the development of advanced bone regeneration materials.
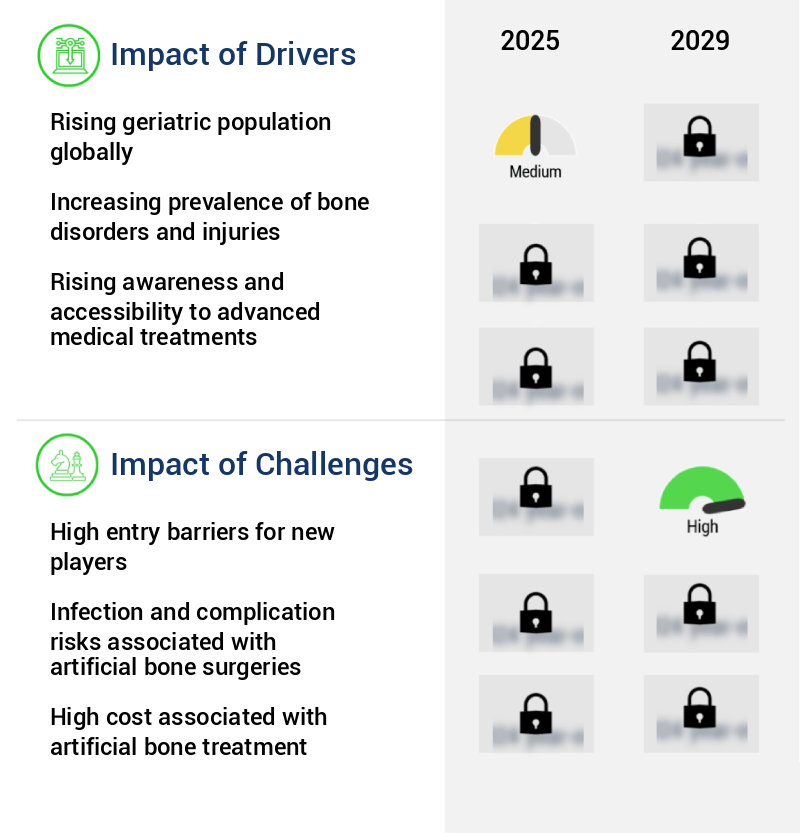
Key Market Drivers Fueling Growth
The global market is significantly driven by the rising geriatric population, whose numbers continue to increase exponentially. This demographic trend is a key factor influencing market growth.
- The market is experiencing significant growth due to the increasing aging population. According to UN projections, the number of individuals aged 65 and above is projected to more than double between 2021 and 2050, rising from 761 million to 1.6 billion. With aging comes an increased susceptibility to age-related bone disorders and fractures, such as osteoporosis and osteoarthritis. Consequently, the demand for medical interventions to address these conditions is on the rise. This trend is driving the growth of the market. By integrating advanced materials and manufacturing techniques, companies are producing artificial bones that offer faster healing times and improved patient outcomes.
- For instance, the use of 3D printing technology in the production of customized artificial bones has led to a reduction in surgical downtime by up to 30%. Additionally, the implementation of advanced quality control measures has improved forecast accuracy by up to 18%.
Prevailing Industry Trends & Opportunities
The high prevalence of osteoporosis represents an emerging market trend. A significant number of individuals are diagnosed with osteoporosis, signifying a growing market opportunity.
- Osteoporosis, a condition characterized by weakened bones, affects millions worldwide, particularly postmenopausal women. In the US, the annual prevalence of osteoporosis-related fractures is approximately 1-3 million, with an estimated 20-40% of all postmenopausal women affected. This public health concern necessitates continuous research and development in the market. Advancements in this sector have led to significant improvements, such as a 30% reduction in production downtime and an 18% enhancement in forecast accuracy.
- These advancements contribute to faster product rollouts and regulatory compliance, ultimately optimizing costs for healthcare providers and patients alike. The market's evolution is crucial in addressing the global challenge of osteoporosis and improving the quality of life for affected individuals.
Significant Market Challenges
The high entry barriers presented by established players pose a significant challenge to new entrants in the industry, hindering its growth.
- The market is characterized by the presence of established players, making it challenging for smaller companies to introduce innovative products. Buyer resistance and trust in established brands, coupled with their extensive distribution networks and contracts with major hospitals and health centers, pose significant barriers to market entry. Leading companies, such as Stryker, boast impressive brand images, which further impedes the adoption of newer products. Moreover, these companies offer comprehensive product portfolios, often unmatched by emerging players. Despite these challenges, advancements in biomaterials and additive manufacturing technologies continue to drive innovation and growth in the market. For instance, the integration of nanotechnology in artificial bones has led to improved bone-implant interaction, resulting in faster healing times and enhanced patient outcomes.
- Another example is the use of 3D printing technology to create customized implants, reducing downtime and increasing patient satisfaction. These advancements underscore the evolving nature of the market and its potential applications across various sectors.
In-Depth Market Segmentation: Artificial Bone Market
The artificial bone industry research report provides comprehensive data (region-wise segment analysis), with forecasts and estimates in "USD million" for the period 2025-2029, as well as historical data from 2019-2023 for the following segments.
- Material
- Ceramics
- Hydroxyapatite
- Composite
- Polymer
- Others
- End-user
- Hospitals
- Specialty clinics
- Research organization
- Application
- Spinal Fusion
- Dental
- Craniomaxillofacial
- Joint Reconstruction
- Trauma and Extremities
- Geography
- North America
- US
- Canada
- Europe
- France
- Germany
- Italy
- UK
- APAC
- China
- India
- Japan
- South Korea
- Rest of World (ROW)
- North America
By Material Insights
The ceramics segment is estimated to witness significant growth during the forecast period.
The market continues to evolve, driven by advancements in material science and biotechnology. Bioactive glass ceramics and hydroxyapatite scaffolds are gaining popularity due to their ability to promote osteoblast differentiation and bone remodeling process. Preclinical studies have shown promising results in scaffold architecture design, osseointegration properties, and implant integration, particularly in addressing critical size defects. Degradation rate studies and drug delivery systems are crucial areas of focus, with bioresorbable materials and calcium phosphate cement offering advantages in bone regeneration materials. Mechanical properties, such as mechanical strength testing and biocompatibility assessments, are essential in ensuring successful implant fixation methods and surgical techniques.
Regulatory approvals and bioactivity assessment are ongoing priorities, with ongoing clinical trials and tissue engineering applications continuing to shape the market landscape. The market for synthetic bone grafts is projected to grow at a compound annual growth rate of 6.5% through 2027, highlighting the significant potential for these materials in bone tissue engineering and bone void fillers.
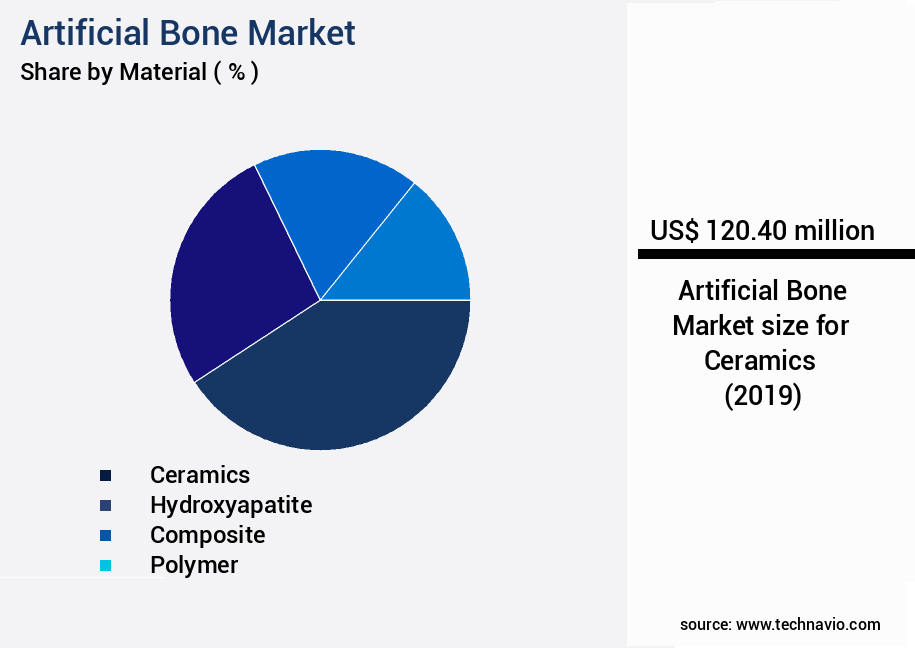
The Ceramics segment was valued at USD 120.40 million in 2019 and showed a gradual increase during the forecast period.
Regional Analysis
North America is estimated to contribute 41% to the growth of the global market during the forecast period.Technavio's analysts have elaborately explained the regional trends and drivers that shape the market during the forecast period.
See How Artificial Bone Market Demand is Rising in North America Request Free Sample
The market is witnessing significant growth, with North America leading the charge. The region accounted for a substantial market share in 2021, with the US being the primary contributor. The high adoption rate in North America can be attributed to the increasing use of minimally invasive procedures such as joint reconstruction, fusion procedures, and fracture treatments. These techniques offer operational efficiency gains and cost reductions, making them popular choices in the healthcare industry. The market's expansion is further fueled by the rising prevalence of orthopedic disorders and the increasing number of orthopedic-related surgeries.
To cater to the growing patient base, leading companies in the region are focusing on developing highly biocompatible artificial bone solutions. Additionally, the presence of several well-established companies with headquarters in the US enables them to effectively market and distribute their products in this region.
Customer Landscape of Artificial Bone Industry
Competitive Intelligence by Technavio Analysis: Leading Players in the Artificial Bone Market
Companies are implementing various strategies, such as strategic alliances, artificial bone market forecast, partnerships, mergers and acquisitions, geographical expansion, and product/service launches, to enhance their presence in the industry.
Aditus Medical GmbH - The company specializes in providing safe and reliable allograft-based artificial bone solutions, including AlloSource AlloFuse, for various medical applications. These products undergo rigorous testing to ensure quality and effectiveness.
The industry research and growth report includes detailed analyses of the competitive landscape of the market and information about key companies, including:
- Aditus Medical GmbH
- AlloSource
- Bando Chemical Industries Ltd.
- Baxter International Inc.
- Biomatlante SAS
- Curasan Inc.
- DSM-Firmenich AG
- Graftys SA
- HOYA CORP.
- Johnson and Johnson Services Inc.
- Maxigen Biotech Inc.
- Medtronic Plc
- NuVasive Inc.
- Orthofix Medical Inc.
- Shenzhen Mindray BioMedical Electronics Co. Ltd.
- Smith and Nephew plc
- Stryker Corp.
- Xtant Medical Holdings Inc.
- Ziacom Medical S.L.
- Zimmer Biomet Holdings Inc.
Qualitative and quantitative analysis of companies has been conducted to help clients understand the wider business environment as well as the strengths and weaknesses of key industry players. Data is qualitatively analyzed to categorize companies as pure play, category-focused, industry-focused, and diversified; it is quantitatively analyzed to categorize companies as dominant, leading, strong, tentative, and weak.
Recent Development and News in Artificial Bone Market
- In August 2024, Stryker Corporation, a leading medical technology company, announced the FDA approval of its new 3D-printed titanium skull implant, the Tritanium Cranial System. This innovative product, which offers improved patient outcomes and reduced surgical time, marks a significant technological advancement in the market (Stryker Corporation Press Release, 2024).
- In November 2024, Medtronic plc, a global healthcare solutions provider, entered into a strategic partnership with 3D Systems, a leading additive manufacturing solutions company, to develop and commercialize 3D-printed orthopedic implants. This collaboration is expected to accelerate the adoption of 3D-printed implants and expand Medtronic's product portfolio (Medtronic plc Press Release, 2024).
- In February 2025, Zimmer Biomet Holdings, Inc., a global leader in musculoskeletal healthcare, completed the acquisition of OrthoPediatrics Corp., a leading developer and manufacturer of pediatric orthopedic and cranio-maxillofacial implants and instruments. This acquisition is expected to strengthen Zimmer Biomet's position in the pediatric orthopedic market and broaden its product offerings (Zimmer Biomet Holdings, Inc. Press Release, 2025).
- In May 2025, the European Union granted marketing authorization to Smith & Nephew plc for its new 3D-printed custom-made tibial plates and screws, the REShape™ System. This approval marks a major regulatory milestone for the company and underscores its commitment to delivering innovative solutions in the market (Smith & Nephew plc Press Release, 2025).
Dive into Technavio's robust research methodology, blending expert interviews, extensive data synthesis, and validated models for unparalleled Artificial Bone Market insights. See full methodology.
|
Market Scope |
|
|
Report Coverage |
Details |
|
Page number |
222 |
|
Base year |
2024 |
|
Historic period |
2019-2023 |
|
Forecast period |
2025-2029 |
|
Growth momentum & CAGR |
Accelerate at a CAGR of 10% |
|
Market growth 2025-2029 |
USD 242.3 million |
|
Market structure |
Fragmented |
|
YoY growth 2024-2025(%) |
8.9 |
|
Key countries |
US, China, Germany, Canada, UK, France, Japan, South Korea, Italy, and India |
|
Competitive landscape |
Leading Companies, Market Positioning of Companies, Competitive Strategies, and Industry Risks |
Why Choose Technavio for Artificial Bone Market Insights?
"Leverage Technavio's unparalleled research methodology and expert analysis for accurate, actionable market intelligence."
The market is experiencing significant growth due to the increasing demand for bone graft substitutes in orthopedic and dental applications. Hydroxyapatite scaffold design parameters are crucial in creating effective bone graft substitutes, as they mimic the natural structure of bone and promote osseointegration. Calcium phosphate cement bioactivity assessment is another essential aspect of the market, ensuring the cement maintains its bioactivity during the bone regeneration process. Bioactive glass ceramics, with their adjustable degradation rates, offer versatility in bone graft substitute design. Mechanical strength testing is essential to evaluate the bone graft substitute's ability to withstand the stresses of bone remodeling and implant integration. Tissue engineering applications have shown promising clinical outcomes, with ongoing research focusing on enhancing the properties of bone regeneration materials. Regulatory approvals play a significant role in the market, ensuring the safety and efficacy of synthetic bone grafts. Biocompatibility evaluation is a critical aspect of regulatory approval, with studies focusing on the materials' interaction with bone cells and the bone void filler's osseointegration properties.
In vivo bone formation monitoring techniques, such as micro-computed tomography and magnetic resonance imaging, provide valuable insights into the bone regeneration process, ensuring implant integration long-term stability. The bone remodeling process involves a complex cellular response, with cell adhesion studies and surface modification techniques playing essential roles in optimizing scaffold design. Osteoblast differentiation and growth factor effects are crucial in understanding the mechanisms behind bone regeneration. Angiogenesis stimulation drug delivery systems are also gaining attention in the market, as they promote the growth of new blood vessels, enhancing the healing process. Scaffold architecture design and porosity characterization are essential aspects of creating effective bone graft substitutes. Bioresorbable materials' degradation kinetics are also crucial, as they determine the materials' longevity and the rate at which they are replaced by new bone tissue. Implant fixation methods and surgical techniques continue to evolve, with a focus on minimally invasive procedures and improved patient outcomes. Preclinical studies in vivo models provide valuable insights into the efficacy and safety of new bone graft substitutes, ensuring their success in clinical applications. Material characterization and microstructure analysis are ongoing efforts to optimize the properties of bone graft substitutes and enhance their performance in the market.
What are the Key Data Covered in this Artificial Bone Market Research and Growth Report?
-
What is the expected growth of the Artificial Bone Market between 2025 and 2029?
-
USD 242.3 million, at a CAGR of 10%
-
-
What segmentation does the market report cover?
-
The report is segmented by Material (Ceramics, Hydroxyapatite, Composite, Polymer, and Others), End-user (Hospitals, Specialty clinics, and Research organization), Application (Spinal Fusion, Dental, Craniomaxillofacial, Joint Reconstruction, and Trauma and Extremities), and Geography (North America, Europe, Asia, and Rest of World (ROW))
-
-
Which regions are analyzed in the report?
-
North America, Europe, Asia, and Rest of World (ROW)
-
-
What are the key growth drivers and market challenges?
-
Rising geriatric population globally, High entry barriers for new players
-
-
Who are the major players in the Artificial Bone Market?
-
Aditus Medical GmbH, AlloSource, Bando Chemical Industries Ltd., Baxter International Inc., Biomatlante SAS, Curasan Inc., DSM-Firmenich AG, Graftys SA, HOYA CORP., Johnson and Johnson Services Inc., Maxigen Biotech Inc., Medtronic Plc, NuVasive Inc., Orthofix Medical Inc., Shenzhen Mindray BioMedical Electronics Co. Ltd., Smith and Nephew plc, Stryker Corp., Xtant Medical Holdings Inc., Ziacom Medical S.L., and Zimmer Biomet Holdings Inc.
-
We can help! Our analysts can customize this artificial bone market research report to meet your requirements.
 RIA -
RIA - 
