Astaxanthin Market Size 2025-2029
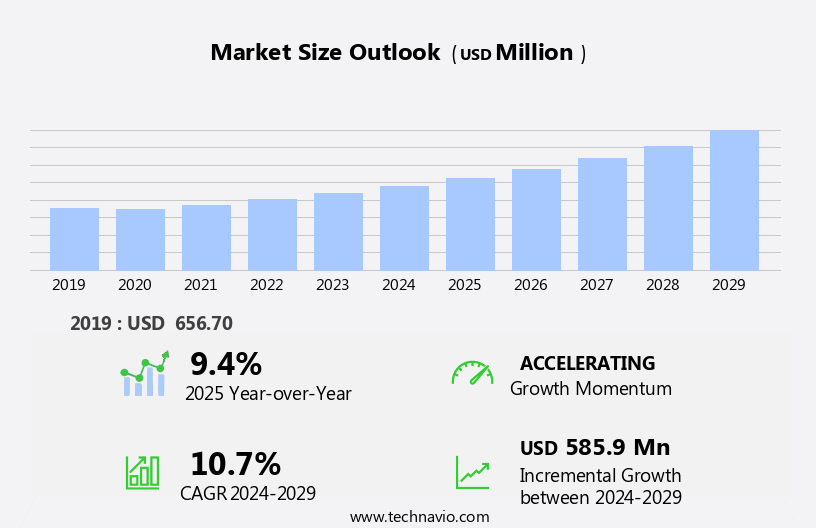
The astaxanthin market size is forecast to increase by USD 585.9 million, at a CAGR of 10.7% between 2024 and 2029.
- The market is experiencing significant growth, driven by the increasing health and wellness awareness among consumers. This trend is leading to a surge in demand for natural and sustainable sources of astaxanthin, a potent antioxidant known for its health benefits. Astaxanthin is primarily sourced from microalgae, making it an eco-friendly alternative to other antioxidants derived from synthetic sources. High production rates of astaxanthin, particularly from leading producers in countries like China and Norway, are further fueling market growth. However, challenges persist, including the high production costs associated with cultivating microalgae and the need for stringent quality control measures to ensure product purity and consistency.
- Additionally, the market faces competition from other antioxidants, necessitating continuous innovation and differentiation to maintain a competitive edge. Companies seeking to capitalize on market opportunities must focus on sustainable sourcing, cost-effective production methods, and delivering high-quality products to meet the evolving demands of health-conscious consumers.
What will be the Size of the Astaxanthin Market during the forecast period?
Explore in-depth regional segment analysis with market size data - historical 2019-2023 and forecasts 2025-2029 - in the full report.
Request Free Sample
Astaxanthin, a naturally occurring carotenoid pigment, has gained significant attention in various sectors due to its potential health benefits. The market dynamics surrounding astaxanthin are continuously evolving, with ongoing research and development efforts in multiple areas. In the realm of cognitive function improvement, studies are underway to explore astaxanthin's role in enhancing brain health and memory. Simultaneously, cancer prevention research is focusing on astaxanthin's antioxidant properties and its potential to inhibit tumor growth. Encapsulation technologies are being employed to improve astaxanthin's stability and bioavailability, extending its shelf life and enhancing its efficacy. Haematococcus pluvialis, the primary source of astaxanthin, is being cultivated using advanced methods to optimize production and ensure consistent quality.
The HPLC purification process is crucial in extracting and isolating astaxanthin from Haematococcus pluvialis. Dietary supplement regulations are being closely monitored to ensure the safety and efficacy of astaxanthin-based products. Spectrophotometric analysis and mass spectrometry are employed for quality control and quantitative analysis. Bioavailability enhancement strategies, such as liposomal delivery systems and nanoparticle formulations, are being explored to improve the absorption and utilization of astaxanthin in the body. Ongoing research is also focusing on astaxanthin's antioxidant capacity assay, cardiovascular health benefits, skin health benefits, eye health benefits, and immune system modulation. Food additive approvals and cosmetics ingredient safety are critical considerations in expanding the applications of astaxanthin in the food and beverage industry and the cosmetics sector.
Uv protection mechanisms and oxidative stress reduction properties are being studied to explore astaxanthin's potential in sunscreen formulations and anti-aging products. The market for astaxanthin is characterized by continuous innovation and research, with new developments in chromatographic techniques, microencapsulation, dosage optimization, and ant-inflammatory properties continually emerging. The evolving nature of the market underscores the importance of staying abreast of the latest trends and advancements in astaxanthin research and development.
How is this Astaxanthin Industry segmented?
The astaxanthin industry research report provides comprehensive data (region-wise segment analysis), with forecasts and estimates in "USD million" for the period 2025-2029, as well as historical data from 2019-2023 for the following segments.
- Source
- Natural
- Synthetic
- Type
- Dry
- Liquid
- Application
- Dietary supplements
- Animal feed
- Cosmetics
- Pharmaceuticals
- Food and beverages
- Geography
- North America
- US
- Canada
- Europe
- France
- Germany
- Italy
- UK
- APAC
- China
- India
- Japan
- South America
- Brazil
- Rest of World (ROW)
- North America
By Source Insights
The natural segment is estimated to witness significant growth during the forecast period.
The market is characterized by the Natural form of this antioxidant, which derives from sources such as microalgae, yeast, shrimp and other seafoods, krill, and certain fish. This segment holds a substantial market share due to its purity and extensive usage in various industries, including dietary supplements, cosmetics, animal feed, and pharmaceuticals. In the dietary supplement sector, the demand for Natural Astaxanthin is on the rise. The extraction methods for Astaxanthin include supercritical CO2 and HPLC purification processes. Quality control parameters are crucial in ensuring the isomerization and concentration of Astaxanthin. Natural Astaxanthin offers numerous health benefits, including eye health improvements, cardiovascular support, and skin protection.
Studies have shown its antioxidant capacity, anti-inflammatory properties, immune system modulation, and cognitive function enhancement. The stability of Astaxanthin is crucial for maintaining its efficacy, which is addressed through microencapsulation techniques, shelf-life extension strategies, and UV protection mechanisms. Regulations for dietary supplements and Food Additives are essential in ensuring safety and quality. Mass spectrometry analysis and spectrophotometric methods are employed for Astaxanthin's identification and quantification. Bioavailability enhancement through liposomal delivery systems and nanoparticle formulations is a focus area for improving the efficacy of Astaxanthin supplements. Research on Astaxanthin's potential role in cancer prevention and cognitive function improvement continues to expand.
Haematococcus pluvialis, a rich source of Astaxanthin, is being cultivated for commercial production. Encapsulation technologies and dosage optimization studies are essential for addressing the challenges of delivering effective Astaxanthin doses. The market for Astaxanthin is expected to grow as more research uncovers its benefits and applications.
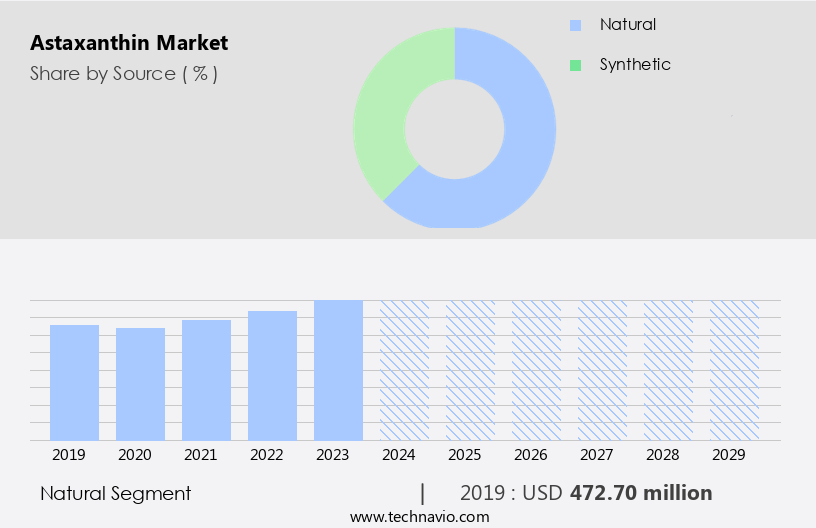
The Natural segment was valued at USD 472.70 million in 2019 and showed a gradual increase during the forecast period.
Regional Analysis
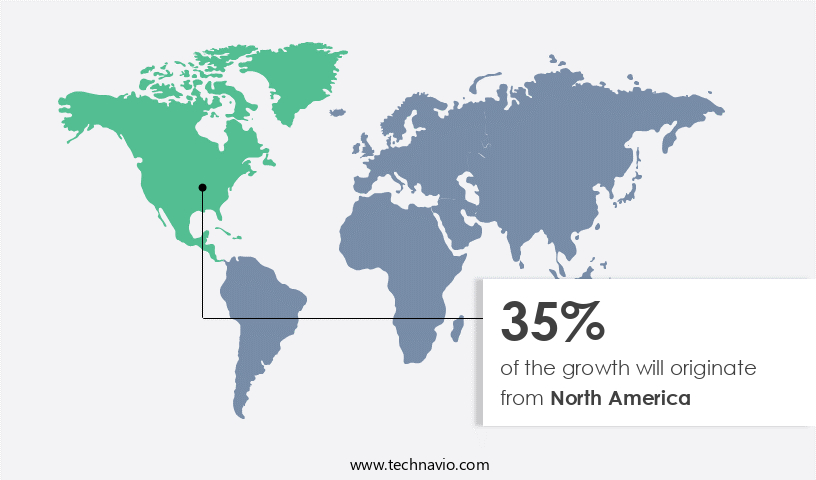
North America is estimated to contribute 35% to the growth of the global market during the forecast period.Technavio's analysts have elaborately explained the regional trends and drivers that shape the market during the forecast period.
The market in North America is experiencing notable growth due to escalating consumer awareness regarding its health benefits. Astaxanthin, a potent antioxidant and anti-inflammatory agent, is increasingly incorporated into dietary supplements and functional foods. The nutraceutical and dietary supplement sector in North America has witnessed substantial expansion, fueling the demand for astaxanthin. Astaxanthin's application extends beyond the nutraceutical industry, as it is also used in the aquaculture industry to enhance the coloration of farmed fish. The rising demand for seafood and aquaculture products contributes to the increasing demand for astaxanthin. To ensure product quality and consistency, various extraction methods, such as supercritical CO2 extraction, are employed.
HPLC purification processes are utilized to isolate and concentrate astaxanthin. Quality control parameters, including isomerization and stability studies, are rigorously assessed to maintain product efficacy. Encapsulation technologies, such as microencapsulation and liposomal delivery systems, are employed to enhance bioavailability and extend shelf life. Mass spectrometry analysis and chromatographic techniques are used for product identification and quantification. Safety assessments, including cosmetics ingredient safety and immune system modulation, are conducted to ensure consumer safety. Astaxanthin's potential benefits in cardiovascular health, skin health, cognitive function improvement, cancer prevention, and oxidative stress reduction continue to be explored through ongoing research.
Market Dynamics
Our researchers analyzed the data with 2024 as the base year, along with the key drivers, trends, and challenges. A holistic analysis of drivers will help companies refine their marketing strategies to gain a competitive advantage.
The market continues to evolve, driven by ongoing research and development in various sectors. Astaxanthin extraction yield optimization and liposome encapsulation size are key areas of focus, aiming to enhance the stability of astaxanthin in different matrices and improve its bioavailability in human subjects. The impact of astaxanthin on inflammation markers, skin collagen synthesis, immune cell activation, oxidative stress levels, and other health benefits are subjects of intense investigation. In the realm of applications, astaxanthin is gaining ground in areas such as macular degeneration, cognitive performance, and reducing wrinkles. Its protective effects against UV damage and its role in sustainability certification are also significant market trends. Astaxanthin's interaction with other supplements, regulatory approval pathways, production cost reduction, market segmentation studies, consumer preference analysis, product packaging design, and sustainability certification are all integral parts of the dynamic the market landscape.
What are the key market drivers leading to the rise in the adoption of Astaxanthin Industry?
- The market is significantly driven by the rising awareness and emphasis on health and wellness. This trend, marked by increased consumer knowledge and prioritization of personal well-being, is a key factor fueling market growth.
- Astaxanthin, a natural antioxidant, has gained popularity in the health supplement market due to its potential benefits for skin health and antioxidant properties. The increasing awareness of the importance of maintaining youthful-looking skin and combating oxidative stress has fueled the demand for astaxanthin-containing products. Astaxanthin's strong antioxidant capabilities make it effective in reducing wrinkles and protecting cells from damage caused by free radicals. The market for astaxanthin has been growing due to its various applications. Food additive approvals have expanded its use in various industries, including food and beverages, cosmetics, and pharmaceuticals. To ensure optimal efficacy, researchers have explored methods such as microencapsulation techniques and shelf-life extension strategies to improve astaxanthin concentration and cellular uptake mechanisms.
- The potential of astaxanthin to reduce oxidative stress has been the subject of extensive research. Its UV protection mechanisms make it an attractive ingredient for sunscreen and skincare products. As consumers become more health-conscious, the demand for natural supplements and functional foods fortified with astaxanthin is expected to continue growing.
What are the market trends shaping the Astaxanthin Industry?
- The trend in the market is shifting towards the increased natural and sustainable sourcing of astaxanthin. This approach prioritizes both environmental responsibility and consumer demand for eco-friendly production methods.
- Astaxanthin, a naturally occurring pigment derived primarily from microalgae, is gaining popularity due to its environmental sustainability and potential health benefits. In the cosmetics industry, astaxanthin is valued for its antioxidant and anti-inflammatory properties, which contribute to skin health and immune system modulation. To ensure the safety of Cosmetic Ingredients, companies employ advanced analytical techniques such as mass spectrometry analysis and chromatographic methods for astaxanthin purification and quality assessment. Innovations in delivery systems, including liposomal and nanoparticle formulations, facilitate improved dosage optimization and enhanced bioavailability. The anti-inflammatory properties of astaxanthin are particularly appealing for consumers seeking natural alternatives to synthetic ingredients.
- As consumer expectations for transparency and sustainability continue to rise, companies that can demonstrate responsible sourcing and production methods gain a competitive edge. This shift towards natural and sustainable astaxanthin sources is also observed in the aquaculture industry, where the use of natural astaxanthin in fish and Shrimp Feed is favored over synthetic alternatives.
What challenges does the Astaxanthin Industry face during its growth?
- Maintaining high production rates poses a significant challenge to the industry's growth trajectory. In order to remain competitive and profitable, companies must continually find ways to streamline processes, optimize workflows, and invest in advanced technologies to increase efficiency and output. This requires a deep understanding of industry trends, market demands, and operational best practices. By staying informed and adaptable, businesses can not only meet production targets but also drive innovation and growth within their respective sectors.
- Astaxanthin, a natural pigment derived primarily from microalgae like Haematococcus pluvialis, is gaining popularity for its potential health benefits, including cognitive function improvement and cancer prevention. However, producing natural astaxanthin can be costly and resource-intensive, making it essential to scale up production while maintaining cost-effectiveness. Factors such as climate conditions, contamination risks, and supply chain disruptions can impact the availability of natural astaxanthin. Synthetic astaxanthin, though less expensive to produce, poses a challenge for natural astaxanthin producers due to consumer and industry preferences for natural sourcing.
- To ensure product consistency and reliability, encapsulation technologies, HPLC purification processes, and spectrophotometric analysis are used. Bioavailability enhancement techniques are also crucial to maximize the health benefits of astaxanthin. Dietary supplement regulations mandate strict quality control measures, further increasing production costs. Producers must navigate these challenges while adhering to regulatory requirements and maintaining competitiveness in the market.
Exclusive Customer Landscape
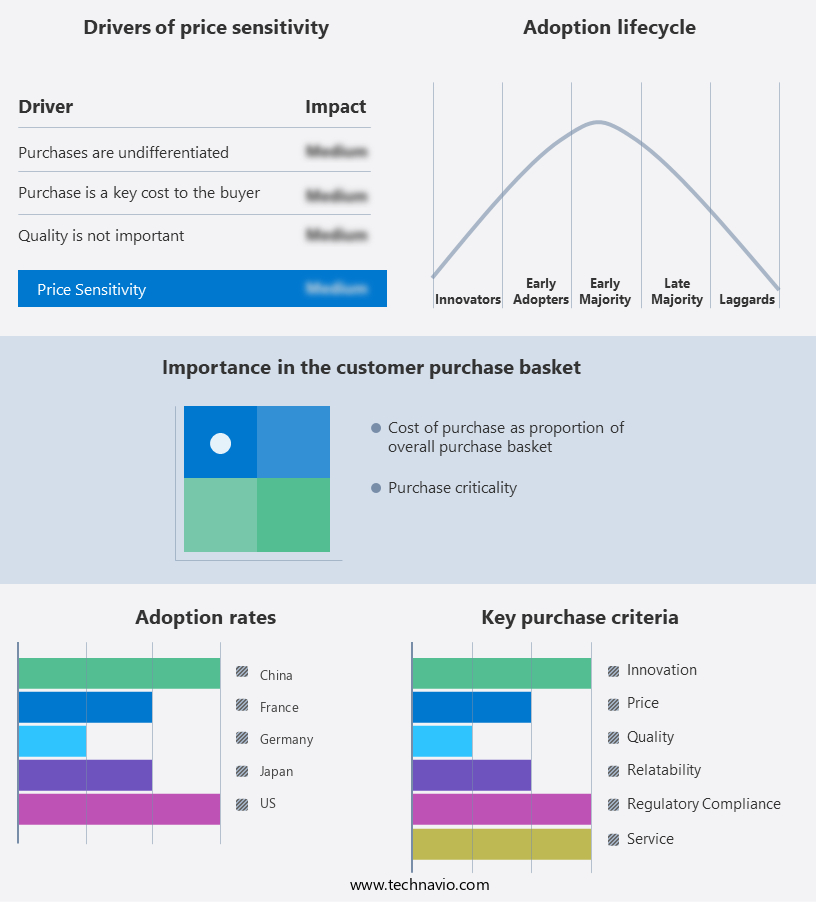
The astaxanthin market forecasting report includes the adoption lifecycle of the market, covering from the innovator's stage to the laggard's stage. It focuses on adoption rates in different regions based on penetration. Furthermore, the astaxanthin market report also includes key purchase criteria and drivers of price sensitivity to help companies evaluate and develop their market growth analysis strategies.
Customer Landscape
Key Companies & Market Insights
Companies are implementing various strategies, such as strategic alliances, astaxanthin market forecast, partnerships, mergers and acquisitions, geographical expansion, and product/service launches, to enhance their presence in the industry.
ALGAMO - The company specializes in the production and supply of astaxanthin, specifically the brand Lucantin Pink, utilized in salmonid fish feeds. This natural antioxidant enhances the coloration and improves the health of farmed fish, contributing to the global aquaculture industry's sustainable growth.
The industry research and growth report includes detailed analyses of the competitive landscape of the market and information about key companies, including:
- ALGAMO
- Algatech Ltd.
- AstaMAZ NZ Ltd.
- Atacama Bio Natural Products SA
- BASF SE
- Beijing Gingko Group
- Biogenic Co Ltd.
- Cardax Inc.
- Cyanotech Corp.
- Divis Laboratories Ltd.
- dsm-firmenich
- EID Parry India Ltd.
- ENEOS Corp.
- FENCHEM
- Fuji Chemical Industries Co Ltd.
- NOW Foods
- Otsuka Pharmaceutical Co Ltd.
- Piveg Inc.
- Valensa International
- Zhejiang NHU Co. Ltd.
Qualitative and quantitative analysis of companies has been conducted to help clients understand the wider business environment as well as the strengths and weaknesses of key industry players. Data is qualitatively analyzed to categorize companies as pure play, category-focused, industry-focused, and diversified; it is quantitatively analyzed to categorize companies as dominant, leading, strong, tentative, and weak.
Recent Development and News in Astaxanthin Market
- In January 2024, Merck KGaA, a leading life science and healthcare company, announced the expansion of its astaxanthin production capacity at its site in Darmstadt, Germany. The investment of â¬10 million aimed to meet the growing demand for this antioxidant (Merck KGaA press release, 2024).
- In March 2024, AlgaeCytes, a leading astaxanthin producer, entered into a strategic partnership with DSM Nutritional Products, a global supplier of nutritional ingredients. The collaboration focused on the development and commercialization of innovative astaxanthin-based products (DSM Nutritional Products press release, 2024).
- In May 2024, AstaReal, a global astaxanthin supplier, received a significant investment of â¬15 million from the European Investment Bank. The funding was earmarked for the expansion of its production facilities and research and development activities (European Investment Bank press release, 2024).
- In January 2025, BASF, a leading chemical producer, received regulatory approval from the European Commission for its astaxanthin production process. This approval marked a significant milestone in the commercialization of BASF's astaxanthin derived from yeast fermentation (BASF press release, 2025).
Research Analyst Overview
- In the market, toxicity testing methods are crucial for ensuring product safety and regulatory compliance. Sales promotion methods, such as discounts and bundling, are employed by manufacturers to boost consumer demand. Quality assurance protocols, including in vitro and in vivo studies, gene expression analysis, and allergenicity studies, are essential for maintaining product consistency and consumer trust. Market pricing strategies vary, with some companies focusing on premium pricing for differentiated products, while others prioritize economic feasibility assessment to remain competitive. Preclinical research, including Cell Culture studies, animal model studies, and clinical trial results, continues to drive product formulation development and astaxanthin efficacy evaluation.
- Sustainability considerations, such as waste management practices and commercial production scalability, are increasingly important in the market. Regulatory compliance strategies, including metabolic profiling analysis and human clinical trials, are necessary for securing approvals and expanding market reach. Astaxanthin synthesis pathways and brand positioning strategies are key areas of innovation, as manufacturers seek to differentiate themselves and meet evolving consumer preferences.
Dive into Technavio's robust research methodology, blending expert interviews, extensive data synthesis, and validated models for unparalleled Astaxanthin Market insights. See full methodology.
|
Market Scope |
|
|
Report Coverage |
Details |
|
Page number |
210 |
|
Base year |
2024 |
|
Historic period |
2019-2023 |
|
Forecast period |
2025-2029 |
|
Growth momentum & CAGR |
Accelerate at a CAGR of 10.7% |
|
Market growth 2025-2029 |
USD 585.9 million |
|
Market structure |
Fragmented |
|
YoY growth 2024-2025(%) |
9.4 |
|
Key countries |
US, China, Germany, Canada, UK, Brazil, France, Japan, India, and Italy |
|
Competitive landscape |
Leading Companies, Market Positioning of Companies, Competitive Strategies, and Industry Risks |
What are the Key Data Covered in this Astaxanthin Market Research and Growth Report?
- CAGR of the Astaxanthin industry during the forecast period
- Detailed information on factors that will drive the growth and forecasting between 2025 and 2029
- Precise estimation of the size of the market and its contribution of the industry in focus to the parent market
- Accurate predictions about upcoming growth and trends and changes in consumer behaviour
- Growth of the market across North America, Europe, APAC, South America, and Middle East and Africa
- Thorough analysis of the market's competitive landscape and detailed information about companies
- Comprehensive analysis of factors that will challenge the astaxanthin market growth of industry companies
We can help! Our analysts can customize this astaxanthin market research report to meet your requirements.
 RIA -
RIA - 
