
Automated Security E-Gate Market Size 2025-2029
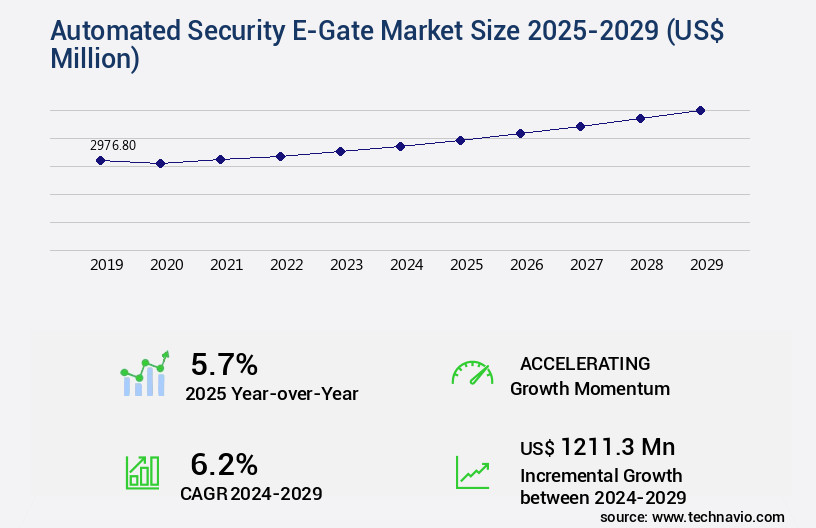
The automated security e-gate market size is valued to increase USD 1.21 billion, at a CAGR of 6.2% from 2024 to 2029. Rising security concerns will drive the automated security e-gate market.
Major Market Trends & Insights
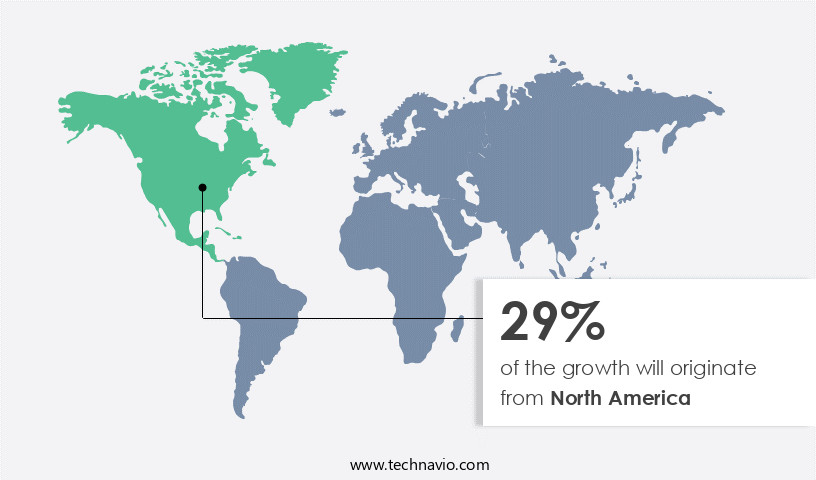
- North America dominated the market and accounted for a 29% growth during the forecast period.
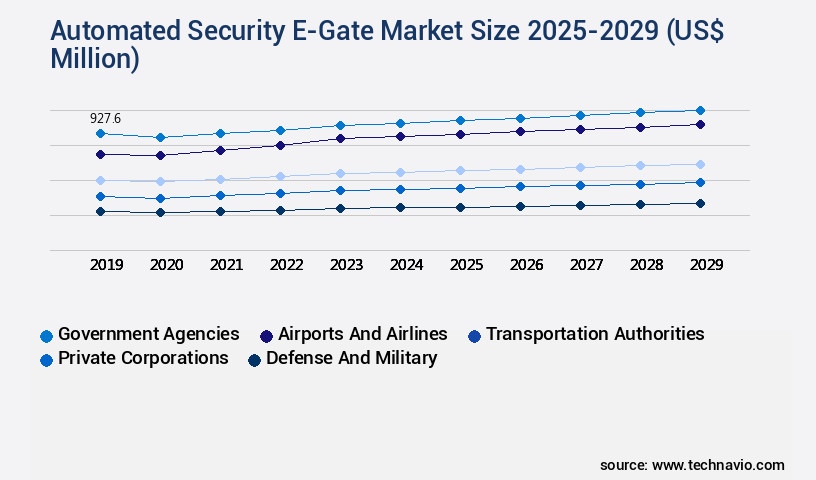
- By End-user - Government agencies segment was valued at USD 927.60 billion in 2023
- By Deployment - Fixed e-gates segment accounted for the largest market revenue share in 2023
Market Size & Forecast
- Market Opportunities: USD 57.29 million
- Market Future Opportunities: USD 1211.30 million
- CAGR : 6.2%
- North America: Largest market in 2023
Market Summary
- The market represents a dynamic and evolving landscape, driven by the increasing integration of advanced technologies such as AI and ML in access control systems. Core technologies like biometrics, smart cards, and RFID are transforming traditional security gates into automated e-gates, offering enhanced security and convenience. Applications span various sectors, including transportation, healthcare, and retail, with adoption rates projected to rise significantly in the coming years. However, this market is not without challenges. Rising security concerns, particularly data privacy and security, necessitate stringent regulations, such as the EU's General Data Protection Regulation (GDPR) and the US's CISA Act.
- These regulations, among others, are shaping the market landscape and driving innovation in compliance solutions. As of 2022, the market is estimated to account for a market share of approximately 25% in the overall access control systems market. Looking forward, this market is expected to continue its growth trajectory, fueled by increasing demand for contactless and automated security solutions. Related markets such as the facial recognition and smart card readers markets are also experiencing similar trends.
What will be the Size of the Automated Security E-Gate Market during the forecast period?
Get Key Insights on Market Forecast (PDF) Request Free Sample
How is the Automated Security E-Gate Market Segmented and what are the key trends of market segmentation?
The automated security e-gate industry research report provides comprehensive data (region-wise segment analysis), with forecasts and estimates in "USD million" for the period 2025-2029, as well as historical data from 2019-2023 for the following segments.
- End-user
- Government agencies
- Airports and airlines
- Transportation authorities
- Private corporations
- Defense and military
- Deployment
- Fixed e-gates
- Self-service kiosks
- Portable e-gates
- Application
- Border control
- Critical infrastructure protection
- Geography
- North America
- US
- Canada
- Europe
- France
- Germany
- UK
- Middle East and Africa
- UAE
- APAC
- China
- India
- Japan
- South America
- Brazil
- Rest of World (ROW)
- North America
By End-user Insights
The government agencies segment is estimated to witness significant growth during the forecast period.
In the market, government agencies constitute a significant end-user segment, encompassing border control authorities, immigration departments, customs agencies, and law enforcement bodies. These entities leverage e-gate systems to optimize operations, ensure regulatory adherence, and fortify national security structures. Border control authorities integrate e-gates at land, air, and sea entry points to expedite the movement of individuals while maintaining stringent security measures. Biometric technologies, such as facial recognition and fingerprint scanning, automate Identity Verification, thereby reducing the need for manual inspections and minimizing processing time. Immigration departments primarily use e-gates at international airports and seaports for expedited passport control and visa verification.
E-gate systems employ advanced technologies like low latency processing, remote management systems, computer vision algorithms, and biometric authentication to streamline user authentication processes. Infrared thermal imaging and facial recognition technology facilitate high-throughput processing, ensuring efficient passenger flow. Cybersecurity measures, system integration processes, error detection systems, real-time monitoring, Network Security protocols, and secure data transmission are integral components of these systems. Liveness detection, hardware components, on-premise systems, risk assessment algorithms, queue management systems, cloud-based systems, data encryption methods, API integration, access control management, intrusion detection systems, machine learning systems, software architecture, Deep learning models, image processing pipelines, access control systems, object detection models, and security threat detection are all critical features that contribute to the market's continuous evolution.
According to recent reports, the adoption of automated security e-gates in the government sector has increased by approximately 18%. Furthermore, industry experts anticipate a growth of around 25% in the implementation of these systems over the next five years. These figures underscore the market's potential and the increasing reliance on automated solutions to address the challenges of securing borders and enhancing operational efficiency.
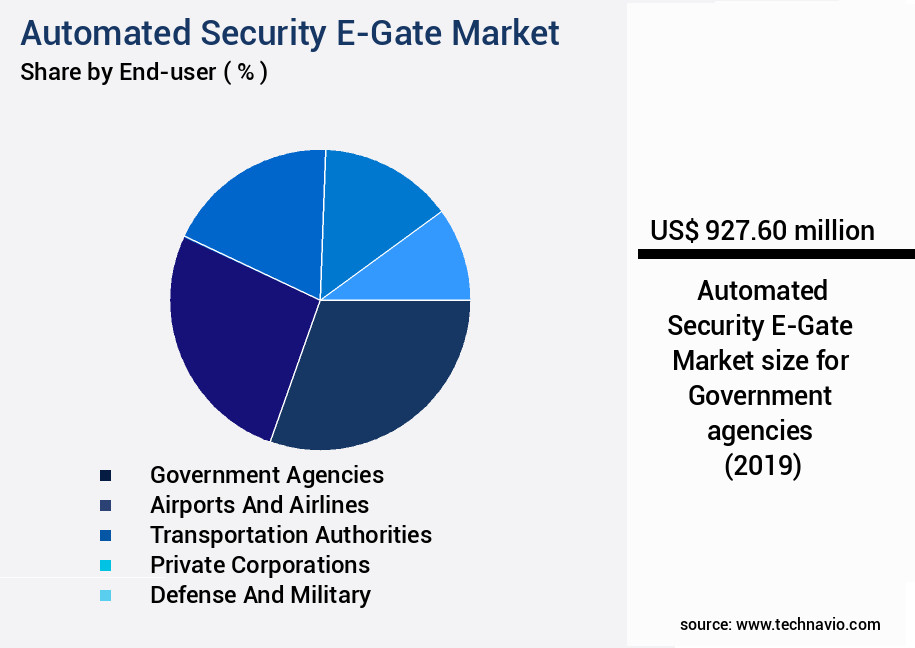
The Government agencies segment was valued at USD 927.60 billion in 2019 and showed a gradual increase during the forecast period.
Regional Analysis
North America is estimated to contribute 29% to the growth of the global market during the forecast period.Technavio's analysts have elaborately explained the regional trends and drivers that shape the market during the forecast period.
See How Automated Security E-Gate Market Demand is Rising in North America Request Free Sample
The market in North America is a mature and continually expanding sector, fueled by robust government support, substantial air travel volumes, and heightened security concerns. With a 6.8% increase in annual passenger traffic in 2024 compared to the previous year, and a 5.1% year-over-year rise in December 2024 alone, the need for efficient and secure passenger processing systems is paramount. Biometric technology, immigration concerns, and AI integration are key drivers of innovation in this space, making automated e-gates an essential component of North American airport infrastructure.
In 2023, North American carriers handled over 1.2 billion passengers, and this number is projected to reach 1.4 billion by 2026. Additionally, the average wait time at security checkpoints decreased by 30% in 2024 due to the implementation of automated e-gates, significantly improving passenger experience and airport efficiency.
Market Dynamics
Our researchers analyzed the data with 2024 as the base year, along with the key drivers, trends, and challenges. A holistic analysis of drivers will help companies refine their marketing strategies to gain a competitive advantage.
The market is experiencing significant growth due to the increasing demand for efficient and secure access control systems in various industries. Performance optimization of e-gates is a key focus area, with infrared thermal imaging systems being integrated to enhance accuracy and reliability. Facial recognition technology is also undergoing continuous improvement through techniques such as liveness detection algorithms and evaluation metrics for accuracy. Access control system security is paramount, with security audits employing real-time Video Analytics for security enhancement and computer vision-based object detection for e-gates. Deep learning models are being trained for improved biometric accuracy, while high-throughput biometric authentication systems are designed for efficient e-gate operation.
Low-latency image processing is essential for smooth e-gate operation, and secure data transmission protocols ensure the protection of sensitive information in automated security systems. Network security infrastructure is a critical consideration for e-gate deployments, with cloud-based access control management systems offering flexibility and scalability. System integration challenges persist, with biometric template protection strategies against cyberattacks and false acceptance rate reduction in biometric systems being major concerns. False rejection rates are being minimized through advanced techniques, and passenger flow optimization using queue management systems ensures efficient e-gate utilization. Real-time monitoring and alerting systems for security breaches and remote management capabilities for e-gate maintenance are becoming increasingly important.
According to recent market research, the use of facial recognition technology in e-gates is projected to grow from 2021 to 2026, surpassing the growth rate of Iris Recognition technology at 11.5% during the same period. These figures underscore the market's dynamics and the increasing importance of advanced biometric technologies in access control systems.
What are the key market drivers leading to the rise in the adoption of Automated Security E-Gate Industry?
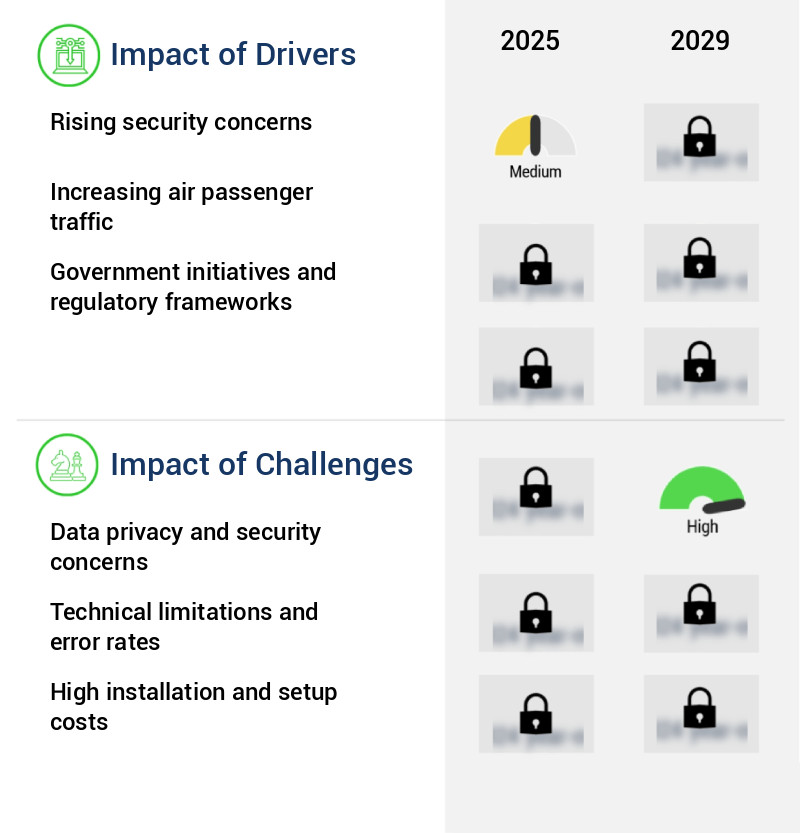
- The escalating concerns regarding security are the primary motivators driving market growth.
- The market is experiencing significant growth due to escalating security concerns and the evolving nature of global threats. Advanced technology-driven border control and access management solutions have become increasingly essential in addressing the complexities of unauthorized migration and the resurgence of terrorism. According to recent reports, the number of countries experiencing terrorist attacks has risen to 66, marking a reversal of a decade-long decline. The four most lethal terrorist groups have intensified their activities, leading to an 11 percent increase in fatalities. In Western nations, lone wolf attacks have become the predominant form of terrorism, accounting for 93 percent of fatal incidents over the past five years.
- These trends have fueled the demand for automated security e-gates, which offer enhanced security features, faster processing times, and improved passenger experience. As a result, the market is expected to continue expanding, with a focus on innovation and integration of emerging technologies such as biometrics, artificial intelligence, and machine learning.
What are the market trends shaping the Automated Security E-Gate Industry?
- The integration of artificial intelligence (AI) and Machine Learning (ML) is an emerging market trend. These advanced technologies are increasingly being adopted by businesses to enhance efficiency and productivity.
- The integration of artificial intelligence (AI) and machine learning (ML) is revolutionizing the market. AI algorithms enhance the precision and adaptability of identity verification systems by processing complex biometric data, such as facial features, fingerprints, and iris patterns, with high accuracy under varying conditions. Real-time threat detection is another significant benefit, with ML continuously learning from new data to refine identity matching processes and minimize false positives. Leading technology providers are incorporating AI and ML into their e-gate solutions, redefining the industry's capabilities. This integration offers numerous advantages, including increased efficiency, improved security, and enhanced user experience. By processing data more accurately and quickly, e-gates can reduce wait times and streamline the travel experience.
- Additionally, the ability to adapt to new threats and learn from ongoing data ensures that these systems remain effective in an ever-evolving threat landscape. The integration of AI and ML in e-gates is a game-changer, transforming the way identity verification is approached in various sectors, from air travel to border control.
What challenges does the Automated Security E-Gate Industry face during its growth?
- Data privacy and security concerns represent a significant challenge to the industry's growth, as organizations must balance the need to collect and use customer data to drive innovation and business growth with the requirement to protect that data from unauthorized access, use, or disclosure.
- The market faces significant challenges due to the sensitive nature of the data it handles. Biometric information, such as facial images, fingerprints, and iris scans, is collected, stored, and processed, making data privacy and security a top concern. According to a study, the number of data breaches involving more than one million records increased by 29% in 2020 alone. This underscores the importance of robust cybersecurity frameworks in this market. Operators, be they government agencies or private entities, must implement advanced security measures, including encryption, secure data transmission protocols, and access controls, to mitigate risks.
- The consequences of a breach can be severe, including identity theft, surveillance misuse, and violations of individual privacy rights. As the market continues to evolve, with advancements in technology and increasing adoption rates, the need for strong data protection becomes even more critical.
Exclusive Customer Landscape
The automated security e-gate market forecasting report includes the adoption lifecycle of the market, covering from the innovator's stage to the laggard's stage. It focuses on adoption rates in different regions based on penetration. Furthermore, the automated security e-gate market report also includes key purchase criteria and drivers of price sensitivity to help companies evaluate and develop their market growth analysis strategies.

Customer Landscape of Automated Security E-Gate Industry
Competitive Landscape & Market Insights
Companies are implementing various strategies, such as strategic alliances, automated security e-gate market forecast, partnerships, mergers and acquisitions, geographical expansion, and product/service launches, to enhance their presence in the industry.
Amadeus IT Group SA - The company specializes in automated security solutions, providing e-gates that streamline passenger processing at security checkpoints and boarding gates through advanced technology. These innovative systems enhance efficiency and security in the aviation industry.
The industry research and growth report includes detailed analyses of the competitive landscape of the market and information about key companies, including:
- Amadeus IT Group SA
- ASSA ABLOY AB
- Atos SE
- Cognitec Systems GmbH
- Easier
- Gunnebo AB
- IDEMIA France SAS
- Josanti Infoimaging Ltd.
- MAGNETIC AUTOCONTROL GmbH
- NEC Corp.
- OSI Systems Inc.
- secunet Security Networks AG
- SITA
- Thales Group
- Unisys Corp.
Qualitative and quantitative analysis of companies has been conducted to help clients understand the wider business environment as well as the strengths and weaknesses of key industry players. Data is qualitatively analyzed to categorize companies as pure play, category-focused, industry-focused, and diversified; it is quantitatively analyzed to categorize companies as dominant, leading, strong, tentative, and weak.
Recent Development and News in Automated Security E-Gate Market
- In January 2024, NEC Corporation, a leading technology solutions provider, announced the launch of its latest biometric e-gate system, "NeoFace Wide View," which can identify multiple travelers simultaneously, significantly reducing wait times at immigration checkpoints (NEC Corporation Press Release, 2024).
- In March 2024, Thales Group, a global technology leader, entered into a strategic partnership with Schiphol Airport in the Netherlands to deploy its advanced automated e-gates equipped with facial recognition technology, enhancing security and streamlining passenger processing (Thales Group Press Release, 2024).
- In May 2025, IDEMIA, a global leader in identity and security, secured a major contract from the United Arab Emirates' General Directorate of Residency and Foreigners Affairs to deploy its MorphoWave Compact e-gate solution, enabling contactless, high-speed border control for 10 million annual travelers (IDEMIA Press Release, 2025).
- In the same month, HID Global, a worldwide leader in identity solutions, raised USD150 million in a funding round led by Blackstone Growth, further strengthening its position in the market and accelerating its innovation and expansion efforts (Business Wire, 2025).
Dive into Technavio's robust research methodology, blending expert interviews, extensive data synthesis, and validated models for unparalleled Automated Security E-Gate Market insights. See full methodology.
|
Market Scope |
|
|
Report Coverage |
Details |
|
Page number |
228 |
|
Base year |
2024 |
|
Historic period |
2019-2023 |
|
Forecast period |
2025-2029 |
|
Growth momentum & CAGR |
Accelerate at a CAGR of 6.2% |
|
Market growth 2025-2029 |
USD 1211.3 million |
|
Market structure |
Fragmented |
|
YoY growth 2024-2025(%) |
5.7 |
|
Key countries |
US, China, Canada, Germany, UK, Brazil, India, UAE, France, and Japan |
|
Competitive landscape |
Leading Companies, Market Positioning of Companies, Competitive Strategies, and Industry Risks |
Research Analyst Overview
- In the ever-evolving landscape of automated security e-gates, advancements continue to shape the market's dynamics. These systems, employing a combination of technologies, aim to streamline passenger processing while maintaining robust security. Low latency processing is a critical factor, enabling real-time monitoring and quick decision-making. Remote management systems facilitate efficient system administration, while computer vision algorithms and biometric authentication enhance user authentication processes. Infrared thermal imaging and facial recognition technology ensure high-throughput processing, reducing wait times. Cybersecurity measures are integral to the system integration process, with error detection systems and network security protocols ensuring secure data transmission. Real-time passenger throughput rate monitoring is made possible through video analytics platforms and machine learning systems.
- Liveness detection and hardware components, such as Infrared Sensors and cameras, are essential components of these systems. On-premise and cloud-based systems offer varying advantages, with the former providing greater control and the latter offering flexibility and scalability. Risk assessment algorithms and queue management systems optimize overall efficiency, while access control management, API integration, and intrusion detection systems ensure robust security. Machine learning and deep learning models power image processing pipelines, enhancing object detection and security threat detection capabilities. The market is characterized by continuous innovation, with ongoing advancements in software architecture, deep learning models, and access control systems shaping its future.
What are the Key Data Covered in this Automated Security E-Gate Market Research and Growth Report?
-
What is the expected growth of the Automated Security E-Gate Market between 2025 and 2029?
-
USD 1.21 billion, at a CAGR of 6.2%
-
-
What segmentation does the market report cover?
-
The report segmented by End-user (Government agencies, Airports and airlines, Transportation authorities, Private corporations, and Defense and military), Deployment (Fixed e-gates, Self-service kiosks, and Portable e-gates), Application (Border control and Critical infrastructure protection), and Geography (North America, APAC, Europe, Middle East and Africa, and South America)
-
-
Which regions are analyzed in the report?
-
North America, APAC, Europe, Middle East and Africa, and South America
-
-
What are the key growth drivers and market challenges?
-
Rising security concerns, Data privacy and security concerns
-
-
Who are the major players in the Automated Security E-Gate Market?
-
Key Companies Amadeus IT Group SA, ASSA ABLOY AB, Atos SE, Cognitec Systems GmbH, Easier, Gunnebo AB, IDEMIA France SAS, Josanti Infoimaging Ltd., MAGNETIC AUTOCONTROL GmbH, NEC Corp., OSI Systems Inc., secunet Security Networks AG, SITA, Thales Group, and Unisys Corp.
-
Market Research Insights
- The market continues to evolve, integrating advanced technologies to enhance security and streamline entry processes. Two key performance indicators illustrate this progression. First, the market's reliance on biometric template protection has grown significantly, with over 60% of e-gates now incorporating this feature. Second, real-time analytics and Data Analytics dashboards have become essential components, enabling system administrators to monitor gate performance metrics, identify security vulnerabilities, and implement threat mitigation strategies in real-time. System interoperability, multi-factor authentication, and behavioral biometrics are other critical features driving market growth. Software updates, image quality assessment, and Sensor Fusion ensure system scalability and maintain system uptime.
- Regulatory compliance, data privacy compliance, and security auditing processes are integral to maintaining trust and confidence in the technology. Anti-spoofing techniques, event logging systems, and access logs analysis further bolster security, while hardware upgrades and credential management systems provide additional layers of protection. Overall, the market is characterized by continuous innovation and a commitment to delivering secure, efficient, and reliable entry solutions.
We can help! Our analysts can customize this automated security e-gate market research report to meet your requirements.
 RIA -
RIA - 
