
Automotive ADAS Aftermarket Market Size 2026-2030
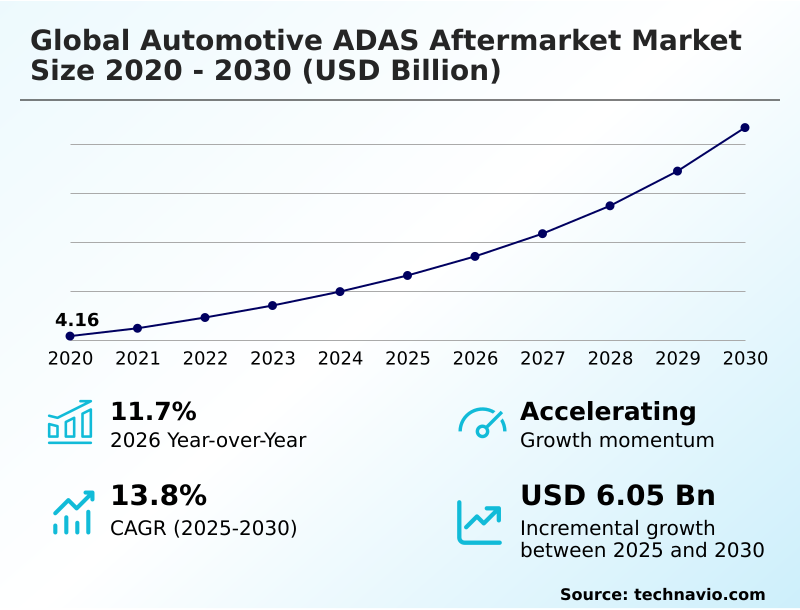
The Automotive ADAS Aftermarket Market size was valued at USD 6.64 billion in 2025, growing at a CAGR of 13.8% during the forecast period 2026-2030.
Major Market Trends & Insights
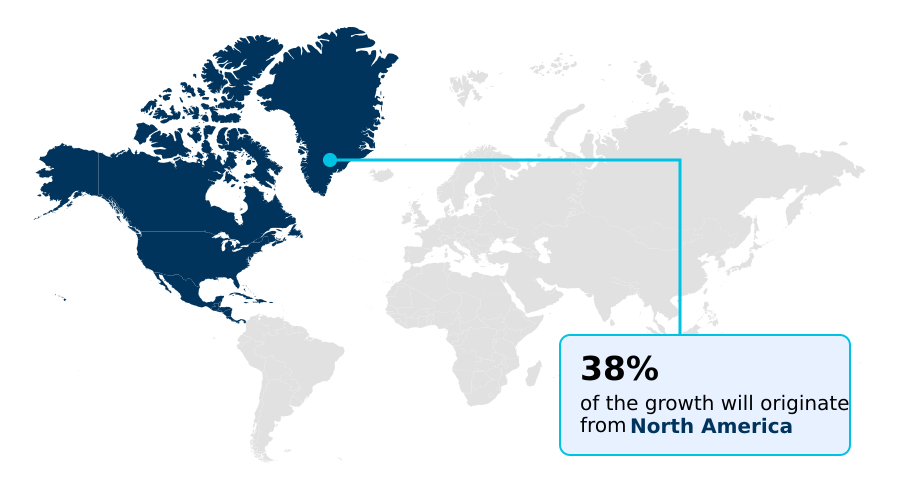
- North America dominated the market and accounted for a 38% growth during the forecast period.
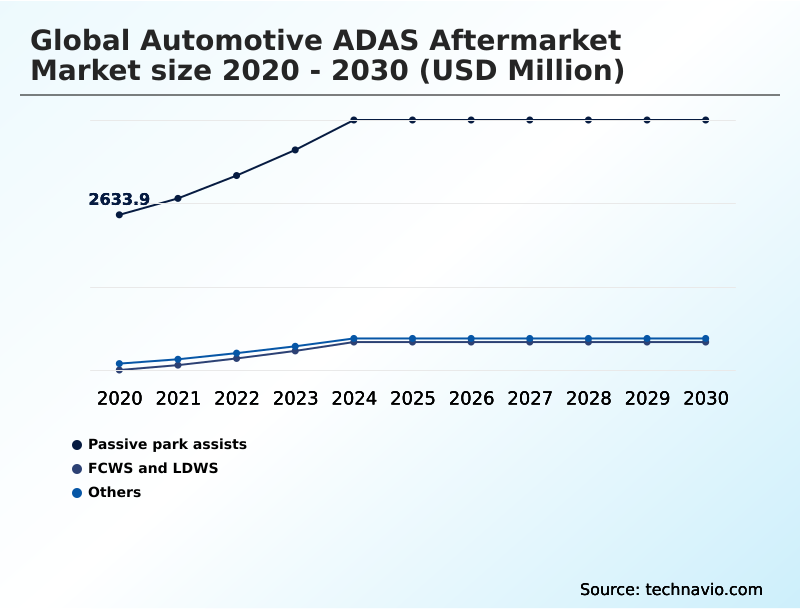
- By Technology - Passive park assists segment was valued at USD 3.80 billion in 2024
- By Vehicle Type - Passenger vehicles segment accounted for the largest market revenue share in 2024
Market Size & Forecast
- Historic Market Opportunities 2020-2024: USD 8.52 billion
- Market Future Opportunities 2025-2030: USD 6.05 billion
- CAGR from 2025 to 2030 : 13.8%
Market Summary
- The automotive ADAS aftermarket is undergoing a critical evolution, with repair facilities now required to perform complex calibrations for over 80% of modern vehicles following common services like windshield replacement. The market's expansion is fundamentally driven by tightening regulatory frameworks, which mandate features like automatic emergency braking and create a legally backed service addressable market.
- A significant business scenario involves independent workshops investing in all-makes calibration tools to retain service revenue, which can increase their service-related profits by up to 25% by avoiding sublet work to dealerships.
- However, this growth is constrained by a severe shortage of qualified technicians, with nearly half of all shop owners identifying this labor deficit as a major impediment to operational efficiency. This dynamic forces a strategic focus on technician training and the adoption of automated, user-friendly diagnostic systems to bridge the proficiency gap and meet rising service demands.
What will be the Size of the Automotive ADAS Aftermarket Market during the forecast period?
Get Key Insights on Market Forecast (PDF) Request Free Sample
How is the Automotive ADAS Aftermarket Market Segmented?
The automotive adas aftermarket industry research report provides comprehensive data (region-wise segment analysis), with forecasts and analysis for the period 2026-2030, as well as historical data from 2020-2024 for the following segments.
- Technology
- Passive park assists
- FCWS and LDWS
- Others
- Vehicle type
- Passenger vehicles
- Commercial vehicles
- Channel
- OEM-fitted ADAS
- Independent aftermarket
- Geography
- North America
- US
- Canada
- Mexico
- Europe
- Germany
- UK
- France
- APAC
- China
- Japan
- South Korea
- Middle East and Africa
- UAE
- Saudi Arabia
- South Africa
- South America
- Brazil
- Argentina
- Rest of World (ROW)
- North America
How is the Automotive ADAS Aftermarket Market Segmented by Technology?
The passive park assists segment is estimated to witness significant growth during the forecast period.
The passive park assists segment, driven by commercial applications, now accounts for over 60% of unit sales in the global automotive adas aftermarket market.
While new passenger vehicles have standardized these features, the retrofit market for heavy-duty trucks and recreational vehicles thrives on enhancing fleet management safety.
This sector is migrating from analog systems to high-definition, camera-based ADAS and surround view systems, with wireless solutions reducing installation labor by up to 40%.
The demand for these aftermarket parts, including ultrasonic sensors and retrofit ADAS kits, is closely tied to collision repair and requires precise sensor recalibration using advanced diagnostic scan tools to meet standards that are often on par with OEM certification.
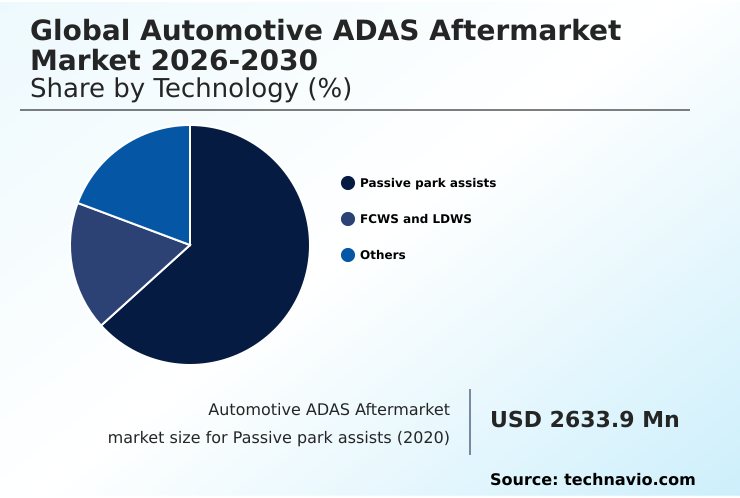
The Passive park assists segment was valued at USD 3.80 billion in 2024 and showed a gradual increase during the forecast period.
How demand for the Automotive ADAS Aftermarket market is rising in the leading region?
North America is estimated to contribute 38% to the growth of the global market during the forecast period.Technavio’s analysts have elaborately explained the regional trends and drivers that shape the market during the forecast period.
See How Automotive ADAS Aftermarket Market demand is rising in North America Request Free Sample
The geographic landscape of the automotive ADAS aftermarket is led by North America, which is projected to contribute 38% of the market’s incremental growth, outpacing Europe’s 33%.
This dominance is driven by the United States, where a litigious environment and insurance mandates compel rigorous ADAS calibration post-collision repair. In contrast, Europe’s market is shaped by stringent regulations like the GSR, fostering a standardized approach to vehicle safety.
Adoption of technologies like automotive radar and sensor fusion for blind spot detection is higher in the US commercial sector for fleet management safety. However, Europe leads in mandating forward collision warning systems.
Developing regions like APAC show the fastest growth, driven by low-cost retrofits, though they lag in complex lidar integration and calibration infrastructure.
What are the key Drivers, Trends, and Challenges in the Automotive ADAS Aftermarket Market?
Our researchers analyzed the data with 2025 as the base year, along with the key drivers, trends, and challenges. A holistic analysis of drivers will help companies refine their marketing strategies to gain a competitive advantage.
- Navigating the complexities of the automotive ADAS aftermarket requires a deep understanding of both technology and service logistics, particularly concerning how to calibrate forward-facing camera systems. For independent repair shops, the decision to offer these services hinges on the accessibility of an adas diagnostic tool for all brands, as vehicle parc diversity makes single-OEM solutions impractical.
- A primary concern for service providers is the liability for incorrect adas calibration, which has led to a more than 50% increase in demand for tools that provide verifiable documentation of the repair process.
- The process of adas calibration after windshield replacement is now a standard, non-negotiable step in over 85% of modern vehicle glass jobs, directly impacting workflow and profitability. For fleet operators, the focus is on commercial vehicle adas retrofit solutions, which balance upfront cost with long-term safety improvements and insurance premium reductions.
- Evaluating the total cost of ownership is essential when integrating these advanced systems into existing fleets.
What are the key market drivers leading to the rise in the adoption of Automotive ADAS Aftermarket Industry?
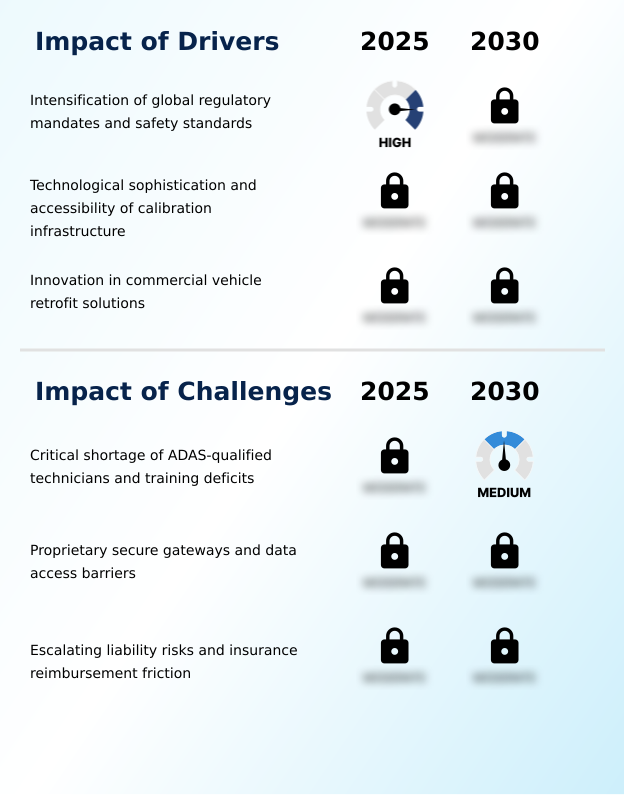
- The intensification of global regulatory mandates and vehicle safety standards is the primary driver compelling growth in the automotive ADAS aftermarket.
- Intensifying global vehicle safety standards are the primary driver for the automotive ADAS aftermarket, with mandates for automated emergency braking and lane departure warning creating a legally backed service market.
- These regulations, which can cause a vehicle to fail inspection in over 20 countries if non-compliant, compel fleet operators and vehicle owners to seek repairs.
- This has increased demand for aftermarket sensor validation and services that meet stringent liability and insurance requirements. For instance, a proper wheel alignment now necessitates ADAS recalibration in over 85% of cases.
- The growth of the software-defined vehicle architecture also fuels demand for OEM-level diagnostics and analysis of telematics data to ensure pedestrian detection systems and other features function correctly post-repair.
What are the market trends shaping the Automotive ADAS Aftermarket Industry?
- The integration of artificial intelligence and computer vision is automating calibration workflows. This shift addresses the complexity of modern sensor suites and reduces reliance on manual processes.
- The systemic integration of artificial intelligence is automating ADAS calibration, with AI-driven systems reducing setup time by up to 75% compared to manual methods. This trend, a direct response to rising vehicle complexity, impacts over 80% of modern collision repairs which now require some form of sensor recalibration.
- The shift to automated, machine vision-based workflows minimizes human error and establishes a digital audit trail, a critical requirement for liability and insurance purposes. This technological evolution enables general service technicians to perform complex static calibration and dynamic calibration procedures previously reserved for specialists, addressing the industry-wide labor shortage.
- The adoption of AI in automotive diagnostics also facilitates the growth of remote diagnostics services.
What challenges does the Automotive ADAS Aftermarket Industry face during its growth?
- A critical shortage of ADAS-qualified technicians, compounded by significant training deficits, presents a primary challenge to industry growth.
- The acute shortage of qualified technicians remains a critical challenge, with industry reports indicating nearly 50% of independent repair shops lack staff skilled in ADAS calibration. This proficiency gap creates a service bottleneck, forcing shops to sublet up to 30% of their ADAS-related work to dealerships, thereby eroding profit margins and increasing repair cycle times.
- The problem is compounded by the proliferation of the secure gateway module, which restricts vehicle network access for diagnostics. Without adequate technician training programs focused on automotive cybersecurity, CAN bus integration, and the use of modern diagnostic tools to handle diagnostic trouble codes, independent shops struggle to service these complex systems.
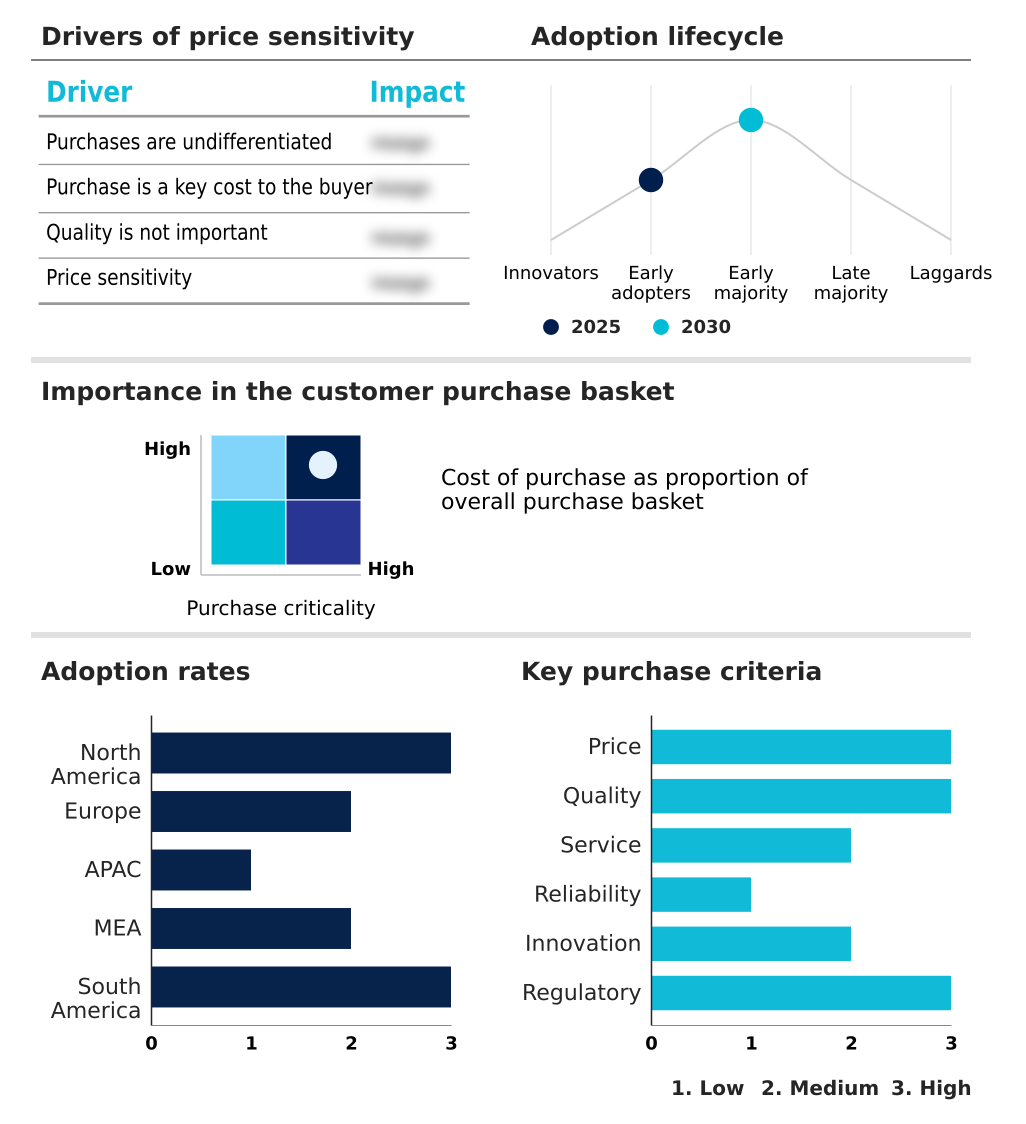
Exclusive Technavio Analysis on Customer Landscape
The automotive adas aftermarket market forecasting report includes the adoption lifecycle of the market, covering from the innovator’s stage to the laggard’s stage. It focuses on adoption rates in different regions based on penetration. Furthermore, the automotive adas aftermarket market report also includes key purchase criteria and drivers of price sensitivity to help companies evaluate and develop their market growth analysis strategies.
Customer Landscape of Automotive ADAS Aftermarket Industry
Competitive Landscape
Companies are implementing various strategies, such as strategic alliances, automotive adas aftermarket market forecast, partnerships, mergers and acquisitions, geographical expansion, and product/service launches, to enhance their presence in the industry.
Aptiv Plc - Key offerings focus on scalable ADAS sensors, integrated safety systems, and AI-driven calibration workflows for diverse vehicle platforms.
The industry research and growth report includes detailed analyses of the competitive landscape of the market and information about key companies, including:
- Aptiv Plc
- Autoliv Inc.
- Brandmotion LLC
- Continental AG
- DENSO Corp.
- Garmin Ltd.
- Gentex Corp.
- HELLA GmbH and Co. KGaA
- Knorr Bremse AG
- Magna International Inc.
- MINIEYE
- Robert Bosch GmbH
- Sasken Technologies Ltd.
- TomTom NV
- Valeo SA
- Veoneer Inc.
- ZF Friedrichshafen AG
Qualitative and quantitative analysis of companies has been conducted to help clients understand the wider business environment as well as the strengths and weaknesses of key industry players. Data is qualitatively analyzed to categorize companies as pure play, category-focused, industry-focused, and diversified; it is quantitatively analyzed to categorize companies as dominant, leading, strong, tentative, and weak.
Market Intelligence Radar: High-Impact Developments & Growth Signals
- In the Automotive Parts and Equipment industry, the increasing integration of electronic components in vehicles, with luxury models now featuring up to 150 ECUs, directly escalates the complexity of aftermarket repairs and diagnostics, driving demand for advanced diagnostic scan tools and sensor recalibration capabilities.
- The enforcement of stringent vehicle safety standards and emission control norms necessitates the adoption of sophisticated sensors and control units. This trend expands the service and repair market for the automotive ADAS aftermarket, as maintaining these systems becomes critical for regulatory compliance and vehicle inspection clearance.
- A persistent volatility in the prices of raw materials, including semiconductors and aluminum, directly impacts the manufacturing cost and supply chain stability for aftermarket parts. This pressure affects the pricing and availability of core components like automotive radar and camera modules, influencing profitability for aftermarket providers.
- The accelerated shift toward electric vehicles, which contain fewer mechanical components but a higher density of electronics, is fundamentally reshaping aftermarket service models. This transition reduces demand for traditional engine-related parts while creating significant growth in services related to battery management, electric powertrain diagnostics, and ADAS maintenance, including over-the-air updates and software-defined vehicle support.
Dive into Technavio’s robust research methodology, blending expert interviews, extensive data synthesis, and validated models for unparalleled Automotive ADAS Aftermarket Market insights. See full methodology.
| Market Scope | |
|---|---|
| Page number | 293 |
| Base year | 2025 |
| Historic period | 2020-2024 |
| Forecast period | 2026-2030 |
| Growth momentum & CAGR | Accelerate at a CAGR of 13.8% |
| Market growth 2026-2030 | USD 6048.3 million |
| Market structure | Fragmented |
| YoY growth 2025-2026(%) | 11.7% |
| Key countries | US, Canada, Mexico, Germany, UK, France, Italy, Spain, The Netherlands, China, Japan, South Korea, India, Australia, Indonesia, UAE, Saudi Arabia, South Africa, Qatar, Nigeria, Brazil, Argentina and Chile |
| Competitive landscape | Leading Companies, Market Positioning of Companies, Competitive Strategies, and Industry Risks |
Research Analyst Overview
- The automotive ADAS aftermarket ecosystem is a complex network where technology suppliers of radar and lidar sensors provide critical inputs to aftermarket manufacturers. These manufacturers, which see over 60% of their revenue tied to collision-related repairs, depend on distribution channels ranging from large auto parts retailers to specialized service centers.
- Regulatory bodies and insurance carriers exert significant influence, setting the standards for calibration and repair that can increase service costs by up to 30% per job if OEM procedures are strictly followed. End-users, including individual vehicle owners and commercial fleet managers, drive demand based on safety needs and compliance mandates.
- The ecosystem is supported by technology firms developing diagnostic software and training organizations working to close the industry's significant technician skill gap.
What are the Key Data Covered in this Automotive ADAS Aftermarket Market Research and Growth Report?
-
What is the expected growth of the Automotive ADAS Aftermarket Market between 2026 and 2030?
-
The Automotive ADAS Aftermarket Market is expected to grow by USD 6.05 billion during 2026-2030, registering a CAGR of 13.8%. Year-over-year growth in 2026 is estimated at 11.7%%. This acceleration is shaped by intensification of global regulatory mandates and safety standards, which is intensifying demand across multiple end-use verticals covered in the report.
-
-
What segmentation does the market report cover?
-
The report is segmented by Technology (Passive park assists, FCWS and LDWS, and Others), Vehicle Type (Passenger vehicles, and Commercial vehicles), Channel (OEM-fitted ADAS, and Independent aftermarket) and Geography (North America, Europe, APAC, Middle East and Africa, South America). Among these, the Passive park assists segment is estimated to witness significant growth during the forecast period, driven by rising adoption across key application areas. Each segment includes detailed qualitative and quantitative analysis, along with historical data from 2020-2024 and forecasts through 2030 with year-over-year growth rates.
-
-
Which regions are analyzed in the report?
-
The report covers North America, Europe, APAC, Middle East and Africa and South America. North America is estimated to contribute 38% to market growth during the forecast period. Country-level analysis includes US, Canada, Mexico, Germany, UK, France, Italy, Spain, The Netherlands, China, Japan, South Korea, India, Australia, Indonesia, UAE, Saudi Arabia, South Africa, Qatar, Nigeria, Brazil, Argentina and Chile, with dedicated market size tables and year-over-year growth for each.
-
-
What are the key growth drivers and market challenges?
-
The primary driver is intensification of global regulatory mandates and safety standards, which is accelerating investment and industry demand. The main challenge is critical shortage of adas-qualified technicians and training deficits, creating operational barriers for key market participants. The report quantifies the impact of each driver and challenge across 2026 and 2030 with comparative analysis.
-
-
Who are the major players in the Automotive ADAS Aftermarket Market?
-
Key vendors include Aptiv Plc, Autoliv Inc., Brandmotion LLC, Continental AG, DENSO Corp., Garmin Ltd., Gentex Corp., HELLA GmbH and Co. KGaA, Knorr Bremse AG, Magna International Inc., MINIEYE, Robert Bosch GmbH, Sasken Technologies Ltd., TomTom NV, Valeo SA, Veoneer Inc. and ZF Friedrichshafen AG. The report provides qualitative and quantitative analysis categorizing companies as dominant, leading, strong, tentative, and weak based on their market positioning. Company profiles include business segment analysis, SWOT assessment, key offerings, and recent strategic developments.
-
Market Research Insights
- The competitive landscape of the automotive ADAS aftermarket, where the top five vendors comprise less than 40% of the market, is characterized by portfolio realignment and technological convergence.
- Key vendors are adapting to the rise of the software-defined vehicle; for example, some are divesting passenger car ADAS units to focus on the more lucrative commercial vehicle sector, while others like Robert Bosch GmbH are emphasizing integrated diagnostic workflows that reduce calibration times by over 50%.
- These strategic moves address the industry's need for efficiency and precision in collision repair. The market is also responding to the challenge of restricted data access from secure gateways, with companies forming partnerships to gain authorized access and maintain competitiveness in a rapidly evolving technological environment.
We can help! Our analysts can customize this automotive adas aftermarket market research report to meet your requirements.
 RIA -
RIA - 
