
Automotive Adhesive Tapes Market Analysis, Size, and Forecast 2026-2030: APAC (China, Japan, and India), Europe (Germany, UK, and France), North America (US, Canada, and Mexico), South America (Brazil, Argentina, and Chile), Middle East and Africa (Saudi Arabia, Turkey, and UAE), and Rest of World (ROW)

Automotive Adhesive Tapes Market Analysis, Size, and Forecast 2026-2030:
APAC (China, Japan, and India), Europe (Germany, UK, and France), North America (US, Canada, and Mexico), South America (Brazil, Argentina, and Chile), Middle East and Africa (Saudi Arabia, Turkey, and UAE), and Rest of World (ROW)

Published: Oct 2026 298 Pages SKU: IRTNTR73284

Market Overview at a Glance

$3.28 B
Market Opportunity
5.1%
CAGR 2025 - 2030
46.8%
APAC Growth
$7.09 B
Interior segment 2024

Automotive Adhesive Tapes Market Size 2026-2030

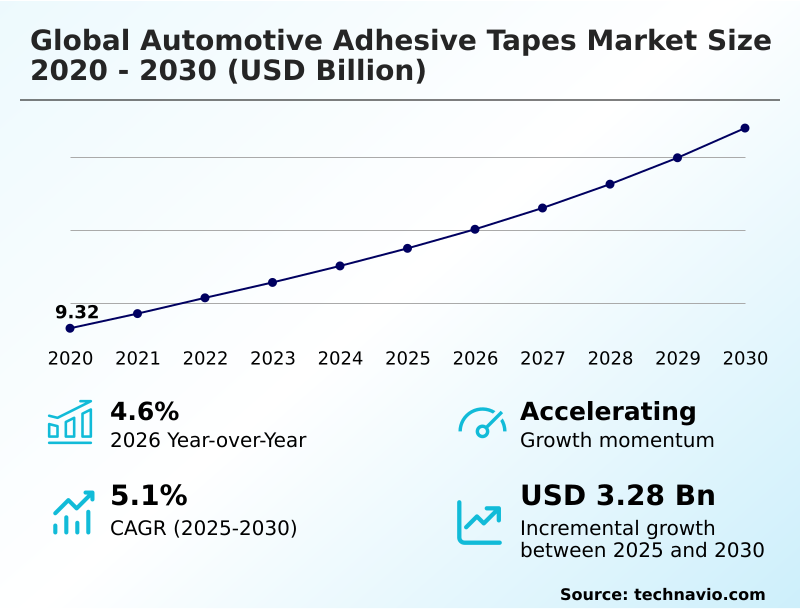
The automotive adhesive tapes market size is valued to increase by USD 3.28 billion, at a CAGR of 5.1% from 2025 to 2030. Vehicle lightweighting and material efficiency will drive the automotive adhesive tapes market.

Major Market Trends & Insights

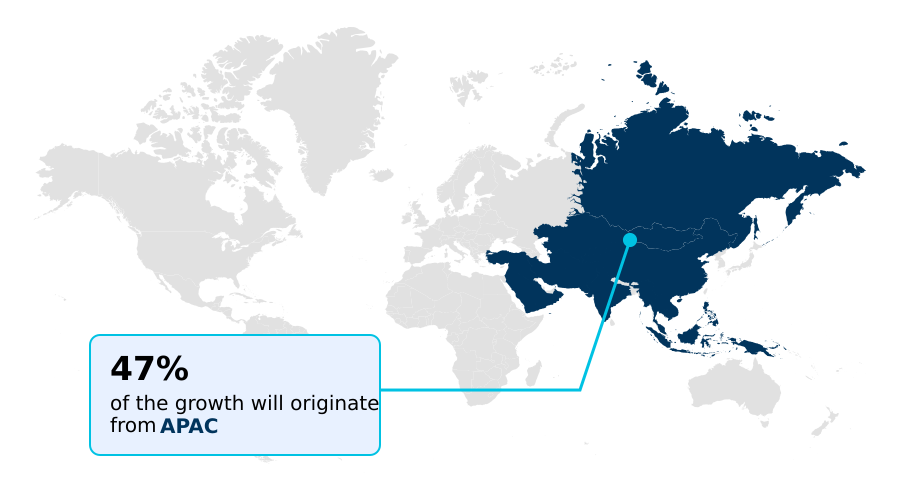
  • APAC dominated the market and accounted for a 46.8% growth during the forecast period.
  • By Application - Interior segment was valued at USD 7.09 billion in 2024
  • By Material - Polypropylene segment accounted for the largest market revenue share in 2024

Market Size & Forecast

  • Market Opportunities: USD 5.46 billion
  • Market Future Opportunities: USD 3.28 billion
  • CAGR from 2025 to 2030 : 5.1%

Market Summary

  • The Automotive Adhesive Tapes Market demonstrates a profound structural evolution as modern vehicle manufacturing increasingly prioritizes lightweight materials and advanced electrical integration. Traditional mechanical fasteners are steadily being replaced by high-performance pressure-sensitive tapes that distribute stress evenly across bonded surfaces.
  • In modern supply chain operations, original equipment manufacturers leverage these advanced tapes to streamline assembly line workflows, effectively reducing component installation times by 20% compared to legacy welding and riveting processes.
  • A primary driver of this market is the rapid electrification of powertrains; electric vehicles demand robust thermal management and secure cell-to-cell battery bonding, making specialized electrical tapes indispensable for preventing short circuits. Conversely, the market faces significant challenges regarding extreme thermal and environmental stress resistance.
  • When specialized tapes are exposed to severe temperature fluctuations and road chemicals, they risk premature polymer degradation and delamination, forcing chemical producers to invest heavily in advanced cross-linked formulations. Ultimately, continuous material innovation ensures these bonding solutions satisfy strict regulatory mandates and the rigorous durability expectations of the contemporary automotive sector.

What will be the Size of the Automotive Adhesive Tapes Market during the forecast period?
Get Key Insights on Market Forecast (PDF) Get Free Sample

How is the Automotive Adhesive Tapes Market Segmented?

The automotive adhesive tapes industry research report provides comprehensive data (region-wise segment analysis), with forecasts and estimates in "USD million" for the period 2026-2030, as well as historical data from 2020-2024 for the following segments.

  • Application
    • Interior
    • Exterior
    • Others
  • Material
    • Polypropylene
    • Paper
    • Others
  • Channel
    • OEM
    • Aftermarket
  • Geography
    • APAC
      • China
      • Japan
      • India
      • South Korea
      • Australia
      • Indonesia
    • Europe
      • Germany
      • UK
      • France
      • Italy
      • Spain
      • The Netherlands
    • North America
      • US
      • Canada
      • Mexico
    • South America
      • Brazil
      • Argentina
      • Chile
    • Middle East and Africa
      • Saudi Arabia
      • Turkey
      • UAE
      • South Africa
      • Israel

By Application Insights

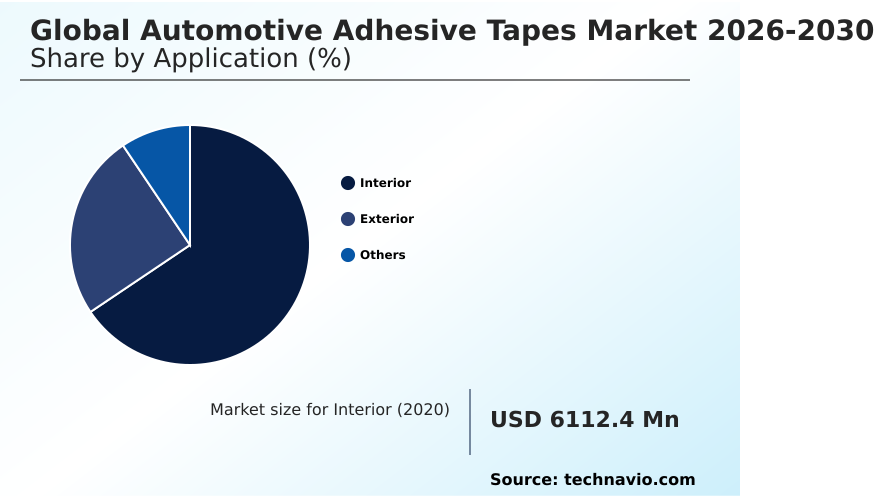
The interior segment is estimated to witness significant growth during the forecast period.

The interior segment within the Automotive Adhesive Tapes market serves as a fundamental component for enhancing passenger cabin acoustics and fulfilling modern automotive design philosophy.

As manufacturers transition toward modular component assembly, traditional mechanical fasteners are increasingly being replaced by advanced structural bonding tapes. These sophisticated pressure-sensitive adhesives provide seamless integration of diverse substrates while significantly mitigating interior noise and vibration harshness.

Assembly operations utilizing cross-linked polymer formulations and acoustic insulation panels have demonstrated a 15% reduction in overall cabin noise levels compared to legacy mechanical attachment methods.

This transition away from rigid fasteners prevents material fatigue and ensures uniform stress distribution across delicate interior trim components.

Furthermore, the integration of touch-sensitive surfaces and digital cockpit displays demands high-performance tapes that offer secure electrical insulation without damaging sensitive microcircuits. This continuous evolution ensures that interior bonding technologies maintain pristine aesthetic finishes while supporting broader vehicle lightweighting goals.
Get Free Sample

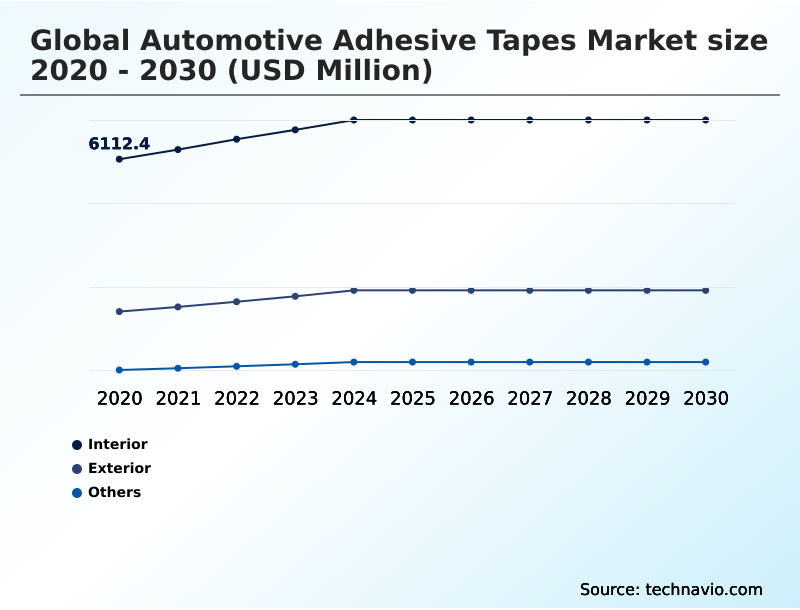
The Interior segment was valued at USD 7.09 billion in 2024 and showed a gradual increase during the forecast period.
Get Free Sample

Regional Analysis

APAC is estimated to contribute 46.8% to the growth of the global market during the forecast period.Technavio’s analysts have elaborately explained the regional trends and drivers that shape the market during the forecast period.
See How Automotive Adhesive Tapes Market Demand is Rising in APAC Get Free Sample

The geographic landscape of the Automotive Adhesive Tapes market reveals a distinct operational contrast between the manufacturing ecosystems of APAC and Europe.

Assembly hubs in APAC prioritize rapid volume expansion and cost efficiency, achieving a 24% higher adoption rate of acrylic foam tape for exterior trim and aerodynamic profile enhancement compared to European counterparts.

This accelerated integration directly supports the mass production of vehicles equipped with high-speed data communication networks and advanced driver assistance systems. In contrast, European manufacturers maintain a stringent focus on material sustainability and structural durability.

European facilities utilize specialized polyurethane foam backings and thermal interface materials to manage intricate battery assemblies, resulting in a 14% improvement in overall battery thermal efficiency.

The continuous stress distribution provided by these high-performance tapes is critical for maintaining structural integrity across varying climates. Consequently, while APAC drives volumetric manufacturing efficiency, Europe leads in the strategic deployment of advanced environmental and thermal bonding solutions.

Market Dynamics

Our researchers analyzed the data with 2025 as the base year, along with the key drivers, trends, and challenges. A holistic analysis of drivers will help companies refine their marketing strategies to gain a competitive advantage.

  • The rapid evolution of modern vehicle architecture has fundamentally transformed standard assembly protocols, positioning high-performance bonding solutions as essential components within the manufacturing ecosystem. Engineers increasingly specify acrylic foam tape for automotive exterior trims and weather sealing because it eliminates the need for mechanical fasteners, thereby preventing localized corrosion and maintaining pristine aesthetic lines.
  • This shift plays a critical role in advancing structural bonding for lightweight vehicles, allowing the seamless integration of dissimilar materials such as carbon fiber and high-strength aluminum. Consequently, assembly facilities utilizing these tapes report a 25% improvement in joint stress distribution compared to traditional spot welding.
  • As the industry pivots heavily toward electrification, ensuring efficient thermal management in battery packs has become a paramount safety and performance requirement. Specialized tapes provide vital dielectric insulation and vibration dampening between individual battery cells, effectively mitigating the risk of thermal runaway.
  • To support these precise application requirements, the implementation of automated tape dispensing in manufacturing has accelerated production line throughput while minimizing material scrap. Furthermore, stringent environmental mandates are prompting chemical suppliers to develop biobased adhesive solutions for automotive applications.
  • This strategic shift not only reduces reliance on petrochemical derivatives but also ensures compliance with rigorous indoor air quality standards, securing a resilient and sustainable supply chain for next-generation vehicle production.
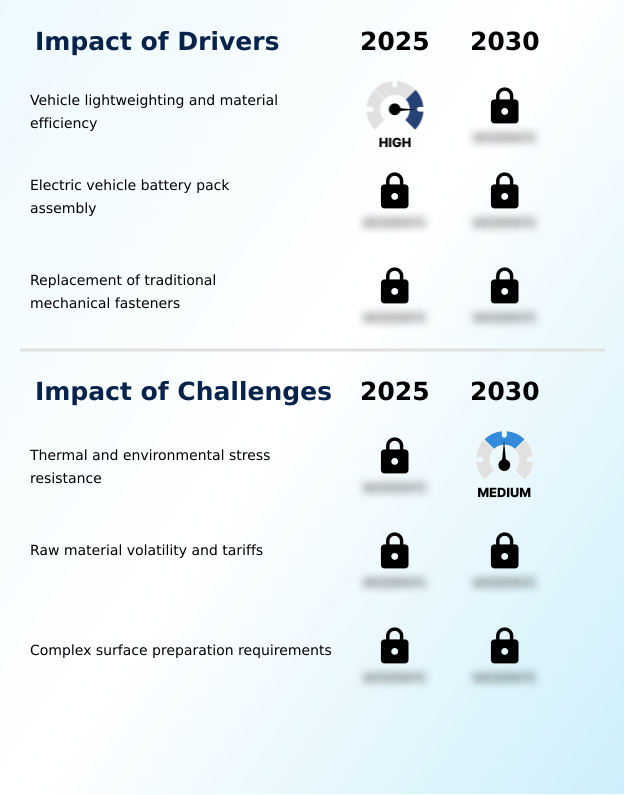
What are the key market drivers leading to the rise in the adoption of Automotive Adhesive Tapes Industry?

  • Vehicle lightweighting and material efficiency serve as the primary drivers propelling market expansion.

  • The rapid electrification of passenger transport serves as the primary structural catalyst propelling the demand for specialized Automotive Adhesive Tapes.
  • As electric vehicle powertrains become increasingly complex, automakers mandate robust thermal management barriers and advanced dielectric insulation wrap to safeguard high-voltage architectures.
  • To achieve rigorous vehicle lightweighting initiatives, engineers are heavily substituting heavy mechanical hardware with engineered tapes, facilitating highly efficient fastener-free manufacturing. This systematic material replacement enables a 12% reduction in overall battery module weight, directly extending the operational driving range.
  • Furthermore, essential cell-to-cell battery bonding and critical wire harnessing protection are entirely reliant on these high-performance tapes to prevent short circuits and thermal runaway events.
  • By effectively managing heat dissipation and dampening mechanical vibrations by up to 25%, these bonding solutions ensure the long-term structural reliability and safety of modern energy storage systems.

What are the market trends shaping the Automotive Adhesive Tapes Industry?

  • The adoption of sustainable biobased formulations represents a significant emerging trend within the market. This shift reflects a broader industry commitment to reducing environmental impact and enhancing material sustainability.

  • The adoption of sustainable and highly precise manufacturing processes is reshaping the functional deployment of Automotive Adhesive Tapes across global assembly lines. Driven by stringent circular economy mandates and a broader sustainable mobility transition, manufacturers are actively substituting synthetic rubber compounds with eco-friendly biobased adhesive solutions.
  • This material shift toward solvent-free tape production has reduced volatile emissions on the factory floor by 18%, significantly improving compliance with international environmental standards. Concurrently, the integration of smart factory automation enables the precise application of these tapes. Automated tape dispensing systems guarantee uniform tension and positioning, which has lowered material scrap rates by 22% during high-speed production cycles.
  • By minimizing human error, these advanced robotic dispensing units accelerate vehicle throughput. Consequently, the rapid alignment of green chemistry with automated manufacturing not only lowers operational overhead but also ensures that critical vehicle components meet the highest standards of durability and performance.

What challenges does the Automotive Adhesive Tapes Industry face during its growth?

  • Ensuring thermal and environmental stress resistance remains a critical challenge that impedes overall industry growth.

  • Ensuring long-term interfacial bond strength under harsh environmental conditions remains a formidable engineering hurdle for the Automotive Adhesive Tapes market. Advanced lightweight vehicle architectures increasingly incorporate low-surface-energy plastics and composite materials that inherently resist standard heat-activated adhesive chemistry. To prevent premature delamination during extreme thermal cycling, assembly plants must implement capital-intensive plasma surface treatment protocols.
  • These meticulous surface preparation requirements often increase localized operational processing times by 15%, causing potential bottlenecks on high-speed production lines. Furthermore, compliance with rigorous emission control norms strictly limits the use of traditional chemical primers that release volatile organic compounds.
  • Consequently, chemical suppliers face substantial research and development costs to reformulate compliant tapes, which has increased testing cycle durations by 20%. Addressing these material science limitations is critical, as minor surface contaminations can compromise the structural integrity of the entire vehicle assembly.

Exclusive Technavio Analysis on Customer Landscape

The automotive adhesive tapes market forecasting report includes the adoption lifecycle of the market, covering from the innovator’s stage to the laggard’s stage. It focuses on adoption rates in different regions based on penetration. Furthermore, the automotive adhesive tapes market report also includes key purchase criteria and drivers of price sensitivity to help companies evaluate and develop their market growth analysis strategies.
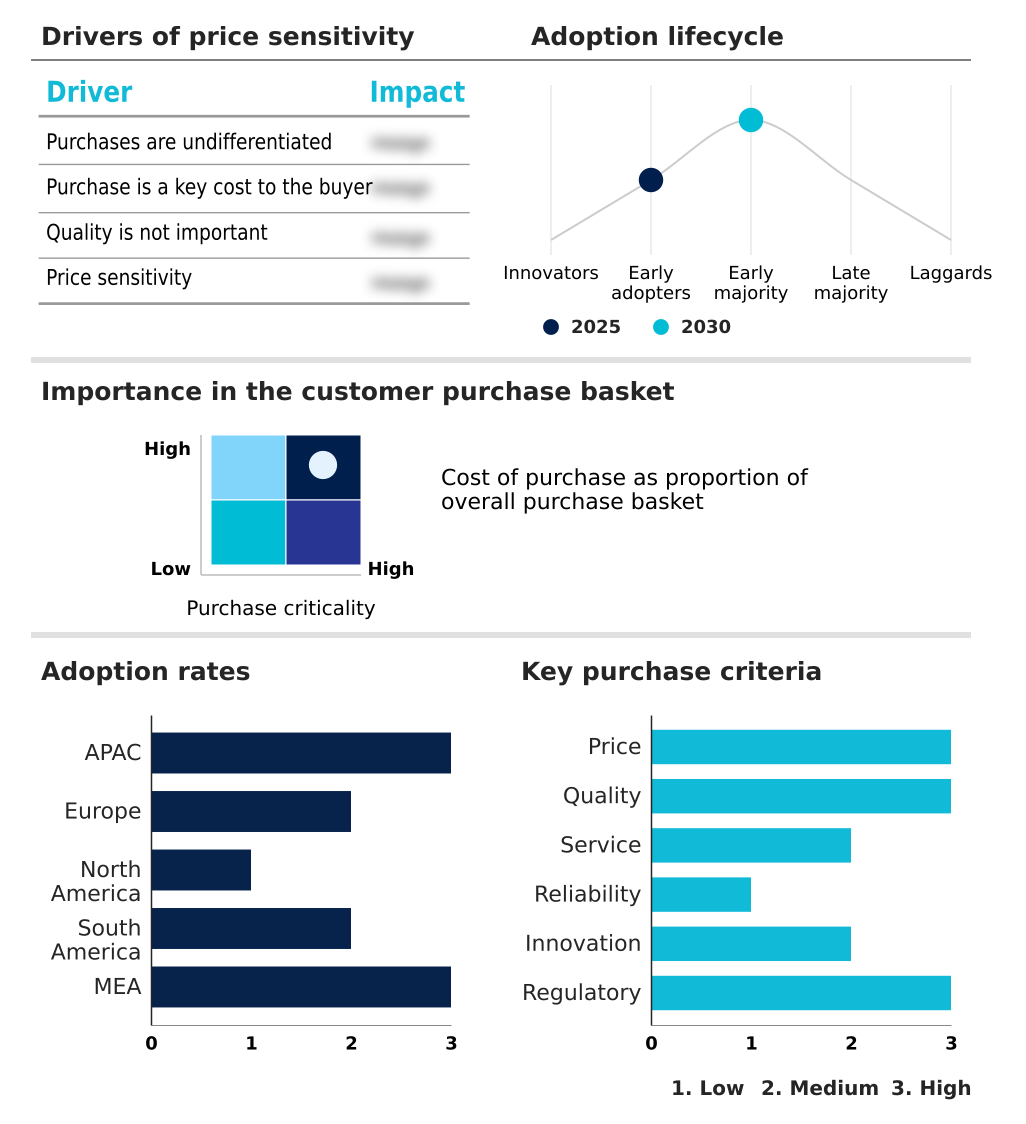
Customer Landscape of Automotive Adhesive Tapes Industry

Competitive Landscape

Companies are implementing various strategies, such as strategic alliances, automotive adhesive tapes market forecast, partnerships, mergers and acquisitions, geographical expansion, and product/service launches, to enhance their presence in the industry.

3M Co. - The vendor provides advanced acrylic foam tapes and specialized bonding solutions for trim attachment, emblem mounting, and streamlined vehicle assembly, enhancing structural integrity without relying on mechanical fasteners.

The industry research and growth report includes detailed analyses of the competitive landscape of the market and information about key companies, including:

  • 3M Co.
  • Adchem Corp
  • Adhesives Research Inc.
  • Advance Tapes International Ltd.
  • American Biltrite Inc.
  • ATP adhesive systems AG
  • Avery Dennison Corp.
  • Compagnie de Saint Gobain SA
  • Coroplast Fritz Muller GmbH
  • ECHOtape
  • Intertape Polymer Group Inc.
  • Lohmann GmbH and Co.KG
  • Mactac Americas LLC
  • Nitto Denko Corp.
  • ORAFOL Europe GmbH
  • PPM Industries SpA
  • Scapa Industrial
  • Sekisui Chemical Co. Ltd.
  • Shurtape Technologies LLC
  • Sika AG
  • tesa SE

Qualitative and quantitative analysis of companies has been conducted to help clients understand the wider business environment as well as the strengths and weaknesses of key industry players. Data is qualitatively analyzed to categorize companies as pure play, category-focused, industry-focused, and diversified; it is quantitatively analyzed to categorize companies as dominant, leading, strong, tentative, and weak.

Recent Development and News in Automotive adhesive tapes market

  • In the Automotive Parts and Equipment industry, rigorous vehicle lightweighting initiatives have reduced traditional steel usage by 18%, directly impacting Automotive Adhesive Tapes demand by accelerating the shift toward fastener-free manufacturing and advanced aerodynamic profile enhancement.
  • The widespread adoption of modular electric vehicle powertrains has increased high-voltage module density by 22%, directly impacting Automotive Adhesive Tapes demand by necessitating advanced driver assistance integration and robust protection against extreme thermal cycling.
  • Stringent international emission control norms targeting volatile facility emissions have forced chemical suppliers to phase out solvent-heavy surface primers, directly impacting Automotive Adhesive Tapes demand by accelerating the sustainable mobility transition and strict adherence to circular economy mandates.
  • The integration of smart factory automation and modular component assembly lines has improved manufacturing throughput by 25%, directly impacting Automotive Adhesive Tapes demand by mandating highly uniform products optimized to withstand harsh environmental conditions.

Dive into Technavio’s robust research methodology, blending expert interviews, extensive data synthesis, and validated models for unparalleled Automotive Adhesive Tapes Market insights. See full methodology.

Market Scope
Page number 298
Base year 2025
Historic period 2020-2024
Forecast period 2026-2030
Growth momentum & CAGR Accelerate at a CAGR of 5.1%
Market growth 2026-2030 USD 3280.2 million
Market structure Fragmented
YoY growth 2025-2026(%) 4.6%
Key countries China, Japan, India, South Korea, Australia, Indonesia, Germany, UK, France, Italy, Spain, The Netherlands, US, Canada, Mexico, Brazil, Argentina, Chile, Saudi Arabia, Turkey, UAE, South Africa and Israel
Competitive landscape Leading Companies, Market Positioning of Companies, Competitive Strategies, and Industry Risks

Request Free Sample

Research Analyst Overview

  • The Automotive Adhesive Tapes Market reflects a critical paradigm shift in vehicle engineering, fundamentally altering how modern automobiles are assembled and protected. Corporate boardrooms are increasingly prioritizing lightweight architectures and sophisticated cabin electronics, driving a strategic transition toward high-performance pressure-sensitive adhesives.
  • This operational shift away from heavy mechanical fasteners enables continuous stress distribution across joined components, directly enhancing vehicle crashworthiness and structural integrity. By integrating advanced acoustic insulation panels and specialized thermal interface materials, automotive manufacturers have achieved a 20% improvement in internal noise reduction and temperature regulation compared to legacy insulation methods.
  • Furthermore, the rapid proliferation of electric mobility necessitates reliable dielectric insulation wrap to safeguard high-voltage battery modules against catastrophic failures. To execute these precise applications, facilities are rapidly adopting automated tape dispensing systems, which effectively manage the complex bonding of low-surface-energy plastics at high speeds.
  • These strategic material investments ensure strict alignment with international safety standards while optimizing production efficiency and advancing the long-term sustainability of the global automotive manufacturing sector.

What are the Key Data Covered in this Automotive Adhesive Tapes Market Research and Growth Report?

  • What is the expected growth of the Automotive Adhesive Tapes Market between 2026 and 2030?

    • USD 3.28 billion, at a CAGR of 5.1%

  • What segmentation does the market report cover?

    • The report is segmented by Application (Interior, Exterior, and Others), Material (Polypropylene, Paper, and Others), Channel (OEM, and Aftermarket) and Geography (APAC, Europe, North America, South America, Middle East and Africa)

  • Which regions are analyzed in the report?

    • APAC, Europe, North America, South America and Middle East and Africa

  • What are the key growth drivers and market challenges?

    • Vehicle lightweighting and material efficiency, Thermal and environmental stress resistance

  • Who are the major players in the Automotive Adhesive Tapes Market?

    • 3M Co., Adchem Corp, Adhesives Research Inc., Advance Tapes International Ltd., American Biltrite Inc., ATP adhesive systems AG, Avery Dennison Corp., Compagnie de Saint Gobain SA, Coroplast Fritz Muller GmbH, ECHOtape, Intertape Polymer Group Inc., Lohmann GmbH and Co.KG, Mactac Americas LLC, Nitto Denko Corp., ORAFOL Europe GmbH, PPM Industries SpA, Scapa Industrial, Sekisui Chemical Co. Ltd., Shurtape Technologies LLC, Sika AG and tesa SE

Market Research Insights

  • The Automotive Adhesive Tapes Market is rapidly evolving to support sophisticated vehicle lightweighting initiatives and modern digital architectures. Assembly plants implementing fastener-free manufacturing have observed a 15% reduction in overall structural weight, directly enhancing fuel efficiency and electric vehicle range.
  • Furthermore, the integration of smart factory automation ensures highly precise robotic tape application, which has decreased material waste by 18% during high-volume production runs. As manufacturers strictly adhere to global emission control norms, the transition toward solvent-free adhesives has reduced volatile facility emissions by 22%.
  • These engineered bonding solutions also provide vital durability against extreme thermal cycling, safeguarding complex electronic sensors and battery modules to ensure long-term vehicle reliability and compliance.

We can help! Our analysts can customize this automotive adhesive tapes market research report to meet your requirements.

Get in touch

1. Executive Summary

1.1 Market overview

Executive Summary - Chart on Market Overview
Executive Summary - Data Table on Market Overview
Executive Summary - Chart on Global Market Characteristics
Executive Summary - Chart on Market by Geography
Executive Summary - Chart on Market Segmentation by Application
Executive Summary - Chart on Market Segmentation by Material
Executive Summary - Chart on Market Segmentation by Channel
Executive Summary - Chart on Incremental Growth
Executive Summary - Data Table on Incremental Growth
Executive Summary - Chart on Company Market Positioning

2. Technavio Analysis

2.1 Analysis of price sensitivity, lifecycle, customer purchase basket, adoption rates, and purchase criteria

2.2 Criticality of inputs and Factors of differentiation

Chart on Overview on criticality of inputs and factors of differentiation

2.3 Factors of disruption

Chart on Overview on factors of disruption

2.4 Impact of drivers and challenges

Chart on Impact of drivers and challenges in 2025 and 2030

3. Market Landscape

3.1 Market ecosystem

Chart on Parent Market
Data Table on - Parent Market

3.2 Market characteristics

Chart on Market characteristics analysis

3.3 Value chain analysis

Chart on Value chain analysis

4. Market Sizing

4.1 Market definition

Data Table on Offerings of companies included in the market definition

4.2 Market segment analysis

Market segments

4.3 Market size 2025

4.4 Market outlook: Forecast for 2025-2030

Chart on Global - Market size and forecast 2025-2030 ($ million)
Data Table on Global - Market size and forecast 2025-2030 ($ million)
Chart on Global Market: Year-over-year growth 2025-2030 (%)
Data Table on Global Market: Year-over-year growth 2025-2030 (%)

5. Historic Market Size

5.1 Global Automotive Adhesive Tapes Market 2020 - 2024

Historic Market Size - Data Table on Global Automotive Adhesive Tapes Market 2020 - 2024 ($ million)

5.2 Application segment analysis 2020 - 2024

Historic Market Size - Application Segment 2020 - 2024 ($ million)

5.3 Material segment analysis 2020 - 2024

Historic Market Size - Material Segment 2020 - 2024 ($ million)

5.4 Channel segment analysis 2020 - 2024

Historic Market Size - Channel Segment 2020 - 2024 ($ million)

5.5 Geography segment analysis 2020 - 2024

Historic Market Size - Geography Segment 2020 - 2024 ($ million)

5.6 Country segment analysis 2020 - 2024

Historic Market Size - Country Segment 2020 - 2024 ($ million)

6. Qualitative Analysis

6.1 Impact of AI on Global Automotive Adhesive Tapes Market

6.2 Impact of geopolitical conflicts on Global Automotive Adhesive Tapes Market

7. Five Forces Analysis

7.1 Five forces summary

Five forces analysis - Comparison between 2025 and 2030

7.2 Bargaining power of buyers

Bargaining power of buyers - Impact of key factors 2025 and 2030

7.3 Bargaining power of suppliers

Bargaining power of suppliers - Impact of key factors in 2025 and 2030

7.4 Threat of new entrants

Threat of new entrants - Impact of key factors in 2025 and 2030

7.5 Threat of substitutes

Threat of substitutes - Impact of key factors in 2025 and 2030

7.6 Threat of rivalry

Threat of rivalry - Impact of key factors in 2025 and 2030

7.7 Market condition

Chart on Market condition - Five forces 2025 and 2030

8. Market Segmentation by Application

8.1 Market segments

Chart on Application - Market share 2025-2030 (%)
Data Table on Application - Market share 2025-2030 (%)

8.2 Comparison by Application

Chart on Comparison by Application
Data Table on Comparison by Application

8.3 Interior - Market size and forecast 2025-2030

Chart on Interior - Market size and forecast 2025-2030 ($ million)
Data Table on Interior - Market size and forecast 2025-2030 ($ million)
Chart on Interior - Year-over-year growth 2025-2030 (%)
Data Table on Interior - Year-over-year growth 2025-2030 (%)

8.4 Exterior - Market size and forecast 2025-2030

Chart on Exterior - Market size and forecast 2025-2030 ($ million)
Data Table on Exterior - Market size and forecast 2025-2030 ($ million)
Chart on Exterior - Year-over-year growth 2025-2030 (%)
Data Table on Exterior - Year-over-year growth 2025-2030 (%)

8.5 Others - Market size and forecast 2025-2030

Chart on Others - Market size and forecast 2025-2030 ($ million)
Data Table on Others - Market size and forecast 2025-2030 ($ million)
Chart on Others - Year-over-year growth 2025-2030 (%)
Data Table on Others - Year-over-year growth 2025-2030 (%)

8.6 Market opportunity by Application

Market opportunity by Application ($ million)
Data Table on Market opportunity by Application ($ million)

9. Market Segmentation by Material

9.1 Market segments

Chart on Material - Market share 2025-2030 (%)
Data Table on Material - Market share 2025-2030 (%)

9.2 Comparison by Material

Chart on Comparison by Material
Data Table on Comparison by Material

9.3 Polypropylene - Market size and forecast 2025-2030

Chart on Polypropylene - Market size and forecast 2025-2030 ($ million)
Data Table on Polypropylene - Market size and forecast 2025-2030 ($ million)
Chart on Polypropylene - Year-over-year growth 2025-2030 (%)
Data Table on Polypropylene - Year-over-year growth 2025-2030 (%)

9.4 Paper - Market size and forecast 2025-2030

Chart on Paper - Market size and forecast 2025-2030 ($ million)
Data Table on Paper - Market size and forecast 2025-2030 ($ million)
Chart on Paper - Year-over-year growth 2025-2030 (%)
Data Table on Paper - Year-over-year growth 2025-2030 (%)

9.5 Others - Market size and forecast 2025-2030

Chart on Others - Market size and forecast 2025-2030 ($ million)
Data Table on Others - Market size and forecast 2025-2030 ($ million)
Chart on Others - Year-over-year growth 2025-2030 (%)
Data Table on Others - Year-over-year growth 2025-2030 (%)

9.6 Market opportunity by Material

Market opportunity by Material ($ million)
Data Table on Market opportunity by Material ($ million)

10. Market Segmentation by Channel

10.1 Market segments

Chart on Channel - Market share 2025-2030 (%)
Data Table on Channel - Market share 2025-2030 (%)

10.2 Comparison by Channel

Chart on Comparison by Channel
Data Table on Comparison by Channel

10.3 OEM - Market size and forecast 2025-2030

Chart on OEM - Market size and forecast 2025-2030 ($ million)
Data Table on OEM - Market size and forecast 2025-2030 ($ million)
Chart on OEM - Year-over-year growth 2025-2030 (%)
Data Table on OEM - Year-over-year growth 2025-2030 (%)

10.4 Aftermarket - Market size and forecast 2025-2030

Chart on Aftermarket - Market size and forecast 2025-2030 ($ million)
Data Table on Aftermarket - Market size and forecast 2025-2030 ($ million)
Chart on Aftermarket - Year-over-year growth 2025-2030 (%)
Data Table on Aftermarket - Year-over-year growth 2025-2030 (%)

10.5 Market opportunity by Channel

Market opportunity by Channel ($ million)
Data Table on Market opportunity by Channel ($ million)

11. Customer Landscape

11.1 Customer landscape overview

Analysis of price sensitivity, lifecycle, customer purchase basket, adoption rates, and purchase criteria

12. Geographic Landscape

12.1 Geographic segmentation

Chart on Market share by geography 2025-2030 (%)
Data Table on Market share by geography 2025-2030 (%)

12.2 Geographic comparison

Chart on Geographic comparison
Data Table on Geographic comparison

12.3 APAC - Market size and forecast 2025-2030

Chart on APAC - Market size and forecast 2025-2030 ($ million)
Data Table on APAC - Market size and forecast 2025-2030 ($ million)
Chart on APAC - Year-over-year growth 2025-2030 (%)
Data Table on APAC - Year-over-year growth 2025-2030 (%)
Chart on Regional Comparison - APAC
Data Table on Regional Comparison - APAC

12.3.1 China - Market size and forecast 2025-2030

Chart on China - Market size and forecast 2025-2030 ($ million)
Data Table on China - Market size and forecast 2025-2030 ($ million)
Chart on China - Year-over-year growth 2025-2030 (%)
Data Table on China - Year-over-year growth 2025-2030 (%)

12.3.2 Japan - Market size and forecast 2025-2030

Chart on Japan - Market size and forecast 2025-2030 ($ million)
Data Table on Japan - Market size and forecast 2025-2030 ($ million)
Chart on Japan - Year-over-year growth 2025-2030 (%)
Data Table on Japan - Year-over-year growth 2025-2030 (%)

12.3.3 India - Market size and forecast 2025-2030

Chart on India - Market size and forecast 2025-2030 ($ million)
Data Table on India - Market size and forecast 2025-2030 ($ million)
Chart on India - Year-over-year growth 2025-2030 (%)
Data Table on India - Year-over-year growth 2025-2030 (%)

12.3.4 South Korea - Market size and forecast 2025-2030

Chart on South Korea - Market size and forecast 2025-2030 ($ million)
Data Table on South Korea - Market size and forecast 2025-2030 ($ million)
Chart on South Korea - Year-over-year growth 2025-2030 (%)
Data Table on South Korea - Year-over-year growth 2025-2030 (%)

12.3.5 Australia - Market size and forecast 2025-2030

Chart on Australia - Market size and forecast 2025-2030 ($ million)
Data Table on Australia - Market size and forecast 2025-2030 ($ million)
Chart on Australia - Year-over-year growth 2025-2030 (%)
Data Table on Australia - Year-over-year growth 2025-2030 (%)

12.3.6 Indonesia - Market size and forecast 2025-2030

Chart on Indonesia - Market size and forecast 2025-2030 ($ million)
Data Table on Indonesia - Market size and forecast 2025-2030 ($ million)
Chart on Indonesia - Year-over-year growth 2025-2030 (%)
Data Table on Indonesia - Year-over-year growth 2025-2030 (%)

12.4 Europe - Market size and forecast 2025-2030

Chart on Europe - Market size and forecast 2025-2030 ($ million)
Data Table on Europe - Market size and forecast 2025-2030 ($ million)
Chart on Europe - Year-over-year growth 2025-2030 (%)
Data Table on Europe - Year-over-year growth 2025-2030 (%)
Chart on Regional Comparison - Europe
Data Table on Regional Comparison - Europe

12.4.1 Germany - Market size and forecast 2025-2030

Chart on Germany - Market size and forecast 2025-2030 ($ million)
Data Table on Germany - Market size and forecast 2025-2030 ($ million)
Chart on Germany - Year-over-year growth 2025-2030 (%)
Data Table on Germany - Year-over-year growth 2025-2030 (%)

12.4.2 UK - Market size and forecast 2025-2030

Chart on UK - Market size and forecast 2025-2030 ($ million)
Data Table on UK - Market size and forecast 2025-2030 ($ million)
Chart on UK - Year-over-year growth 2025-2030 (%)
Data Table on UK - Year-over-year growth 2025-2030 (%)

12.4.3 France - Market size and forecast 2025-2030

Chart on France - Market size and forecast 2025-2030 ($ million)
Data Table on France - Market size and forecast 2025-2030 ($ million)
Chart on France - Year-over-year growth 2025-2030 (%)
Data Table on France - Year-over-year growth 2025-2030 (%)

12.4.4 Italy - Market size and forecast 2025-2030

Chart on Italy - Market size and forecast 2025-2030 ($ million)
Data Table on Italy - Market size and forecast 2025-2030 ($ million)
Chart on Italy - Year-over-year growth 2025-2030 (%)
Data Table on Italy - Year-over-year growth 2025-2030 (%)

12.4.5 Spain - Market size and forecast 2025-2030

Chart on Spain - Market size and forecast 2025-2030 ($ million)
Data Table on Spain - Market size and forecast 2025-2030 ($ million)
Chart on Spain - Year-over-year growth 2025-2030 (%)
Data Table on Spain - Year-over-year growth 2025-2030 (%)

12.4.6 The Netherlands - Market size and forecast 2025-2030

Chart on The Netherlands - Market size and forecast 2025-2030 ($ million)
Data Table on The Netherlands - Market size and forecast 2025-2030 ($ million)
Chart on The Netherlands - Year-over-year growth 2025-2030 (%)
Data Table on The Netherlands - Year-over-year growth 2025-2030 (%)

12.5 North America - Market size and forecast 2025-2030

Chart on North America - Market size and forecast 2025-2030 ($ million)
Data Table on North America - Market size and forecast 2025-2030 ($ million)
Chart on North America - Year-over-year growth 2025-2030 (%)
Data Table on North America - Year-over-year growth 2025-2030 (%)
Chart on Regional Comparison - North America
Data Table on Regional Comparison - North America

12.5.1 US - Market size and forecast 2025-2030

Chart on US - Market size and forecast 2025-2030 ($ million)
Data Table on US - Market size and forecast 2025-2030 ($ million)
Chart on US - Year-over-year growth 2025-2030 (%)
Data Table on US - Year-over-year growth 2025-2030 (%)

12.5.2 Canada - Market size and forecast 2025-2030

Chart on Canada - Market size and forecast 2025-2030 ($ million)
Data Table on Canada - Market size and forecast 2025-2030 ($ million)
Chart on Canada - Year-over-year growth 2025-2030 (%)
Data Table on Canada - Year-over-year growth 2025-2030 (%)

12.5.3 Mexico - Market size and forecast 2025-2030

Chart on Mexico - Market size and forecast 2025-2030 ($ million)
Data Table on Mexico - Market size and forecast 2025-2030 ($ million)
Chart on Mexico - Year-over-year growth 2025-2030 (%)
Data Table on Mexico - Year-over-year growth 2025-2030 (%)

12.6 South America - Market size and forecast 2025-2030

Chart on South America - Market size and forecast 2025-2030 ($ million)
Data Table on South America - Market size and forecast 2025-2030 ($ million)
Chart on South America - Year-over-year growth 2025-2030 (%)
Data Table on South America - Year-over-year growth 2025-2030 (%)
Chart on Regional Comparison - South America
Data Table on Regional Comparison - South America

12.6.1 Brazil - Market size and forecast 2025-2030

Chart on Brazil - Market size and forecast 2025-2030 ($ million)
Data Table on Brazil - Market size and forecast 2025-2030 ($ million)
Chart on Brazil - Year-over-year growth 2025-2030 (%)
Data Table on Brazil - Year-over-year growth 2025-2030 (%)

12.6.2 Argentina - Market size and forecast 2025-2030

Chart on Argentina - Market size and forecast 2025-2030 ($ million)
Data Table on Argentina - Market size and forecast 2025-2030 ($ million)
Chart on Argentina - Year-over-year growth 2025-2030 (%)
Data Table on Argentina - Year-over-year growth 2025-2030 (%)

12.6.3 Chile - Market size and forecast 2025-2030

Chart on Chile - Market size and forecast 2025-2030 ($ million)
Data Table on Chile - Market size and forecast 2025-2030 ($ million)
Chart on Chile - Year-over-year growth 2025-2030 (%)
Data Table on Chile - Year-over-year growth 2025-2030 (%)

12.7 Middle East and Africa - Market size and forecast 2025-2030

Chart on Middle East and Africa - Market size and forecast 2025-2030 ($ million)
Data Table on Middle East and Africa - Market size and forecast 2025-2030 ($ million)
Chart on Middle East and Africa - Year-over-year growth 2025-2030 (%)
Data Table on Middle East and Africa - Year-over-year growth 2025-2030 (%)
Chart on Regional Comparison - Middle East and Africa
Data Table on Regional Comparison - Middle East and Africa

12.7.1 Saudi Arabia - Market size and forecast 2025-2030

Chart on Saudi Arabia - Market size and forecast 2025-2030 ($ million)
Data Table on Saudi Arabia - Market size and forecast 2025-2030 ($ million)
Chart on Saudi Arabia - Year-over-year growth 2025-2030 (%)
Data Table on Saudi Arabia - Year-over-year growth 2025-2030 (%)

12.7.2 Turkey - Market size and forecast 2025-2030

Chart on Turkey - Market size and forecast 2025-2030 ($ million)
Data Table on Turkey - Market size and forecast 2025-2030 ($ million)
Chart on Turkey - Year-over-year growth 2025-2030 (%)
Data Table on Turkey - Year-over-year growth 2025-2030 (%)

12.7.3 UAE - Market size and forecast 2025-2030

Chart on UAE - Market size and forecast 2025-2030 ($ million)
Data Table on UAE - Market size and forecast 2025-2030 ($ million)
Chart on UAE - Year-over-year growth 2025-2030 (%)
Data Table on UAE - Year-over-year growth 2025-2030 (%)

12.7.4 South Africa - Market size and forecast 2025-2030

Chart on South Africa - Market size and forecast 2025-2030 ($ million)
Data Table on South Africa - Market size and forecast 2025-2030 ($ million)
Chart on South Africa - Year-over-year growth 2025-2030 (%)
Data Table on South Africa - Year-over-year growth 2025-2030 (%)

12.7.5 Israel - Market size and forecast 2025-2030

Chart on Israel - Market size and forecast 2025-2030 ($ million)
Data Table on Israel - Market size and forecast 2025-2030 ($ million)
Chart on Israel - Year-over-year growth 2025-2030 (%)
Data Table on Israel - Year-over-year growth 2025-2030 (%)

12.8 Market opportunity by geography

Market opportunity by geography ($ million)
Data Tables on Market opportunity by geography ($ million)

13. Drivers, Challenges, and Opportunity

13.1 Market drivers

Vehicle lightweighting and material efficiency
Electric vehicle battery pack assembly
Replacement of traditional mechanical fasteners

13.2 Market challenges

Thermal and environmental stress resistance
Raw material volatility and tariffs
Complex surface preparation requirements

13.3 Impact of drivers and challenges

Impact of drivers and challenges in 2025 and 2030

13.4 Market opportunities

Adoption of sustainable biobased formulations
Expansion of advanced wire harnessing
Rise of automated tape application

14. Competitive Landscape

14.1 Overview

14.2

Overview on criticality of inputs and factors of differentiation

14.3 Landscape disruption

Overview on factors of disruption

14.4 Industry risks

Impact of key risks on business

15. Competitive Analysis

15.1 Companies profiled

Companies covered

15.2 Company ranking index

15.3 Market positioning of companies

Matrix on companies position and classification

15.4 3M Co.

3M Co. - Overview
3M Co. - Business segments
3M Co. - Key news
3M Co. - Key offerings
3M Co. - Segment focus
SWOT

15.5 Advance Tapes International Ltd.

Advance Tapes International Ltd. - Overview
Advance Tapes International Ltd. - Product / Service
Advance Tapes International Ltd. - Key offerings
SWOT

15.6 American Biltrite Inc.

American Biltrite Inc. - Overview
American Biltrite Inc. - Product / Service
American Biltrite Inc. - Key offerings
SWOT

15.7 Avery Dennison Corp.

Avery Dennison Corp. - Overview
Avery Dennison Corp. - Business segments
Avery Dennison Corp. - Key news
Avery Dennison Corp. - Key offerings
Avery Dennison Corp. - Segment focus
SWOT

15.8 Compagnie de Saint Gobain SA

Compagnie de Saint Gobain SA - Overview
Compagnie de Saint Gobain SA - Business segments
Compagnie de Saint Gobain SA - Key offerings
Compagnie de Saint Gobain SA - Segment focus
SWOT

15.9 Coroplast Fritz Muller GmbH

Coroplast Fritz Muller GmbH - Overview
Coroplast Fritz Muller GmbH - Product / Service
Coroplast Fritz Muller GmbH - Key offerings
SWOT

15.10 Intertape Polymer Group Inc.

Intertape Polymer Group Inc. - Overview
Intertape Polymer Group Inc. - Product / Service
Intertape Polymer Group Inc. - Key offerings
SWOT

15.11 Lohmann GmbH and Co.KG

Lohmann GmbH and Co.KG - Overview
Lohmann GmbH and Co.KG - Product / Service
Lohmann GmbH and Co.KG - Key offerings
SWOT

15.12 Mactac Americas LLC

Mactac Americas LLC - Overview
Mactac Americas LLC - Product / Service
Mactac Americas LLC - Key offerings
SWOT

15.13 Nitto Denko Corp.

Nitto Denko Corp. - Overview
Nitto Denko Corp. - Business segments
Nitto Denko Corp. - Key offerings
Nitto Denko Corp. - Segment focus
SWOT

15.14 ORAFOL Europe GmbH

ORAFOL Europe GmbH - Overview
ORAFOL Europe GmbH - Product / Service
ORAFOL Europe GmbH - Key offerings
SWOT

15.15 Sekisui Chemical Co. Ltd.

Sekisui Chemical Co. Ltd. - Overview
Sekisui Chemical Co. Ltd. - Business segments
Sekisui Chemical Co. Ltd. - Key offerings
Sekisui Chemical Co. Ltd. - Segment focus
SWOT

15.16 Shurtape Technologies LLC

Shurtape Technologies LLC - Overview
Shurtape Technologies LLC - Product / Service
Shurtape Technologies LLC - Key offerings
SWOT

15.17 Sika AG

Sika AG - Overview
Sika AG - Business segments
Sika AG - Key news
Sika AG - Key offerings
Sika AG - Segment focus
SWOT

15.18 tesa SE

tesa SE - Overview
tesa SE - Product / Service
tesa SE - Key offerings
SWOT

16. Appendix

16.1 Scope of the report

Market definition
Objectives
Notes and caveats

16.2 Inclusions and exclusions checklist

Inclusions checklist
Exclusions checklist

16.3 Currency conversion rates for US$

16.4 Research methodology

16.5 Data procurement

Information sources

16.6 Data validation

16.7 Validation techniques employed for market sizing

16.8 Data synthesis

16.9 360 degree market analysis

16.10 List of abbreviations

Research Methodology

Technavio presents a detailed picture of the market by way of study, synthesis, and summation of data from multiple sources. The analysts have presented the various facets of the market with a particular focus on identifying the key industry influencers. The data thus presented is comprehensive, reliable, and the result of extensive research, both primary and secondary.

INFORMATION SOURCES

Primary sources

  • Manufacturers and suppliers
  • Channel partners
  • Industry experts
  • Strategic decision makers

Secondary sources

  • Industry journals and periodicals
  • Government data
  • Financial reports of key industry players
  • Historical data
  • Press releases

DATA ANALYSIS

Data Synthesis

  • Collation of data
  • Estimation of key figures
  • Analysis of derived insights

Data Validation

  • Triangulation with data models
  • Reference against proprietary databases
  • Corroboration with industry experts

REPORT WRITING

Qualitative

  • Market drivers
  • Market challenges
  • Market trends
  • Five forces analysis

Quantitative

  • Market size and forecast
  • Market segmentation
  • Geographical insights
  • Competitive landscape

Interested in this report?

Get your sample now to see our research methodology and insights!

Download Now

Frequently Asked Questions

Automotive Adhesive Tapes market growth will increase by USD 3280.2 million during 2026-2030.

The Automotive Adhesive Tapes market is expected to grow at a CAGR of 5.1% during 2026-2030.

Automotive Adhesive Tapes market is segmented by Application (Interior, Exterior, Others) Material (Polypropylene, Paper, Others) Channel (OEM, Aftermarket)

3M Co., Adchem Corp, Adhesives Research Inc., Advance Tapes International Ltd., American Biltrite Inc., ATP adhesive systems AG, Avery Dennison Corp., Compagnie de Saint Gobain SA, Coroplast Fritz Muller GmbH, ECHOtape, Intertape Polymer Group Inc., Lohmann GmbH and Co.KG, Mactac Americas LLC, Nitto Denko Corp., ORAFOL Europe GmbH, PPM Industries SpA, Scapa Industrial, Sekisui Chemical Co. Ltd., Shurtape Technologies LLC, Sika AG, tesa SE are a few of the key vendors in the Automotive Adhesive Tapes market.

APAC will register the highest growth rate of 46.8% among the other regions. Therefore, the Automotive Adhesive Tapes market in APAC is expected to garner significant business opportunities for the vendors during the forecast period.

China, Japan, India, South Korea, Australia, Indonesia, Germany, UK, France, Italy, Spain, The Netherlands, US, Canada, Mexico, Brazil, Argentina, Chile, Saudi Arabia, Turkey, UAE, South Africa, Israel

  • Vehicle lightweighting and material efficiency is the driving factor this market.

The Automotive Adhesive Tapes market vendors should focus on grabbing business opportunities from the Application segment as it accounted for the largest market share in the base year.
RIA - Research AI Assistant
Ask RIA
