Bio-Acetic Acid Market Report on APAC, North America, Europe, Middle East and Africa, South America - China, US, Germany, Japan, UK, South Korea, India, Canada, France, Brazil - Size and Forecast 2024-2028

Bio-Acetic Acid Market Report on APAC, North America, Europe, Middle East and Africa, South America - China, US, Germany, Japan, UK, South Korea, India, Canada, France, Brazil - Size and Forecast 2024-2028

Published: Oct 2024 202 Pages SKU: IRTNTR80260

Market Overview at a Glance

$68.8 Mn
Market Opportunity
5.6%
CAGR
5.1
YoY growth 2023-2024(%)

Bio Acetic Acid Market Size 2024-2028

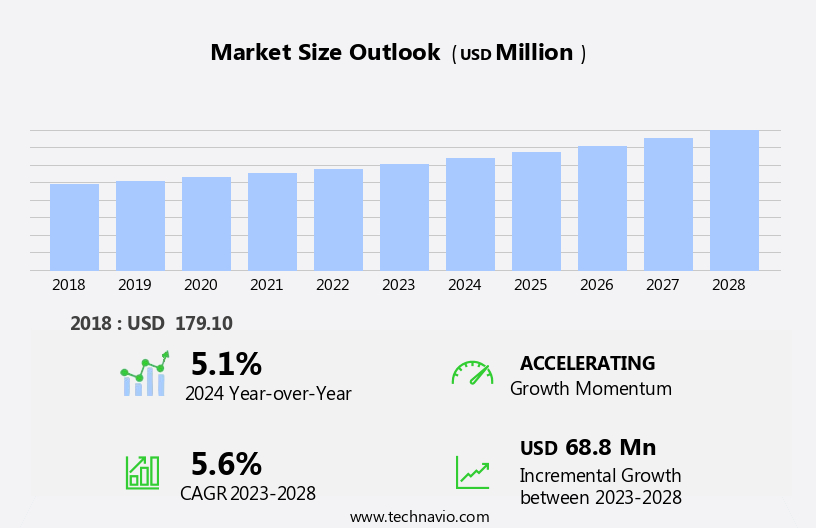
The bio acetic acid market size is forecast to increase by USD 68.8 million at a CAGR of 5.6% between 2023 and 2028.

  • The market is experiencing significant growth due to several key factors. One of the primary drivers is the rising crude oil prices, which have led to an increase In the production costs of traditional acetic acid derived from fossil fuels. In response, the production of bio-based acetic acid has expanded as it offers a more cost-effective and sustainable alternative. However, the high production costs associated with bio-based acetic acid remain a challenge for market growth. The trend toward sustainability and eco-friendliness in various industries is also fueling the demand for bio acetic acid as a renewable and biodegradable alternative to its traditional counterpart.
  • This market trends and analysis report delves deeper into these growth factors and challenges, providing valuable insights for stakeholders In the bio acetic acid industry.
  • What will be the Size of the Bio Acetic Acid Market During the Forecast Period?

    Bio Acetic Acid Market Size

     Request Free Sample

  • The bio-acetic acid market is experiencing significant growth due to the increasing demand for sustainable alternatives to petrochemical-based products. Bio-acetic acid, a renewable alternative to traditional acetic acid, is gaining traction in various industries, including polymer production, textiles, solvents, paints and coatings, and adhesives. In polymer manufacturing, bio-acetic acid is used as a feedstock for producing polyvinyl alcohol (PVOh), polyethylene terephthalate (PET), and other bioplastics and composites. In the textile industry, bio-acetic acid is used In the production of acetic anhydride, which is employed In the manufacture of cellulose acetate fibers. Additionally, bio-acetic acid is used as a solvent in paints and coatings, as well as In the production of acetic anhydride, ethyl acetate, and other chemicals used in construction activities, plastics, rubber, ink, textiles, terephthalic acid, food and beverages, vinyl acetate monomer, and photographic films.
  • The shift towards renewable chemicals is expected to continue, driving the growth of the bio-acetic acid market.
  • How is this Bio Acetic Acid Industry segmented and which is the largest segment?

    The bio acetic acid industry research report provides comprehensive data (region-wise segment analysis), with forecasts and estimates in "USD million" for the period 2024-2028, as well as historical data from 2018-2022 for the following segments.

    • Source
      • Fermentation
      • Biomass
    • End-user
      • Chemical manufacturing
      • Food industry
      • Personal care
    • Geography
      • APAC
        • China
        • India
        • Japan
        • South Korea
      • North America
        • Canada
        • US
      • Europe
        • Germany
        • UK
        • France
      • Middle East and Africa
        • South America
          • Brazil

      By Source Insights

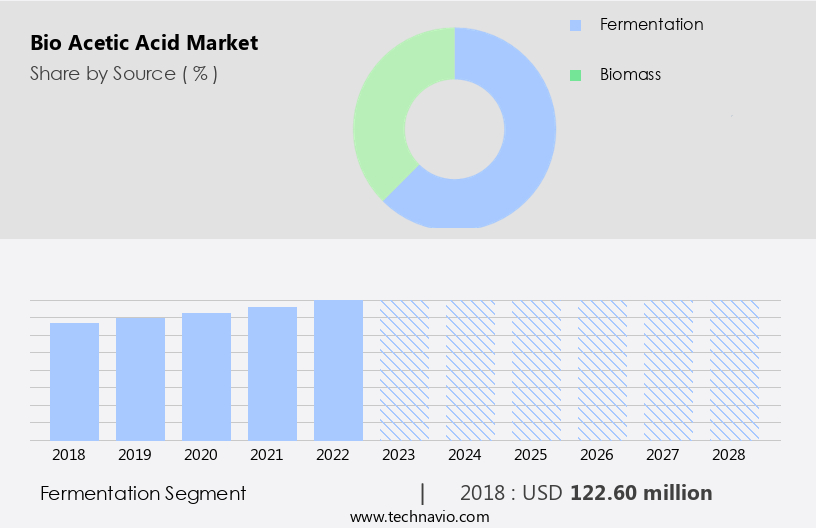
      • The fermentation segment is estimated to witness significant growth during the forecast period.

      The market is witnessing significant growth due to the increasing demand for sustainable and renewable alternatives to petrochemical-based acetic acid. Fermentation, a key process In the production of bio acetic acid, converts natural feedstocks into this valuable chemical. This method, which utilizes fermented sugars, offers a healthier and eco-friendly alternative to traditional acetic acid, derived from methanol, a substance known for its toxicity and carcinogenic properties. The shift towards safer and environmentally friendly options is driving the demand for bio acetic acid in various industries, including polymer production, textiles, solvents, paints and coatings, adhesives, emulsions, acetic anhydride, cellulose acetate, and motor vehicle manufacturing.

      Jubilant Ingrevia Limited is one of the leading players in this market, offering Bio Acetic Acid-Food Grade, derived from natural feedstocks through fermentation. This renewable alternative is gaining popularity In the food and beverages, plastics, rubber, ink, textile, terephthalic acid, and pharmaceutical industries. The construction sector, particularly in water-based paints, waterproofing coatings, and paperboard coatings, is also adopting bio acetic acid derivatives. The growth of the market is influenced by factors such as increasing consumer purchasing power, the cosmetics market, and construction activities.

      Bio Acetic Acid Market Size

      Get a glance at the  Bio Acetic Acid Industry report of share of various segments Request Free Sample

      The Fermentation segment was valued at USD 122.60 million in 2018 and showed a gradual increase during the forecast period.

      Regional Analysis

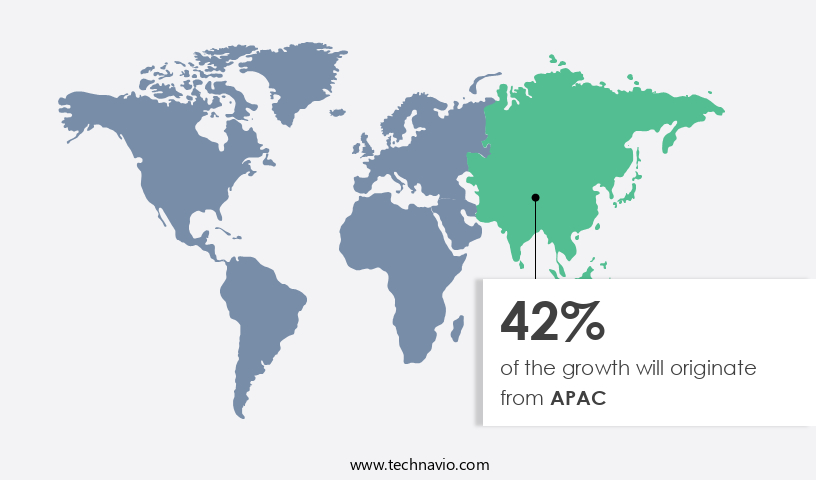
      • APAC is estimated to contribute 42% to the growth of the global market during the forecast period.

      Technavio’s analysts have elaborately explained the regional trends and drivers that shape the market during the forecast period.

      Bio Acetic Acid Market Share by Geography

      For more insights on the market share of various regions, Request Free Sample

      The Asia-Pacific region is experiencing notable growth In the market, primarily due to expanding food processing and cosmetic industries. Countries like India and China are driving this growth, bolstered by government initiatives and evolving consumer preferences. In India, the Pradhan Mantri Kisan Sampada Yojana (PMKSY) focuses on modernizing food processing infrastructure, contributing significantly to the region's the market expansion. This initiative has resulted in a substantial rise in processed food exports, increasing from 13% to 18% of the total food industry output. Additionally, China's growing textile, solvents, and paints industries are significant consumers of bio acetic acid derivatives, further fueling market growth.

      The region's the market is expected to continue expanding, with applications in various industries, including polymer production, adhesives, emulsions, and food and beverages.

      Market Dynamics

      Our  researchers analyzed the data with 2023 as the base year, along with the key drivers, trends, and challenges. A holistic analysis of drivers will help companies refine their marketing strategies to gain a competitive advantage.

      What are the key market drivers leading to the rise In the adoption of Bio Acetic Acid Industry?

      Growing crude oil prices is the key driver of the market.

    • The bio-acetic acid market is experiencing significant growth due to the increasing cost of petroleum-based chemicals and the need for sustainable alternatives. As crude oil prices rise, the production costs of petrochemicals derived from fossil fuels become more expensive, leading manufacturers to explore renewable alternatives such as bio-acetic acid. This shift is particularly important given the volatility of oil markets, which can create an unstable pricing environment for conventional petrochemicals. Bio-acetic acid is a renewable alternative to traditional acetic acid, derived from feedstocks such as corn, sugarcane, and other biomass sources. It is used in various industries, including polymer production, textiles, solvents, paints and coatings, adhesives, emulsions, and acetic anhydride production.
    • For instance, bio-acetic acid is used In the production of cellulose acetate, a key component in motor vehicle parts, textiles, and plastic bottles. In the textiles industry, bio-acetic acid is used In the production of polyvinyl alcohol (PVOH), a water-soluble polymer used in adhesives, emulsions, and paperboard coatings. In the paints and coatings industry, bio-acetic acid is used In the production of water-based paints, waterproofing coatings, and paperboard coatings. In the plastics industry, bio-acetic acid is used In the production of terephthalic acid, a key component In the production of polyester fibers and resins. The use of bio-acetic acid is also expanding In the production of vinyl acetate monomer (VAM), a key ingredient in adhesives, coatings, and plastics.
    • Bio-acetic acid is also used In the production of acetic anhydride, a key ingredient In the production of cellulose acetate and other acetic acid derivatives. The demand for bio-acetic acid is also driven by the cosmetics market, construction activities, and the pharmaceutical industry. In the cosmetics market, bio-acetic acid is used as a preservative and In the production of ethyl acetate and butyl acetate, solvents used in cosmetics and perfumes. In the construction industry, bio-acetic acid is used In the production of paints, coatings, and adhesives. In the pharmaceutical industry, bio-acetic acid is used In the production of medicines and as a preservative.
    • The food and beverages industry also uses bio-acetic acid as a preservative and In the production of food-grade quality acetic acid. The market for bio-acetic acid is expected to continue growing as more companies seek sustainable alternatives to traditional petrochemicals and as consumer purchasing power increases. The use of bio-acetic acid is also expected to expand In the production of engineering catalysts and industrial chemicals. In conclusion, the bio-acetic acid market is experiencing significant growth due to the increasing cost of petroleum-based chemicals and the need for sustainable alternatives. Bio-acetic acid is a renewable alternative used in various industries, including polymer production, textiles, solvents, paints and coatings, adhesives, emulsions, and acetic anhydride production.
    • The demand for bio-acetic acid is expected to continue growing as more companies seek sustainable alternatives and as consumer purchasing power increases.
    • What are the market trends shaping the Bio Acetic Acid Industry?

      Expansion in production of bio-based acetic acid is the upcoming market trend.

    • The Bio-acetic acid market is experiencing significant growth due to the increasing demand for sustainable alternatives to petrochemical-based products. Bio-based acetic acid is a renewable alternative to traditional acetic acid, derived from renewable feedstocks such as corn, sugarcane, and other biomass sources. This trend is particularly evident in industries such as polymer production, textiles, solvents, paints and coatings, adhesives, emulsions, and various other applications. For instance, In the polymer industry, bio-acetic acid is used In the production of Polyvinyl Alcohol (PVOH), which is a popular raw material in various industries including engineering, catalysts, and industrial chemicals. Bio-acetic acid derivatives such as acetic anhydride, cellulose acetate, and terephthalic acid are also used In the production of plastics, composites, and other industrial applications.
    • Moreover, the use of bio-acetic acid In the production of acetic acid derivatives such as ethyl acetate and butyl acetate is gaining popularity In the cosmetics market, as well as in water-based paints, waterproofing coatings, paperboard coatings, and other applications. Motor vehicle manufacturers are also adopting bio-acetic acid In the production of plastic bottles, cigarette filters, and other automotive components. The increasing consumer purchasing power and awareness towards sustainability are driving the demand for bio-based chemicals and renewable chemicals in various industries. Furthermore, the use of bio-acetic acid In the production of Vinyl Acetate Monomer (VAM) for the production of Paints and Coatings, Photographic Films, and other applications is also on the rise.
    • In conclusion, the global bio-acetic acid market is witnessing significant growth due to the increasing demand for sustainable alternatives to petrochemical-based products. The use of bio-acetic acid in various industries such as polymer production, textiles, solvents, paints and coatings, adhesives, emulsions, and other applications is driving the market growth. The certification of bio-acetic acid under ISCC+ standards ensures its sustainability and traceability, making it an attractive option for companies focused on reducing their environmental impact.
    • What challenges does the Bio Acetic Acid Industry face during its growth?

      High production costs is a key challenge affecting the industry growth.

    • The market is experiencing increased demand for sustainable alternatives to petrochemical-based products. Bio-acetic acid, derived from biomass, serves as a renewable feedstock for various applications, including polymer production, textiles, solvents, paints and coatings, adhesives, emulsions, and acetic anhydride. In industries such as motor vehicle manufacturing, consumer purchasing power influences market growth. Bio-based chemicals and renewable chemicals are gaining popularity in sectors like plastics, composites, and engineering, where catalysts are used. Bio-acetic acid derivatives, such as cellulose acetate, are utilized in food and beverages, vinyl acetate monomer (VAM) production, and pharmaceuticals. Water-based paints, waterproofing coatings, and paperboard coatings also employ acetic acid derivatives.
    • However, high production costs pose a significant challenge in transitioning from traditional petrochemical methods to biomass-based production. The purification process, particularly in biorefineries, contributes notably to these costs. For instance, a GAA biorefinery with an annual output of 120,650 tons may incur capital costs ranging from USD186 million to USD245 million, depending on the production scenario. Despite these challenges, the potential benefits of bio-acetic acid, such as reduced carbon footprint and sustainability, continue to drive market growth.
    • Exclusive Customer Landscape

      The bio acetic acid market forecasting report includes the adoption lifecycle of the market, covering from the innovator’s stage to the laggard’s stage. It focuses on adoption rates in different regions based on penetration. Furthermore, the bio acetic acid market report also includes key purchase criteria and drivers of price sensitivity to help companies evaluate and develop their market growth analysis strategies.
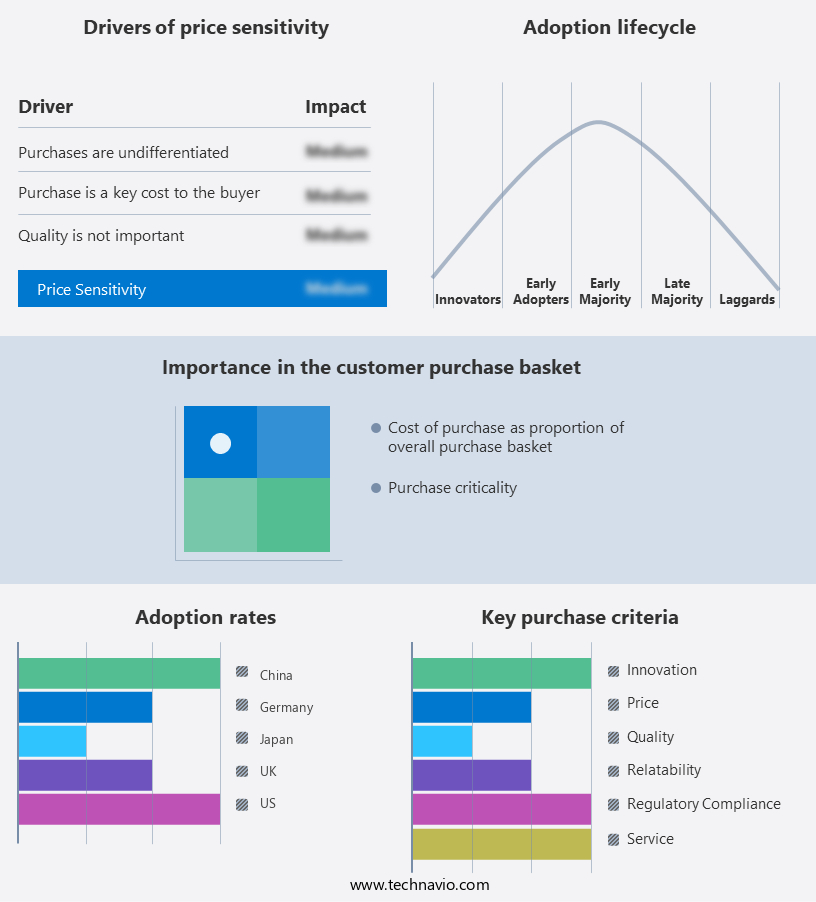
      Bio Acetic Acid Market Share by Geography

       Customer Landscape

      Key Companies & Market Insights

      Companies are implementing various strategies, such as strategic alliances, bio acetic acid market forecast, partnerships, mergers and acquisitions, geographical expansion, and product/service launches, to enhance their presence In the industry.

      Airedale Group - Bio acetic acid is a versatile chemical compound with extensive applications in various industries. Its primary uses include chemical production, where it serves as a crucial intermediate In the manufacture of other chemicals. In the realm of paints, bio acetic acid functions as a key ingredient, contributing to the production of eco-friendly and high-performance coatings. The cleaning industry also leverages this compound for its effectiveness in various applications, from household cleaning products to industrial degreasers. In food production, bio acetic acid acts as a preservative and flavoring agent, while in pharmaceuticals, it is utilized In the synthesis of various drugs. The company specializes in providing bio acetic acid solutions, catering to the diverse requirements of these industries.

      The industry research and growth report includes detailed analyses of the competitive landscape of the market and information about key companies, including:

      • Airedale Group
      • Bio-Corn Products EPZ Ltd.
      • BTG Bioliquids B.V
      • Cargill Inc.
      • Celanese Corp.
      • Chemball HangZhou Chemicals Co. Ltd.
      • Daicel Corp.
      • Eastman Chemical Co.
      • Fisher Scientific GmbH
      • Godavari Biorefineries Ltd.
      • LanzaTech Global Inc.
      • Lenzing AG
      • LyondellBasell Industries N.V.
      • Novozymes AS
      • Sekab
      • Shandong Hualu-Hengsheng Chemical Co. Ltd
      • Sucroal SA
      • Vinipul Inorganics Pvt. Ltd.
      • Wacker Chemie AG

      Qualitative and quantitative analysis of companies has been conducted to help clients understand the wider business environment as well as the strengths and weaknesses of key industry players. Data is qualitatively analyzed to categorize companies as pure play, category-focused, industry-focused, and diversified; it is quantitatively analyzed to categorize companies as dominant, leading, strong, tentative, and weak.

      Research Analyst Overview

      Bio-acetic acid, a renewable alternative to petrochemical-based acetic acid, is gaining significant attention in various industries due to its sustainable production process and versatile applications. This chemical compound is derived from renewable feedstocks, making it an attractive choice for businesses seeking to reduce their carbon footprint and meet sustainability goals. The demand for bio-acetic acid is driven by its use in several industries, including polymer production, textiles, solvents, and adhesives. In the polymer industry, bio-acetic acid is used as an intermediate In the production of polymers such as polyvinyl alcohol (PVOH) and polyacetate. In the textile industry, it is used as a finishing agent to improve the texture and appearance of fabrics.

      Bio-acetic acid also finds applications in various sectors such as paints and coatings, plastics, and composites. In the paints and coatings industry, it is used as an acetic anhydride substitute in water-based paints and waterproofing coatings, as well as in paperboard coatings. In the plastics industry, it is used as a monomer In the production of cellulose acetate and terephthalic acid. The use of bio-acetic acid is not limited to these industries alone. It is also used In the production of acetic acid derivatives such as ethyl acetate and butyl acetate, which are used as solvents in various applications.

      In the engineering industry, it is used as a catalyst In the production of industrial chemicals. The demand for bio-acetic acid is influenced by several factors, including consumer purchasing power and the growth of various end-use industries. In the cosmetics market, the trend towards natural and organic products is driving the demand for bio-acetic acid as a sustainable alternative to petrochemical-based acetic acid. In the construction industry, the increasing focus on sustainable building materials and practices is expected to boost the demand for bio-acetic acid In the production of eco-friendly paints, coatings, and adhesives. The production of bio-acetic acid involves the fermentation of renewable feedstocks such as corn, sugarcane, and wheat, making it a sustainable alternative to petrochemical-based acetic acid.

      The use of renewable feedstocks reduces the carbon footprint of the production process and aligns with the global trend towards sustainability. In conclusion, the bio-acetic acid market is driven by its versatile applications in various industries and its sustainable production process. The demand for bio-acetic acid is expected to grow as businesses seek to reduce their carbon footprint and meet sustainability goals. The use of bio-acetic acid as a renewable alternative to petrochemical-based acetic acid is expected to gain further momentum as more industries adopt sustainable practices.

      Market Scope

      Report Coverage

      Details

      Page number

      202

      Base year

      2023

      Historic period

      2018-2022

      Forecast period

      2024-2028

      Growth momentum & CAGR

      Accelerate at a CAGR of 5.6%

      Market growth 2024-2028

      USD 68.8 million

      Market structure

      Fragmented

      YoY growth 2023-2024(%)

      5.1

      Key countries

      China, US, Germany, Japan, UK, South Korea, India, Canada, France, and Brazil

      Competitive landscape

      Leading Companies, Market Positioning of Companies, Competitive Strategies, and Industry Risks

      Request Free Sample

      What are the Key Data Covered in this Bio Acetic Acid Market Research and Growth Report?

      • CAGR of the Bio Acetic Acid industry during the forecast period
      • Detailed information on factors that will drive the growth and forecasting between 2024 and 2028
      • Precise estimation of the size of the market and its contribution of the industry in focus to the parent market
      • Accurate predictions about upcoming growth and trends and changes in consumer behaviour
      • Growth of the market across APAC, North America, Europe, Middle East and Africa, and South America
      • Thorough analysis of the market’s competitive landscape and detailed information about companies
      • Comprehensive analysis of factors that will challenge the bio acetic acid market growth of industry companies

      We can help! Our analysts can customize this bio acetic acid market research report to meet your requirements.

      Get in touch


      1 Executive Summary

      • 1.1 Market overview
        • Executive Summary - Chart on Market Overview
        • Executive Summary - Data Table on Market Overview
        • Executive Summary - Chart on Global Market Characteristics
        • Executive Summary - Chart on Market by Geography
        • Executive Summary - Chart on Market Segmentation by Source
        • Executive Summary - Chart on Market Segmentation by End-user
        • Executive Summary - Chart on Incremental Growth
        • Executive Summary - Data Table on Incremental Growth
        • Executive Summary - Chart on Company Market Positioning

      2 Technavio Analysis

      • 2.1 Analysis of price sensitivity, lifecycle, customer purchase basket, adoption rates, and purchase criteria
        • Analysis of price sensitivity, lifecycle, customer purchase basket, adoption rates, and purchase criteria
      • 2.2 Criticality of inputs and Factors of differentiation
        • Overview on criticality of inputs and factors of differentiation
      • 2.3 Factors of disruption
        • Overview on factors of disruption
      • 2.4 Impact of drivers and challenges
        • Impact of drivers and challenges in 2023 and 2028

      3 Market Landscape

      • 3.1 Market ecosystem
        • Parent Market
        • Data Table on - Parent Market
      • 3.2 Market characteristics
        • Market characteristics analysis
      • 3.3 Value chain analysis
        • Value Chain Analysis

      4 Market Sizing

      • 4.1 Market definition
        • Offerings of companies included in the market definition
      • 4.2 Market segment analysis
        • Market segments
      • 4.3 Market size 2023
        • 4.4 Market outlook: Forecast for 2023-2028
          • Chart on Global - Market size and forecast 2023-2028 ($ million)
          • Data Table on Global - Market size and forecast 2023-2028 ($ million)
          • Chart on Global Market: Year-over-year growth 2023-2028 (%)
          • Data Table on Global Market: Year-over-year growth 2023-2028 (%)

        5 Historic Market Size

        • 5.1 Global Bio Acetic Acid Market 2018 - 2022
          • Historic Market Size - Data Table on Global Bio Acetic Acid Market 2018 - 2022 ($ million)
        • 5.2 Source segment analysis 2018 - 2022
          • Historic Market Size - Source Segment 2018 - 2022 ($ million)
        • 5.3 End-user segment analysis 2018 - 2022
          • Historic Market Size - End-user Segment 2018 - 2022 ($ million)
        • 5.4 Geography segment analysis 2018 - 2022
          • Historic Market Size - Geography Segment 2018 - 2022 ($ million)
        • 5.5 Country segment analysis 2018 - 2022
          • Historic Market Size - Country Segment 2018 - 2022 ($ million)

        6 Qualitative Analysis

        • 6.1 Impact of AI on Global Bio Acetic Acid Market

          7 Five Forces Analysis

          • 7.1 Five forces summary
            • Five forces analysis - Comparison between 2023 and 2028
          • 7.2 Bargaining power of buyers
            • Bargaining power of buyers - Impact of key factors 2023 and 2028
          • 7.3 Bargaining power of suppliers
            • Bargaining power of suppliers - Impact of key factors in 2023 and 2028
          • 7.4 Threat of new entrants
            • Threat of new entrants - Impact of key factors in 2023 and 2028
          • 7.5 Threat of substitutes
            • Threat of substitutes - Impact of key factors in 2023 and 2028
          • 7.6 Threat of rivalry
            • Threat of rivalry - Impact of key factors in 2023 and 2028
          • 7.7 Market condition
            • Chart on Market condition - Five forces 2023 and 2028

          8 Market Segmentation by Source

          • 8.1 Market segments
            • Chart on Source - Market share 2023-2028 (%)
            • Data Table on Source - Market share 2023-2028 (%)
          • 8.2 Comparison by Source
            • Chart on Comparison by Source
            • Data Table on Comparison by Source
          • 8.3 Fermentation - Market size and forecast 2023-2028
            • Chart on Fermentation - Market size and forecast 2023-2028 ($ million)
            • Data Table on Fermentation - Market size and forecast 2023-2028 ($ million)
            • Chart on Fermentation - Year-over-year growth 2023-2028 (%)
            • Data Table on Fermentation - Year-over-year growth 2023-2028 (%)
          • 8.4 Biomass - Market size and forecast 2023-2028
            • Chart on Biomass - Market size and forecast 2023-2028 ($ million)
            • Data Table on Biomass - Market size and forecast 2023-2028 ($ million)
            • Chart on Biomass - Year-over-year growth 2023-2028 (%)
            • Data Table on Biomass - Year-over-year growth 2023-2028 (%)
          • 8.5 Market opportunity by Source
            • Market opportunity by Source ($ million)
            • Data Table on Market opportunity by Source ($ million)

          9 Market Segmentation by End-user

          • 9.1 Market segments
            • Chart on End-user - Market share 2023-2028 (%)
            • Data Table on End-user - Market share 2023-2028 (%)
          • 9.2 Comparison by End-user
            • Chart on Comparison by End-user
            • Data Table on Comparison by End-user
          • 9.3 Chemical manufacturing - Market size and forecast 2023-2028
            • Chart on Chemical manufacturing - Market size and forecast 2023-2028 ($ million)
            • Data Table on Chemical manufacturing - Market size and forecast 2023-2028 ($ million)
            • Chart on Chemical manufacturing - Year-over-year growth 2023-2028 (%)
            • Data Table on Chemical manufacturing - Year-over-year growth 2023-2028 (%)
          • 9.4 Food industry - Market size and forecast 2023-2028
            • Chart on Food industry - Market size and forecast 2023-2028 ($ million)
            • Data Table on Food industry - Market size and forecast 2023-2028 ($ million)
            • Chart on Food industry - Year-over-year growth 2023-2028 (%)
            • Data Table on Food industry - Year-over-year growth 2023-2028 (%)
          • 9.5 Personal care - Market size and forecast 2023-2028
            • Chart on Personal care - Market size and forecast 2023-2028 ($ million)
            • Data Table on Personal care - Market size and forecast 2023-2028 ($ million)
            • Chart on Personal care - Year-over-year growth 2023-2028 (%)
            • Data Table on Personal care - Year-over-year growth 2023-2028 (%)
          • 9.6 Market opportunity by End-user
            • Market opportunity by End-user ($ million)
            • Data Table on Market opportunity by End-user ($ million)

          10 Customer Landscape

          • 10.1 Customer landscape overview
            • Analysis of price sensitivity, lifecycle, customer purchase basket, adoption rates, and purchase criteria

          11 Geographic Landscape

          • 11.1 Geographic segmentation
            • Chart on Market share by geography 2023-2028 (%)
            • Data Table on Market share by geography 2023-2028 (%)
          • 11.2 Geographic comparison
            • Chart on Geographic comparison
            • Data Table on Geographic comparison
          • 11.3 APAC - Market size and forecast 2023-2028
            • Chart on APAC - Market size and forecast 2023-2028 ($ million)
            • Data Table on APAC - Market size and forecast 2023-2028 ($ million)
            • Chart on APAC - Year-over-year growth 2023-2028 (%)
            • Data Table on APAC - Year-over-year growth 2023-2028 (%)
          • 11.4 North America - Market size and forecast 2023-2028
            • Chart on North America - Market size and forecast 2023-2028 ($ million)
            • Data Table on North America - Market size and forecast 2023-2028 ($ million)
            • Chart on North America - Year-over-year growth 2023-2028 (%)
            • Data Table on North America - Year-over-year growth 2023-2028 (%)
          • 11.5 Europe - Market size and forecast 2023-2028
            • Chart on Europe - Market size and forecast 2023-2028 ($ million)
            • Data Table on Europe - Market size and forecast 2023-2028 ($ million)
            • Chart on Europe - Year-over-year growth 2023-2028 (%)
            • Data Table on Europe - Year-over-year growth 2023-2028 (%)
          • 11.6 Middle East and Africa - Market size and forecast 2023-2028
            • Chart on Middle East and Africa - Market size and forecast 2023-2028 ($ million)
            • Data Table on Middle East and Africa - Market size and forecast 2023-2028 ($ million)
            • Chart on Middle East and Africa - Year-over-year growth 2023-2028 (%)
            • Data Table on Middle East and Africa - Year-over-year growth 2023-2028 (%)
          • 11.7 South America - Market size and forecast 2023-2028
            • Chart on South America - Market size and forecast 2023-2028 ($ million)
            • Data Table on South America - Market size and forecast 2023-2028 ($ million)
            • Chart on South America - Year-over-year growth 2023-2028 (%)
            • Data Table on South America - Year-over-year growth 2023-2028 (%)
          • 11.8 China - Market size and forecast 2023-2028
            • Chart on China - Market size and forecast 2023-2028 ($ million)
            • Data Table on China - Market size and forecast 2023-2028 ($ million)
            • Chart on China - Year-over-year growth 2023-2028 (%)
            • Data Table on China - Year-over-year growth 2023-2028 (%)
          • 11.9 US - Market size and forecast 2023-2028
            • Chart on US - Market size and forecast 2023-2028 ($ million)
            • Data Table on US - Market size and forecast 2023-2028 ($ million)
            • Chart on US - Year-over-year growth 2023-2028 (%)
            • Data Table on US - Year-over-year growth 2023-2028 (%)
          • 11.10 Germany - Market size and forecast 2023-2028
            • Chart on Germany - Market size and forecast 2023-2028 ($ million)
            • Data Table on Germany - Market size and forecast 2023-2028 ($ million)
            • Chart on Germany - Year-over-year growth 2023-2028 (%)
            • Data Table on Germany - Year-over-year growth 2023-2028 (%)
          • 11.11 Japan - Market size and forecast 2023-2028
            • Chart on Japan - Market size and forecast 2023-2028 ($ million)
            • Data Table on Japan - Market size and forecast 2023-2028 ($ million)
            • Chart on Japan - Year-over-year growth 2023-2028 (%)
            • Data Table on Japan - Year-over-year growth 2023-2028 (%)
          • 11.12 UK - Market size and forecast 2023-2028
            • Chart on UK - Market size and forecast 2023-2028 ($ million)
            • Data Table on UK - Market size and forecast 2023-2028 ($ million)
            • Chart on UK - Year-over-year growth 2023-2028 (%)
            • Data Table on UK - Year-over-year growth 2023-2028 (%)
          • 11.13 South Korea - Market size and forecast 2023-2028
            • Chart on South Korea - Market size and forecast 2023-2028 ($ million)
            • Data Table on South Korea - Market size and forecast 2023-2028 ($ million)
            • Chart on South Korea - Year-over-year growth 2023-2028 (%)
            • Data Table on South Korea - Year-over-year growth 2023-2028 (%)
          • 11.14 India - Market size and forecast 2023-2028
            • Chart on India - Market size and forecast 2023-2028 ($ million)
            • Data Table on India - Market size and forecast 2023-2028 ($ million)
            • Chart on India - Year-over-year growth 2023-2028 (%)
            • Data Table on India - Year-over-year growth 2023-2028 (%)
          • 11.15 Canada - Market size and forecast 2023-2028
            • Chart on Canada - Market size and forecast 2023-2028 ($ million)
            • Data Table on Canada - Market size and forecast 2023-2028 ($ million)
            • Chart on Canada - Year-over-year growth 2023-2028 (%)
            • Data Table on Canada - Year-over-year growth 2023-2028 (%)
          • 11.16 France - Market size and forecast 2023-2028
            • Chart on France - Market size and forecast 2023-2028 ($ million)
            • Data Table on France - Market size and forecast 2023-2028 ($ million)
            • Chart on France - Year-over-year growth 2023-2028 (%)
            • Data Table on France - Year-over-year growth 2023-2028 (%)
          • 11.17 Brazil - Market size and forecast 2023-2028
            • Chart on Brazil - Market size and forecast 2023-2028 ($ million)
            • Data Table on Brazil - Market size and forecast 2023-2028 ($ million)
            • Chart on Brazil - Year-over-year growth 2023-2028 (%)
            • Data Table on Brazil - Year-over-year growth 2023-2028 (%)
          • 11.18 Market opportunity by geography
            • Market opportunity by geography ($ million)
            • Data Tables on Market opportunity by geography ($ million)

          12 Drivers, Challenges, and Opportunity/Restraints

          • 12.1 Market drivers
            • 12.2 Market challenges
              • 12.3 Impact of drivers and challenges
                • Impact of drivers and challenges in 2023 and 2028
              • 12.4 Market opportunities/restraints

                13 Competitive Landscape

                • 13.1 Overview
                  • 13.2 Competitive Landscape
                    • Overview on criticality of inputs and factors of differentiation
                  • 13.3 Landscape disruption
                    • Overview on factors of disruption
                  • 13.4 Industry risks
                    • Impact of key risks on business

                  14 Competitive Analysis

                  • 14.1 Companies profiled
                    • Companies covered
                  • 14.2 Company ranking index
                    • Company ranking index
                  • 14.3 Market positioning of companies
                    • Matrix on companies position and classification
                  • 14.4 Airedale Group
                    • Airedale Group - Overview
                    • Airedale Group - Product / Service
                    • Airedale Group - Key offerings
                    • SWOT
                  • 14.5 Bio-Corn Products EPZ Ltd.
                    • Bio-Corn Products EPZ Ltd. - Overview
                    • Bio-Corn Products EPZ Ltd. - Product / Service
                    • Bio-Corn Products EPZ Ltd. - Key offerings
                    • SWOT
                  • 14.6 BTG Bioliquids B.V
                    • BTG Bioliquids B.V - Overview
                    • BTG Bioliquids B.V - Product / Service
                    • BTG Bioliquids B.V - Key offerings
                    • SWOT
                  • 14.7 Cargill Inc.
                    • Cargill Inc. - Overview
                    • Cargill Inc. - Product / Service
                    • Cargill Inc. - Key offerings
                    • SWOT
                  • 14.8 Celanese Corp.
                    • Celanese Corp. - Overview
                    • Celanese Corp. - Business segments
                    • Celanese Corp. - Key news
                    • Celanese Corp. - Key offerings
                    • Celanese Corp. - Segment focus
                    • SWOT
                  • 14.9 Chemball HangZhou Chemicals Co. Ltd.
                    • Chemball HangZhou Chemicals Co. Ltd. - Overview
                    • Chemball HangZhou Chemicals Co. Ltd. - Product / Service
                    • Chemball HangZhou Chemicals Co. Ltd. - Key offerings
                    • SWOT
                  • 14.10 Daicel Corp.
                    • Daicel Corp. - Overview
                    • Daicel Corp. - Business segments
                    • Daicel Corp. - Key news
                    • Daicel Corp. - Key offerings
                    • Daicel Corp. - Segment focus
                    • SWOT
                  • 14.11 Eastman Chemical Co.
                    • Eastman Chemical Co. - Overview
                    • Eastman Chemical Co. - Business segments
                    • Eastman Chemical Co. - Key news
                    • Eastman Chemical Co. - Key offerings
                    • Eastman Chemical Co. - Segment focus
                    • SWOT
                  • 14.12 Fisher Scientific GmbH
                    • Fisher Scientific GmbH - Overview
                    • Fisher Scientific GmbH - Product / Service
                    • Fisher Scientific GmbH - Key offerings
                    • SWOT
                  • 14.13 Godavari Biorefineries Ltd.
                    • Godavari Biorefineries Ltd. - Overview
                    • Godavari Biorefineries Ltd. - Business segments
                    • Godavari Biorefineries Ltd. - Key offerings
                    • Godavari Biorefineries Ltd. - Segment focus
                    • SWOT
                  • 14.14 LanzaTech Global Inc.
                    • LanzaTech Global Inc. - Overview
                    • LanzaTech Global Inc. - Product / Service
                    • LanzaTech Global Inc. - Key news
                    • LanzaTech Global Inc. - Key offerings
                    • SWOT
                  • 14.15 Lenzing AG
                    • Lenzing AG - Overview
                    • Lenzing AG - Business segments
                    • Lenzing AG - Key offerings
                    • Lenzing AG - Segment focus
                    • SWOT
                  • 14.16 LyondellBasell Industries N.V.
                    • LyondellBasell Industries N.V. - Overview
                    • LyondellBasell Industries N.V. - Business segments
                    • LyondellBasell Industries N.V. - Key news
                    • LyondellBasell Industries N.V. - Key offerings
                    • LyondellBasell Industries N.V. - Segment focus
                    • SWOT
                  • 14.17 Novozymes AS
                    • Novozymes AS - Overview
                    • Novozymes AS - Product / Service
                    • Novozymes AS - Key offerings
                    • SWOT
                  • 14.18 Sucroal SA
                    • Sucroal SA - Overview
                    • Sucroal SA - Product / Service
                    • Sucroal SA - Key offerings
                    • SWOT

                  15 Appendix

                  • 15.1 Scope of the report
                    • 15.2 Inclusions and exclusions checklist
                      • Inclusions checklist
                      • Exclusions checklist
                    • 15.3 Currency conversion rates for US$
                      • Currency conversion rates for US$
                    • 15.4 Research methodology
                      • Research methodology
                    • 15.5 Data procurement
                      • Information sources
                    • 15.6 Data validation
                      • Data validation
                    • 15.7 Validation techniques employed for market sizing
                      • Validation techniques employed for market sizing
                    • 15.8 Data synthesis
                      • Data synthesis
                    • 15.9 360 degree market analysis
                      • 360 degree market analysis
                    • 15.10 List of abbreviations
                      • List of abbreviations

                    Research Methodology

                    Technavio presents a detailed picture of the market by way of study, synthesis, and summation of data from multiple sources. The analysts have presented the various facets of the market with a particular focus on identifying the key industry influencers. The data thus presented is comprehensive, reliable, and the result of extensive research, both primary and secondary.

                    INFORMATION SOURCES

                    Primary sources

                    • Manufacturers and suppliers
                    • Channel partners
                    • Industry experts
                    • Strategic decision makers

                    Secondary sources

                    • Industry journals and periodicals
                    • Government data
                    • Financial reports of key industry players
                    • Historical data
                    • Press releases

                    DATA ANALYSIS

                    Data Synthesis

                    • Collation of data
                    • Estimation of key figures
                    • Analysis of derived insights

                    Data Validation

                    • Triangulation with data models
                    • Reference against proprietary databases
                    • Corroboration with industry experts

                    REPORT WRITING

                    Qualitative

                    • Market drivers
                    • Market challenges
                    • Market trends
                    • Five forces analysis

                    Quantitative

                    • Market size and forecast
                    • Market segmentation
                    • Geographical insights
                    • Competitive landscape

                    Interested in this report?

                    Get your sample now to see our research methodology and insights!

                    Download Now

                    Frequently Asked Questions

                    Bio Acetic Acid market growth will increase by $ 68.8 mn during 2024-2028.

                    The Bio Acetic Acid market is expected to grow at a CAGR of 5.6% during 2024-2028.

                    Bio Acetic Acid market is segmented by Source( Fermentation, Biomass) End-user( Chemical manufacturing, Food industry, Personal care)

                    Airedale Group, Bio-Corn Products EPZ Ltd., BTG Bioliquids B.V, Cargill Inc., Celanese Corp., Chemball HangZhou Chemicals Co. Ltd., Daicel Corp., Eastman Chemical Co., Fisher Scientific GmbH, Godavari Biorefineries Ltd., LanzaTech Global Inc., Lenzing AG, LyondellBasell Industries N.V., Novozymes AS, Sekab, Shandong Hualu-Hengsheng Chemical Co. Ltd, Sucroal SA, Vinipul Inorganics Pvt. Ltd., Wacker Chemie AG are a few of the key vendors in the Bio Acetic Acid market.

                    APAC will register the highest growth rate of 42% among the other regions. Therefore, the Bio Acetic Acid market in APAC is expected to garner significant business opportunities for the vendors during the forecast period.

                    China, US, Germany, Japan, UK, South Korea, India, Canada, France, Brazil

                    • Growing crude oil pricesThe bio acetic acid market is significantly influenced by rising crude oil prices is the driving factor this market.
                    • which act as a critical driver for market growth. As crude oil prices increase is the driving factor this market.
                    • the cost of petroleum-based chemicals also escalates is the driving factor this market.
                    • leading manufacturers to seek more sustainable and cost-effective alternatives. This shift is particularly important as volatile oil markets is the driving factor this market.
                    • driven by geopolitical tensions and fluctuating demand is the driving factor this market.
                    • create an unstable pricing environment for conventional petrochemicals. For instance is the driving factor this market.
                    • in September 2024 is the driving factor this market.
                    • concerns over potential disruptions in U.S. oil output due to natural disasters prompted spikes in crude prices is the driving factor this market.
                    • with Brent crude trading at around $79 per barrel after a period of volatility.As crude oil prices trend upwards is the driving factor this market.
                    • industries reliant on petroleum-derived acetic acid face higher operational costs. Consequently is the driving factor this market.
                    • manufacturers are increasingly exploring bio-based acetic acid is the driving factor this market.
                    • derived from renewable resources is the driving factor this market.
                    • as a substitute. Bio acetic acid not only mitigates the risks associated with fluctuating crude oil prices but also aligns with global sustainability initiatives is the driving factor this market.
                    • as it offers a lower carbon footprint compared to its petrochemical counterparts.Moreover is the driving factor this market.
                    • as governments and industries worldwide push for greener alternatives is the driving factor this market.
                    • the adoption of bio acetic acid is likely to gain momentum. The escalating demand for eco-friendly products enhances the market potential for bio acetic acid is the driving factor this market.
                    • encouraging further investment in its production technologies. In light of these trends is the driving factor this market.
                    • the global bio acetic acid market is poised for robust growth as businesses pivot towards sustainable solutions in response to rising crude oil prices and environmental concerns. This transition presents a compelling opportunity for stakeholders to capitalize on the growing demand for bio-based chemicals in various applications is the driving factor this market.
                    • including food is the driving factor this market.
                    • cosmetics is the driving factor this market.
                    • and industrial products. is the driving factor this market.

                    The Bio Acetic Acid market vendors should focus on grabbing business opportunities from the Fermentation segment as it accounted for the largest market share in the base year.
                    RIA - Research AI Assistant
                    Ask RIA