Bulk Acoustic Wave Sensors Market Analysis North America, APAC, Europe, Middle East and Africa, South America - US, China, UK, Japan, Germany - Size and Forecast 2024-2028

Bulk Acoustic Wave Sensors Market Analysis North America, APAC, Europe, Middle East and Africa, South America - US, China, UK, Japan, Germany - Size and Forecast 2024-2028

Published: Jul 2024 142 Pages SKU: IRTNTR72948

Market Overview at a Glance

$133.6 Mn
Market Opportunity
10.04%
CAGR
8.86
YoY growth 2023-2024(%)

Bulk Acoustic Wave Sensors Market Size 2024-2028

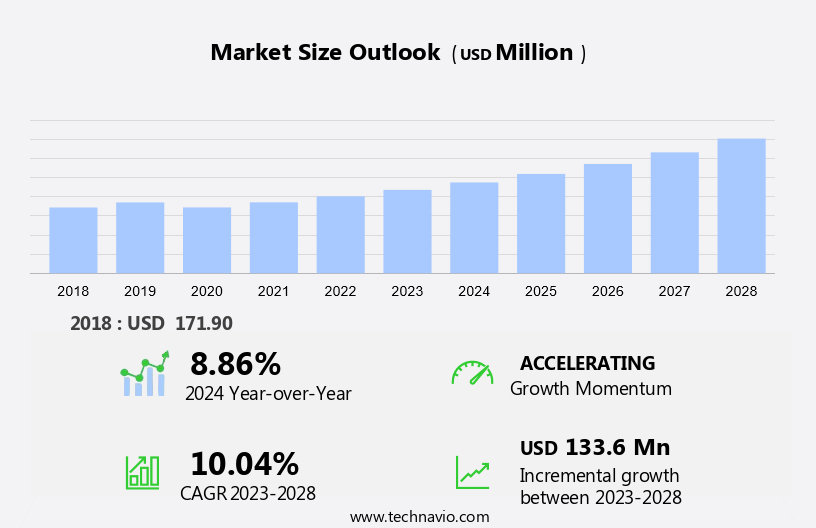
The bulk acoustic wave sensors market size is forecast to increase by USD 133.6 million at a CAGR of 10.04% between 2023 and 2028.

  • The market is experiencing significant growth due to several key trends. The widespread use of smartphones and tablets is driving the demand for BAW sensors in the consumer electronics industry. Additionally, the introduction of automation in automobiles is leading to an increased adoption of BAW sensors for automotive applications. Furthermore, the cyclical nature of the semiconductor industry presents both opportunities and challenges for the market. The healthcare sector benefits from BAW sensors' ability to measure vital signs, enabling the development of advanced medical devices.  On the one hand, the semiconductor industry's cyclical nature can lead to fluctuations in demand, but on the other hand, it also drives innovation and technological advancements in BAW sensors. These trends are expected to continue shaping the growth of the BAW sensors market in the coming years.

What will be the Size of the Bulk Acoustic Wave Sensors Market During the Forecast Period?

Bulk Acoustic Wave Sensors Market Size

 Request Free Sample

  • The market encompasses a range of technologies utilizing piezoelectric substances, such as aluminum nitride, zinc oxide, lead zirconium titanate, lithium niobate, lithium tantalate, silicon carbide, gallium arsenide, langasite, polyvinylidene fluoride, and others, to generate mechanical waves for sensing applications. BAW sensors operate on the principle of resonating a piezoelectric material to detect changes in sensing parameters, including temperature, pressure, chemical, and humidity. These sensors find extensive applications in various industries, including telecommunications, consumer electronics, healthcare, aerospace, and defense.
  • BAW devices, including Lamb wave sensors and standing acoustic wave sensors, offer advantages such as high sensitivity, fast response time, and compatibility with miniaturization, making them increasingly popular in these sectors. The market is driven by the growing demand for advanced sensing solutions in these industries and the ongoing research and development efforts to improve the performance and functionality of BAW sensors.

How is the Bulk Acoustic Wave Sensors Industry segmented and which is the largest segment?

The industry research report provides comprehensive data (region-wise segment analysis), with forecasts and estimates in "USD million" for the period 2024-2028, as well as historical data from 2018-2022 for the following segments.

  • End-user
    • Telecom
    • Automotive
    • Consumer electronics
    • Others
  • Geography
    • North America
      • US
    • APAC
      • China
      • Japan
    • Europe
      • Germany
      • UK
    • Middle East and Africa
    • South America

By End-user Insights

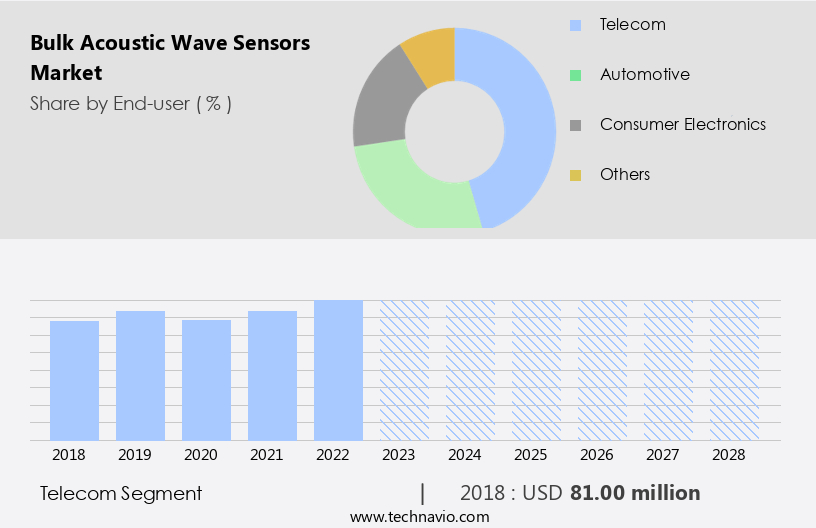
The telecom segment is estimated to witness significant growth during the forecast period. The Bulk Acoustic Wave (BAW) sensors market witnesses significant growth in the telecommunications sector due to the increasing demand for BAW devices as filters in RF front-end applications. These sensors, which function as mechanical wave resonators, are integral to telecom infrastructure, enhancing signal quality and boosting reception in mobile phones and base stations. BAW sensors' small size, high reproducibility, and superior performance make them indispensable in 5G technology and the Internet of Things (IoT). Applications in 5G NR frequency bands, RF front-end filtering, and 5G technology are driving market revenue. Key materials for BAW sensors include Lamb Wave, Aluminum Nitride, Zinc Oxide, Lead Zirconium Titanate, Silicon Carbide, Gallium Arsenide, Langasite, Polyvinylidene Fluoride, Lithium Niobate, Lithium Tantalate.

Market potential is high, with investments in research and development, production sites, and facilities increasing production capacities. BAW sensors' strengths lie in their RF features, making them suitable for use in LTE networks, consumer electronics such as smart gadgets, tablets, and smartphones, and consumer wireless. Market growth is influenced by the increasing number of mobile subscriptions and automobile applications.

Bulk Acoustic Wave Sensors Market Size

Get a glance at the market report of share of various segments Request Free Sample

The Telecom segment was valued at USD 81.00 million in 2018 and showed a gradual increase during the forecast period.

Regional Analysis

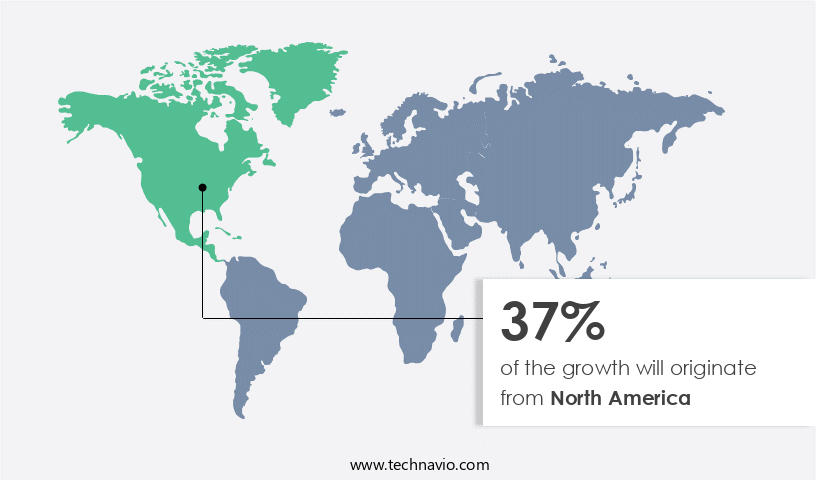
North America is estimated to contribute 37% to the growth of the global market during the forecast period. Technavio's analysts have elaborately explained the regional trends and drivers that shape the market during the forecast period. The market in North America is significantly driven by the US, accounting for a substantial revenue share. Factors such as the preference for plug-and-play devices and the increasing use of mobile hotspot routers instead of dongles are fueling market growth.

Bulk Acoustic Wave Sensors Market Share by Geography

For more insights on the market size of various regions, Request Free Sample

Additionally, the demand for advanced mobile devices, with a short replacement cycle for smartphones and tablets, is contributing to market expansion. The competitive landscape in the US mobile device market is intensifying price wars among manufacturers, further boosting the demand for BAW sensors. These sensors are essential components in various applications, including telecommunications, consumer electronics, healthcare, aerospace, and defense.

Key materials used in BAW devices include Lamb Wave, Aluminum Nitride, Zinc Oxide, Lead Zirconium Titanate, SiO2, Lithium Niobate, Lithium Tantalate, Silicon Carbide, Gallium Arsenide, Langasite, Polyvinylidene Fluoride, and other piezoelectric substances. These materials are used to create resonators, which are integral to the functioning of BAW sensors. The market for BAW sensors is also influenced by sensing parameters such as temperature, pressure, chemical, and humidity. Furthermore, the integration of BAW sensors in 5G technology, Internet of Things (IoT), 5G NR frequency, RF front-end filtering, and RF features in LTE networks and smart gadgets, including consumer wireless, automobiles, and mobile subscriptions, is driving market potential.

Market Dynamics

Our researchers analyzed the data with 2023 as the base year, along with the key drivers, trends, and challenges. A holistic analysis of drivers will help companies refine their marketing strategies to gain a competitive advantage.

What are the key market drivers leading to the rise in the adoption of Bulk Acoustic Wave Sensors Industry?

  • The proliferation of smartphones and tablets is the key driver of the market. The Bulk Acoustic Wave (BAW) sensors market has experienced significant growth due to the increasing demand for advanced wireless technology in various industries. BAW sensors, which utilize piezoelectric materials such as Aluminum Nitride, Zinc Oxide, Lead Zirconium Titanate, SiO2, Lithium Niobate, Lithium Tantalate, Silicon Carbide, and Gallium Arsenide, function by generating Lamb Waves, a type of mechanical wave, in a piezoelectric substance. These sensors operate on the principle of a standing acoustic wave and have gained popularity due to their RF front-end filtering capabilities. BAW sensors have found extensive applications in telecommunications, consumer electronics, healthcare, aerospace, and defense. In telecommunications, they are used in RF front-end filtering for 5G technology and the Internet of Things (IoT), particularly in the 5G NR frequency range.
  • In consumer electronics, BAW sensors are integrated into smart gadgets like tablets and smartphones to support higher bandwidth frequencies and improve miniaturization. The automobile industry also utilizes these sensors for temperature, pressure, chemical, and humidity sensing. The increasing number of mobile subscriptions and the proliferation of 4G/LTE networks have fueled the demand for BAW sensors. High-end smartphones require BAW sensors to support frequencies above 1.6 GHz for various applications. The production of BAW devices involves setting up production sites and facilities with significant production capacities. Key strengths of BAW sensors include low insertion losses, high isolation, and triple beat in CDMA systems. However, their high production costs and limited frequency tunability remain weaknesses. BAW sensors' potential applications extend beyond the aforementioned industries. Their RF features make them suitable for use in RF filters, resonators, and sensors for various applications. The investment in research and development in this field is expected to yield significant revenue in the coming years.

What are the market trends shaping the Bulk Acoustic Wave Sensors Industry?

  • Introduction of automation in automobiles is the upcoming market trend. The market is experiencing significant growth due to the increasing demand for advanced sensing technologies in various industries. BAW sensors utilize piezoelectric substances, such as Aluminum Nitride, Zinc Oxide, Lead Zirconium Titanate, SiO2, Lithium Niobate, Lithium Tantalate, Silicon Carbide, and Gallium Arsenide, as resonators to generate Lamb Waves, a type of mechanical wave. These sensors operate based on the standing acoustic wave principle, making them suitable for sensing parameters like temperature, pressure, chemical, humidity, and more. BAW sensors find extensive applications in telecommunications, consumer electronics, healthcare, aerospace, and defense. In telecommunications, they are used for RF front-end filtering in 5G technology and the Internet of Things (IoT).
  • In consumer electronics, they are integrated into smart gadgets like tablets and smartphones for consumer wireless applications. In the automobile industry, they are used for various functions, including car navigation and display, infotainment, collision detection technology, GPS, and the automated driving system. The production of BAW sensors involves setting up production sites and facilities with adequate production capacities. Key strengths of BAW sensors include their small size, high sensitivity, and wide frequency range. However, weaknesses include their limited temperature range and high production costs. The RF features of BAW sensors make them ideal for use in LTE networks and 5G NR frequency bands.

What challenges does the Bulk Acoustic Wave Sensors Industry face during its growth?

The cyclical nature of the semiconductor industry is a key challenge affecting the industry growth.

  • The market is driven by the increasing demand for Lamb Wave sensors, which are used in various applications such as Temperature, Pressure, Chemical, Humidity sensing, and Telecommunications. Key piezoelectric materials used in BAW devices include Aluminum Nitride, Zinc Oxide, Lead Zirconium Titanate, SiO2, Lithium Niobate, Lithium Tantalate, Silicon Carbide, and Gallium Arsenide. BAW sensors are essential components in RF front-end filtering for 5G technology and the Internet of Things (IoT), particularly in the 5G NR frequency range. BAW sensors have gained significant attention due to their potential in various industries, including Consumer Electronics, Healthcare, Aerospace, and Defense.
  • The production of BAW devices relies on the strengths and weaknesses of different piezoelectric materials, which impact the revenue generated by companies. The RF features of BAW sensors make them suitable for use in LTE networks and various smart gadgets, such as tablets, smartphones, and consumer wireless devices. The semiconductor industry's demand pattern is characterized by fluctuations due to end-user requirements, technological transitions, production volumes, inventory levels, and buying patterns. OEMs and ODMs, who are significant customers for BAW sensors, depend on the sales of mass-market electronic devices. These devices exhibit seasonal cycles, leading to inventory fluctuations or shortages.

Exclusive Customer Landscape

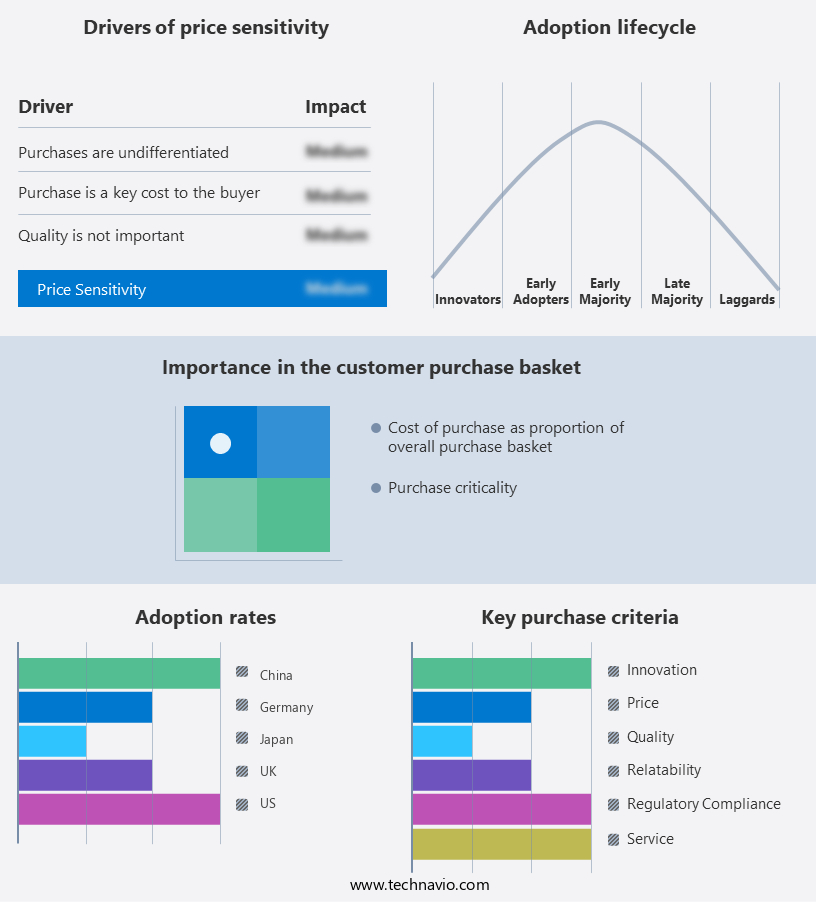
The market forecasting report includes the adoption lifecycle of the market, covering from the innovator's stage to the laggard's stage. It focuses on adoption rates in different regions based on penetration. Furthermore, the market report also includes key purchase criteria and drivers of price sensitivity to help companies evaluate and develop their market growth analysis strategies.

Bulk Acoustic Wave Sensors Market Share by Geography

 Customer Landscape

Key Companies & Market Insights

Companies are implementing various strategies, such as strategic alliances, market forecast, partnerships, mergers and acquisitions, geographical expansion, and product/service launches, to enhance their presence in the industry.

The industry research and growth report includes detailed analyses of the competitive landscape of the market and information about key companies, including:

  • Akoustis Technologies Inc.
  • API Microelectronics Ltd.
  • Broadcom Inc.
  • Microchip Technology Inc.
  • Murata Manufacturing Co. Ltd.
  • Qorvo Inc.
  • Qualcomm Inc.
  • TAIYO YUDEN Co. Ltd.
  • TDK Corp.
  • Teledyne Technologies Inc.

Qualitative and quantitative analysis of companies has been conducted to help clients understand the wider business environment as well as the strengths and weaknesses of key industry players. Data is qualitatively analyzed to categorize companies as pure play, category-focused, industry-focused, and diversified; it is quantitatively analyzed to categorize companies as dominant, leading, strong, tentative, and weak.

Research Analyst Overview

Bulk Acoustic Wave (BAW) sensors have gained significant attention in the technological landscape due to their unique properties and wide-ranging applications. These sensors operate based on the principle of mechanical waves propagating through a piezoelectric material, making them an essential component in various industries. BAW sensors are renowned for their high sensitivity, making them suitable for measuring various sensing parameters such as temperature, pressure, chemical, and humidity. The versatility of these sensors is evident in their application across multiple sectors, including telecommunications, consumer electronics, healthcare, aerospace, and defense. BAW devices are manufactured using piezoelectric substances like aluminum nitride, zinc oxide, lead zirconium titanate, SIO2, lithium niobate, lithium tantalate, silicon carbide, gallium arsenide, langasite, polyvinylidene fluoride, and others.

Moreover, these materials offer distinct advantages, such as high sensitivity, low power consumption, and strength, making them ideal for specific applications. BAW sensors are integral to various applications in the telecommunications sector, where they are used for RF front-end filtering in 5G technology and the Internet of Things (IoT). In the consumer electronics industry, these sensors are found in smart gadgets like tablets and smartphones, enhancing their functionality and user experience. In the aerospace and defense industries, these sensors are crucial for monitoring critical systems and ensuring safety and reliability.

Furthermore, the production of BAW devices involves setting up production sites and facilities, with significant investments in research and development and production capacities. The strengths of BAW sensors include their high sensitivity, broadband response, and compatibility with various frequencies, including LTE networks and 5G NR frequencies. However, challenges such as manufacturing complexities and high production costs limit the widespread adoption of BAW sensors. Despite these challenges, the potential for growth in the BAW sensor market is significant, driven by the increasing demand for advanced sensing technologies and the expansion of various industries, such as telecommunications and consumer electronics. BAW sensors' RF features, such as high selectivity, high Q factor, and wide bandwidth, make them an attractive option for various applications.

Market Scope

Report Coverage

Details

Page number

142

Base year

2023

Historic period

2018-2022

Forecast period

2024-2028

Growth momentum & CAGR

Accelerate at a CAGR of 10.04%

Market growth 2024-2028

USD 133.6 million

Market structure

Fragmented

YoY growth 2023-2024(%)

8.86

Key countries

US, China, UK, Japan, and Germany

Competitive landscape

Leading Companies, Market Positioning of Companies, Competitive Strategies, and Industry Risks

Request Free Sample

What are the Key Data Covered in this Bulk Acoustic Wave Sensors Market Research and Growth Report?

  • CAGR of the Bulk Acoustic Wave Sensors industry during the forecast period
  • Detailed information on factors that will drive the market growth and forecasting between 2024 and 2028
  • Precise estimation of the size of the market and its contribution of the industry in focus to the parent market
  • Accurate predictions about upcoming growth and trends and changes in consumer behaviour
  • Growth of the market across North America, APAC, Europe, Middle East and Africa, and South America
  • Thorough analysis of the market's competitive landscape and detailed information about companies
  • Comprehensive analysis of factors that will challenge the bulk acoustic wave sensors market growth of industry companies

We can help! Our analysts can customize this bulk acoustic wave sensors market research report to meet your requirements.

Get in touch

1 Executive Summary

  • 1.1 Market overview
    • Executive Summary - Chart on Market Overview
    • Executive Summary - Data Table on Market Overview
    • Executive Summary - Chart on Global Market Characteristics
    • Executive Summary - Chart on Market by Geography
    • Executive Summary - Chart on Market Segmentation by End-user
    • Executive Summary - Chart on Incremental Growth
    • Executive Summary - Data Table on Incremental Growth
    • Executive Summary - Chart on Company Market Positioning

2 Market Landscape

  • 2.1 Market ecosystem
    • Parent Market
    • Data Table on - Parent Market
  • 2.2 Market characteristics
    • Market characteristics analysis
  • 2.3 Value chain analysis
    • Value Chain Analysis

3 Market Sizing

  • 3.1 Market definition
    • Offerings of companies included in the market definition
  • 3.2 Market segment analysis
    • Market segments
  • 3.3 Market size 2023
    • 3.4 Market outlook: Forecast for 2023-2028
      • Chart on Global - Market size and forecast 2023-2028 ($ million)
      • Data Table on Global - Market size and forecast 2023-2028 ($ million)
      • Chart on Global Market: Year-over-year growth 2023-2028 (%)
      • Data Table on Global Market: Year-over-year growth 2023-2028 (%)

    4 Historic Market Size

    • 4.1 Global Bulk Acoustic Wave Sensors Market 2018 - 2022
      • Historic Market Size - Data Table on Global Bulk Acoustic Wave Sensors Market 2018 - 2022 ($ million)
    • 4.2 End-user segment analysis 2018 - 2022
      • Historic Market Size - End-user Segment 2018 - 2022 ($ million)
    • 4.3 Geography segment analysis 2018 - 2022
      • Historic Market Size - Geography Segment 2018 - 2022 ($ million)
    • 4.4 Country segment analysis 2018 - 2022
      • Historic Market Size - Country Segment 2018 - 2022 ($ million)

    5 Five Forces Analysis

    • 5.1 Five forces summary
      • Five forces analysis - Comparison between 2023 and 2028
    • 5.2 Bargaining power of buyers
      • Bargaining power of buyers - Impact of key factors 2023 and 2028
    • 5.3 Bargaining power of suppliers
      • Bargaining power of suppliers - Impact of key factors in 2023 and 2028
    • 5.4 Threat of new entrants
      • Threat of new entrants - Impact of key factors in 2023 and 2028
    • 5.5 Threat of substitutes
      • Threat of substitutes - Impact of key factors in 2023 and 2028
    • 5.6 Threat of rivalry
      • Threat of rivalry - Impact of key factors in 2023 and 2028
    • 5.7 Market condition
      • Chart on Market condition - Five forces 2023 and 2028

    6 Market Segmentation by End-user

    • 6.1 Market segments
      • Chart on End-user - Market share 2023-2028 (%)
      • Data Table on End-user - Market share 2023-2028 (%)
    • 6.2 Comparison by End-user
      • Chart on Comparison by End-user
      • Data Table on Comparison by End-user
    • 6.3 Telecom - Market size and forecast 2023-2028
      • Chart on Telecom - Market size and forecast 2023-2028 ($ million)
      • Data Table on Telecom - Market size and forecast 2023-2028 ($ million)
      • Chart on Telecom - Year-over-year growth 2023-2028 (%)
      • Data Table on Telecom - Year-over-year growth 2023-2028 (%)
    • 6.4 Automotive - Market size and forecast 2023-2028
      • Chart on Automotive - Market size and forecast 2023-2028 ($ million)
      • Data Table on Automotive - Market size and forecast 2023-2028 ($ million)
      • Chart on Automotive - Year-over-year growth 2023-2028 (%)
      • Data Table on Automotive - Year-over-year growth 2023-2028 (%)
    • 6.5 Consumer electronics - Market size and forecast 2023-2028
      • Chart on Consumer electronics - Market size and forecast 2023-2028 ($ million)
      • Data Table on Consumer electronics - Market size and forecast 2023-2028 ($ million)
      • Chart on Consumer electronics - Year-over-year growth 2023-2028 (%)
      • Data Table on Consumer electronics - Year-over-year growth 2023-2028 (%)
    • 6.6 Others - Market size and forecast 2023-2028
      • Chart on Others - Market size and forecast 2023-2028 ($ million)
      • Data Table on Others - Market size and forecast 2023-2028 ($ million)
      • Chart on Others - Year-over-year growth 2023-2028 (%)
      • Data Table on Others - Year-over-year growth 2023-2028 (%)
    • 6.7 Market opportunity by End-user
      • Market opportunity by End-user ($ million)
      • Data Table on Market opportunity by End-user ($ million)

    7 Customer Landscape

    • 7.1 Customer landscape overview
      • Analysis of price sensitivity, lifecycle, customer purchase basket, adoption rates, and purchase criteria

    8 Geographic Landscape

    • 8.1 Geographic segmentation
      • Chart on Market share by geography 2023-2028 (%)
      • Data Table on Market share by geography 2023-2028 (%)
    • 8.2 Geographic comparison
      • Chart on Geographic comparison
      • Data Table on Geographic comparison
    • 8.3 North America - Market size and forecast 2023-2028
      • Chart on North America - Market size and forecast 2023-2028 ($ million)
      • Data Table on North America - Market size and forecast 2023-2028 ($ million)
      • Chart on North America - Year-over-year growth 2023-2028 (%)
      • Data Table on North America - Year-over-year growth 2023-2028 (%)
    • 8.4 APAC - Market size and forecast 2023-2028
      • Chart on APAC - Market size and forecast 2023-2028 ($ million)
      • Data Table on APAC - Market size and forecast 2023-2028 ($ million)
      • Chart on APAC - Year-over-year growth 2023-2028 (%)
      • Data Table on APAC - Year-over-year growth 2023-2028 (%)
    • 8.5 Europe - Market size and forecast 2023-2028
      • Chart on Europe - Market size and forecast 2023-2028 ($ million)
      • Data Table on Europe - Market size and forecast 2023-2028 ($ million)
      • Chart on Europe - Year-over-year growth 2023-2028 (%)
      • Data Table on Europe - Year-over-year growth 2023-2028 (%)
    • 8.6 Middle East and Africa - Market size and forecast 2023-2028
      • Chart on Middle East and Africa - Market size and forecast 2023-2028 ($ million)
      • Data Table on Middle East and Africa - Market size and forecast 2023-2028 ($ million)
      • Chart on Middle East and Africa - Year-over-year growth 2023-2028 (%)
      • Data Table on Middle East and Africa - Year-over-year growth 2023-2028 (%)
    • 8.7 South America - Market size and forecast 2023-2028
      • Chart on South America - Market size and forecast 2023-2028 ($ million)
      • Data Table on South America - Market size and forecast 2023-2028 ($ million)
      • Chart on South America - Year-over-year growth 2023-2028 (%)
      • Data Table on South America - Year-over-year growth 2023-2028 (%)
    • 8.8 US - Market size and forecast 2023-2028
      • Chart on US - Market size and forecast 2023-2028 ($ million)
      • Data Table on US - Market size and forecast 2023-2028 ($ million)
      • Chart on US - Year-over-year growth 2023-2028 (%)
      • Data Table on US - Year-over-year growth 2023-2028 (%)
    • 8.9 China - Market size and forecast 2023-2028
      • Chart on China - Market size and forecast 2023-2028 ($ million)
      • Data Table on China - Market size and forecast 2023-2028 ($ million)
      • Chart on China - Year-over-year growth 2023-2028 (%)
      • Data Table on China - Year-over-year growth 2023-2028 (%)
    • 8.10 UK - Market size and forecast 2023-2028
      • Chart on UK - Market size and forecast 2023-2028 ($ million)
      • Data Table on UK - Market size and forecast 2023-2028 ($ million)
      • Chart on UK - Year-over-year growth 2023-2028 (%)
      • Data Table on UK - Year-over-year growth 2023-2028 (%)
    • 8.11 Japan - Market size and forecast 2023-2028
      • Chart on Japan - Market size and forecast 2023-2028 ($ million)
      • Data Table on Japan - Market size and forecast 2023-2028 ($ million)
      • Chart on Japan - Year-over-year growth 2023-2028 (%)
      • Data Table on Japan - Year-over-year growth 2023-2028 (%)
    • 8.12 Germany - Market size and forecast 2023-2028
      • Chart on Germany - Market size and forecast 2023-2028 ($ million)
      • Data Table on Germany - Market size and forecast 2023-2028 ($ million)
      • Chart on Germany - Year-over-year growth 2023-2028 (%)
      • Data Table on Germany - Year-over-year growth 2023-2028 (%)
    • 8.13 Market opportunity by geography
      • Market opportunity by geography ($ million)
      • Data Tables on Market opportunity by geography ($ million)

    9 Drivers, Challenges, and Opportunity/Restraints

    • 9.1 Market drivers
      • 9.2 Market challenges
        • 9.3 Impact of drivers and challenges
          • Impact of drivers and challenges in 2023 and 2028
        • 9.4 Market opportunities/restraints

          10 Competitive Landscape

          • 10.1 Overview
            • 10.2 Competitive Landscape
              • Overview on criticality of inputs and factors of differentiation
            • 10.3 Landscape disruption
              • Overview on factors of disruption
            • 10.4 Industry risks
              • Impact of key risks on business

            11 Competitive Analysis

            • 11.1 Companies profiled
              • Companies covered
            • 11.2 Market positioning of companies
              • Matrix on companies position and classification
            • 11.3 Akoustis Technologies Inc.
              • Akoustis Technologies Inc. - Overview
              • Akoustis Technologies Inc. - Product / Service
              • Akoustis Technologies Inc. - Key offerings
            • 11.4 API Microelectronics Ltd.
              • API Microelectronics Ltd. - Overview
              • API Microelectronics Ltd. - Product / Service
              • API Microelectronics Ltd. - Key offerings
            • 11.5 Broadcom Inc.
              • Broadcom Inc. - Overview
              • Broadcom Inc. - Business segments
              • Broadcom Inc. - Key news
              • Broadcom Inc. - Key offerings
              • Broadcom Inc. - Segment focus
            • 11.6 Microchip Technology Inc.
              • Microchip Technology Inc. - Overview
              • Microchip Technology Inc. - Business segments
              • Microchip Technology Inc. - Key news
              • Microchip Technology Inc. - Key offerings
              • Microchip Technology Inc. - Segment focus
            • 11.7 Murata Manufacturing Co. Ltd.
              • Murata Manufacturing Co. Ltd. - Overview
              • Murata Manufacturing Co. Ltd. - Business segments
              • Murata Manufacturing Co. Ltd. - Key news
              • Murata Manufacturing Co. Ltd. - Key offerings
              • Murata Manufacturing Co. Ltd. - Segment focus
            • 11.8 Qorvo Inc.
              • Qorvo Inc. - Overview
              • Qorvo Inc. - Business segments
              • Qorvo Inc. - Key news
              • Qorvo Inc. - Key offerings
              • Qorvo Inc. - Segment focus
            • 11.9 Qualcomm Inc.
              • Qualcomm Inc. - Overview
              • Qualcomm Inc. - Business segments
              • Qualcomm Inc. - Key news
              • Qualcomm Inc. - Key offerings
              • Qualcomm Inc. - Segment focus
            • 11.10 TAIYO YUDEN Co. Ltd.
              • TAIYO YUDEN Co. Ltd. - Overview
              • TAIYO YUDEN Co. Ltd. - Product / Service
              • TAIYO YUDEN Co. Ltd. - Key offerings
            • 11.11 TDK Corp.
              • TDK Corp. - Overview
              • TDK Corp. - Business segments
              • TDK Corp. - Key news
              • TDK Corp. - Key offerings
              • TDK Corp. - Segment focus
            • 11.12 Teledyne Technologies Inc.
              • Teledyne Technologies Inc. - Overview
              • Teledyne Technologies Inc. - Business segments
              • Teledyne Technologies Inc. - Key news
              • Teledyne Technologies Inc. - Key offerings
              • Teledyne Technologies Inc. - Segment focus

            12 Appendix

            • 12.1 Scope of the report
              • 12.2 Inclusions and exclusions checklist
                • Inclusions checklist
                • Exclusions checklist
              • 12.3 Currency conversion rates for US$
                • Currency conversion rates for US$
              • 12.4 Research methodology
                • Research methodology
              • 12.5 Data procurement
                • Information sources
              • 12.6 Data validation
                • Data validation
              • 12.7 Validation techniques employed for market sizing
                • Validation techniques employed for market sizing
              • 12.8 Data synthesis
                • Data synthesis
              • 12.9 360 degree market analysis
                • 360 degree market analysis
              • 12.10 List of abbreviations
                • List of abbreviations

              Research Methodology

              Technavio presents a detailed picture of the market by way of study, synthesis, and summation of data from multiple sources. The analysts have presented the various facets of the market with a particular focus on identifying the key industry influencers. The data thus presented is comprehensive, reliable, and the result of extensive research, both primary and secondary.

              INFORMATION SOURCES

              Primary sources

              • Manufacturers and suppliers
              • Channel partners
              • Industry experts
              • Strategic decision makers

              Secondary sources

              • Industry journals and periodicals
              • Government data
              • Financial reports of key industry players
              • Historical data
              • Press releases

              DATA ANALYSIS

              Data Synthesis

              • Collation of data
              • Estimation of key figures
              • Analysis of derived insights

              Data Validation

              • Triangulation with data models
              • Reference against proprietary databases
              • Corroboration with industry experts

              REPORT WRITING

              Qualitative

              • Market drivers
              • Market challenges
              • Market trends
              • Five forces analysis

              Quantitative

              • Market size and forecast
              • Market segmentation
              • Geographical insights
              • Competitive landscape

              Interested in this report?

              Get your sample now to see our research methodology and insights!

              Download Now

              Frequently Asked Questions

              Bulk Acoustic Wave Sensors market growth will increase by $ 133.6 mn during 2024-2028 .

              The Bulk Acoustic Wave Sensors market is expected to grow at a CAGR of 10.04% during 2024-2028 .

              Bulk Acoustic Wave Sensors market is segmented by End-user( Telecom, Automotive, Consumer electronics, Others)

              Akoustis Technologies Inc., API Microelectronics Ltd., Broadcom Inc., Microchip Technology Inc., Murata Manufacturing Co. Ltd., Qorvo Inc., Qualcomm Inc., TAIYO YUDEN Co. Ltd., TDK Corp., Teledyne Technologies Inc. are a few of the key vendors in the Bulk Acoustic Wave Sensors market.

              North America will register the highest growth rate of 37% among the other regions. Therefore, the Bulk Acoustic Wave Sensors market in North America is expected to garner significant business opportunities for the vendors during the forecast period.

              US, China, UK, Japan, Germany

              • Proliferation of smartphones and tabletsAdvanced wireless technology has enabled the development of new RF features in smartphones and tablets. For instance is the driving factor this market.
              • Epcos AG manufactures BAW duplexers and filters that use acoustic sensors. These new hybrid sensors can enable improved miniaturization while exhibiting low insertion losses is the driving factor this market.
              • isolation is the driving factor this market.
              • and triple beat in CDMA systems. The prolific growth in the shipment of tablets and smartphones has created a steady demand for filter technologies is the driving factor this market.
              • especially BAW sensors is the driving factor this market.
              • due to their compatibility with higher bandwidth frequencies as well as the growing proliferation of 4G/LTE networks.High-end smartphones require BAW sensors to support frequencies above 1.8 GHz for many applications. The cost of BAW sensors is $0.30-$1 is the driving factor this market.
              • and BAW sensors have the smallest form factor coupled with high levels of performance. Additionally is the driving factor this market.
              • the ability to process BAW sensors on silicon wafers makes filter technology a very attractive option. Thus is the driving factor this market.
              • the proliferation of smartphones and tablets is expected to encourage RF device manufacturers to develop high-performance RF components that meet the requirements of mobile device manufacturers. is the driving factor this market.

              The Bulk Acoustic Wave Sensors market vendors should focus on grabbing business opportunities from the Telecom segment as it accounted for the largest market share in the base year.