Canned Mushroom Market Size 2026-2030
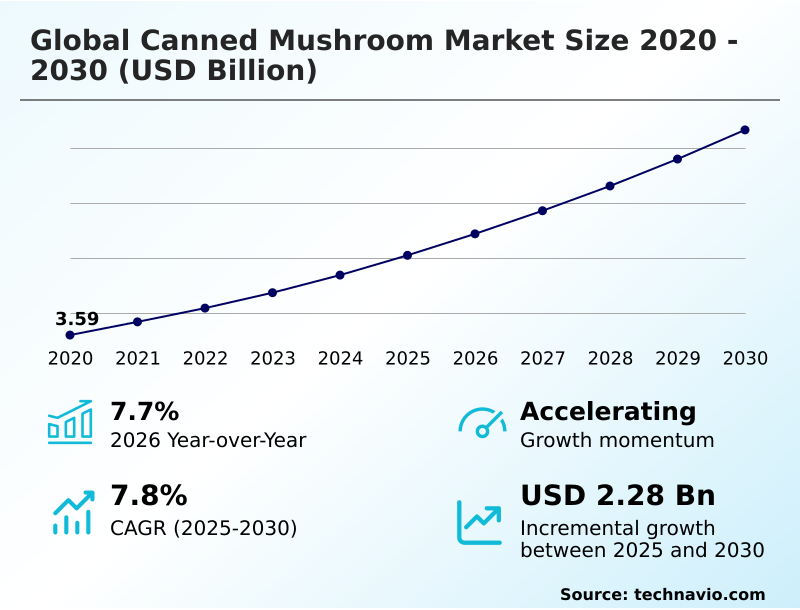
The canned mushroom market size is valued to increase by USD 2.28 billion, at a CAGR of 7.8% from 2025 to 2030. Increasing consumer preference for convenient and shelf-stable food solutions will drive the canned mushroom market.
Major Market Trends & Insights
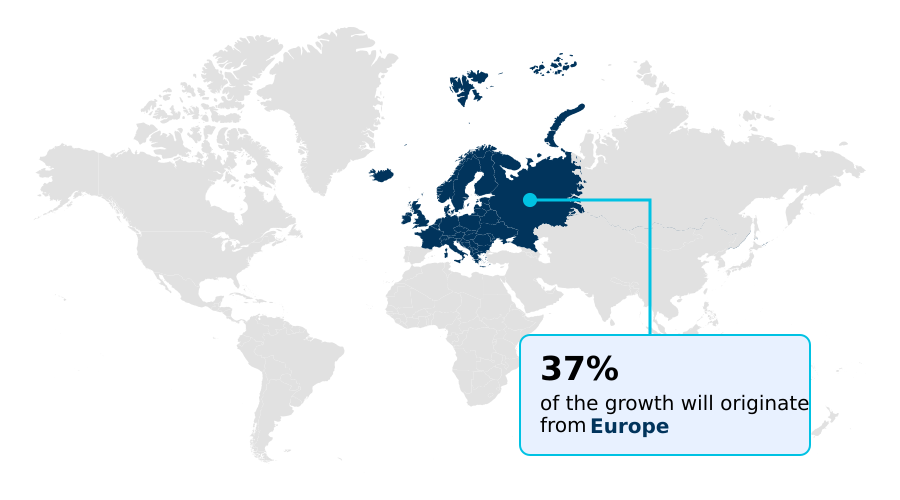
- Europe dominated the market and accounted for a 37.4% growth during the forecast period.
- By Product - Canned button mushroom segment was valued at USD 1.73 billion in 2024
- By End-user - Household segment accounted for the largest market revenue share in 2024
Market Size & Forecast
- Market Opportunities: USD 3.73 billion
- Market Future Opportunities: USD 2.28 billion
- CAGR from 2025 to 2030 : 7.8%
Market Summary
- The Canned Mushroom Market is undergoing a period of robust expansion, driven by consumer demand for convenient, shelf-stable, and nutritionally dense food options. As lifestyles become faster, the preference for ready-to-use culinary ingredients has surged, positioning preserved mushrooms as a vital component in both homes and commercial kitchens.
- These products offer an extended shelf life while retaining essential vitamins and minerals, appealing to health-conscious individuals who prioritize plant-based nutrition. The market is also benefiting from the global shift toward vegetarianism, as mushrooms serve as an effective meat substitute due to their umami flavor and high protein content.
- The foodservice industry remains a significant driver of growth, using preserved fungi to ensure consistency and manage inventory costs. For instance, a foodservice distributor optimizing its supply chain can leverage the stability of canned goods to reduce spoilage-related losses by up to 15% compared to fresh alternatives.
- Innovations in packaging, such as BPA-free linings and easy-open lids, have enhanced consumer trust. The market is also seeing a rise in specialty varieties, catering to the growing interest in gourmet and international cuisines. As retailers expand their private-label offerings, the market continues to diversify to meet specific dietary needs.
What will be the Size of the Canned Mushroom Market during the forecast period?
Get Key Insights on Market Forecast (PDF) Get Free Sample
How is the Canned Mushroom Market Segmented?
The canned mushroom industry research report provides comprehensive data (region-wise segment analysis), with forecasts and estimates in "USD million" for the period 2026-2030, as well as historical data from 2020-2024 for the following segments.
- Product
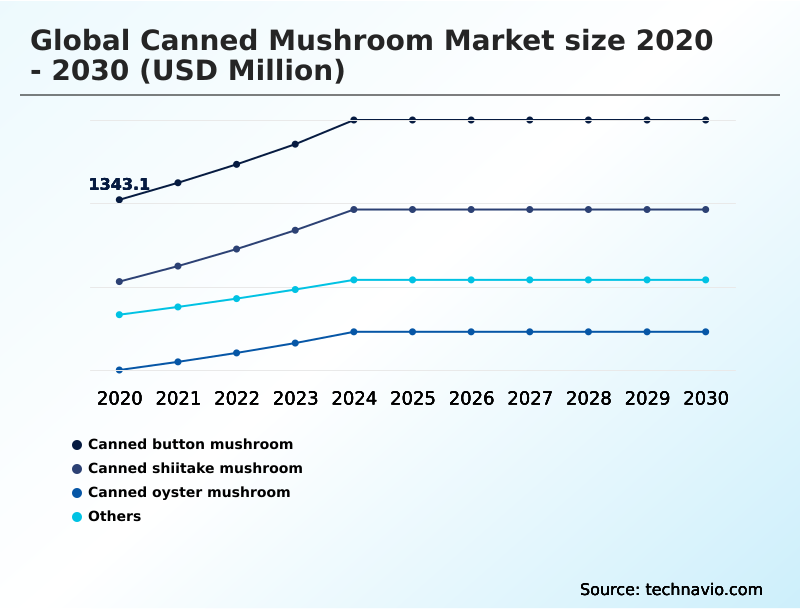
- Canned button mushroom
- Canned shiitake mushroom
- Canned oyster mushroom
- Others
- End-user
- Household
- HoReCa
- Distribution channel
- Offline
- Online
- Geography
- Europe
- Germany
- France
- UK
- APAC
- China
- Japan
- South Korea
- North America
- US
- Canada
- Mexico
- South America
- Brazil
- Argentina
- Middle East and Africa
- South Africa
- Saudi Arabia
- UAE
- Rest of World (ROW)
- Europe
By Product Insights
The canned button mushroom segment is estimated to witness significant growth during the forecast period.
The canned button mushroom segment leads the market, valued for its consistency in both household consumption and the demanding HoReCa sector.
The canning process, involving careful thermal processing and a precisely formulated brine solution, ensures extended shelf stability and year-round availability. This reliability is crucial for inventory management. Advanced automated sorting technology maintains product uniformity, a key requirement for industrial kitchens.
Metallic containers are standard, though innovations in eco-friendly packaging are reshaping the industry, with new materials reducing the carbon footprint by over 20%.
This evolution allows for greater culinary diversity with ready-to-use food components, as the sterilization process is refined to better preserve texture and flavor, satisfying a broad consumer base.
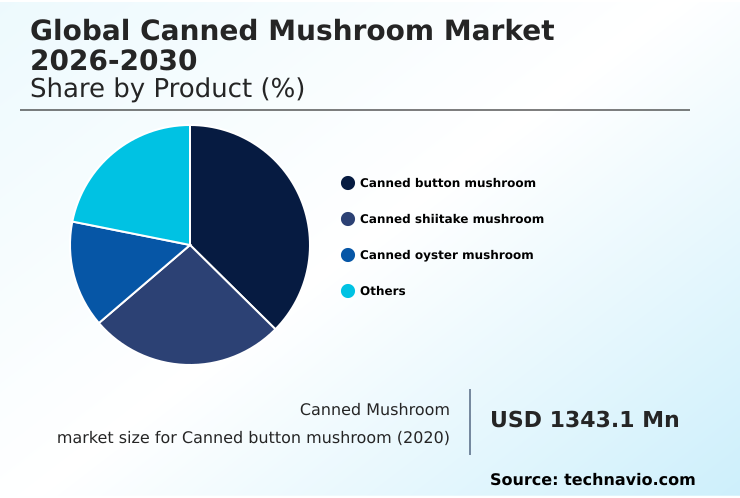
The Canned button mushroom segment was valued at USD 1.73 billion in 2024 and showed a gradual increase during the forecast period.
Regional Analysis
Europe is estimated to contribute 37.4% to the growth of the global market during the forecast period.Technavio’s analysts have elaborately explained the regional trends and drivers that shape the market during the forecast period.
See How Canned Mushroom Market Demand is Rising in Europe Get Free Sample
The geographic landscape is diverse, with APAC leading production through extensive substrate cultivation on agricultural by-products, while Europe and North America drive demand in the HoReCa sector and foodservice industry.
In Europe, circular economy goals are paramount, with regulations mandating that food packaging must contain at least 40% recycled materials. This has spurred innovations in airtight sealing and eco-friendly packaging.
In North America, the focus is on genetic strain development to create mushrooms better suited for preservation. Key to all regions is ensuring year-round availability of non-perishable items through global distribution networks.
Techniques like blanching and securing hermetic seals are standardized globally to ensure safety and quality across all markets.
Market Dynamics
Our researchers analyzed the data with 2025 as the base year, along with the key drivers, trends, and challenges. A holistic analysis of drivers will help companies refine their marketing strategies to gain a competitive advantage.
- Strategic decision-making in the canned mushroom market requires a granular understanding of consumer preferences and technical realities. For instance, the canned button mushroom nutritional value is a key selling point for health-conscious buyers, who also prioritize low sodium canned mushroom options and products with clean label canned food products.
- On the technical front, the industry is balancing raw material costs for canning with investments in advances in food preservation tech. The choice between canned shiitake vs fresh shiitake often comes down to convenience and cost, particularly for the horeca use of canned mushrooms, where consistency is paramount.
- Manufacturers are focusing on ensuring food safety in canned vegetables by perfecting retort cycles for mushroom canning and using bpa-free linings in food cans to prevent contamination and build trust. This is critical for preventing botulism in canned foods. The benefits of organic canned mushrooms are being highlighted in marketing campaigns, appealing to a premium segment.
- Innovations in sustainable packaging for canned foods are addressing environmental concerns, while the umami flavor in preserved fungi is being leveraged to position products as ideal for canned oyster mushrooms vegan recipes or as the best canned mushroom for pizza.
- The brine solution impact on mushrooms is a subject of ongoing R&D to improve texture and shelf life of sealed mushrooms. These interconnected factors define the primary mushroom canning industry challenges and opportunities.
What are the key market drivers leading to the rise in the adoption of Canned Mushroom Industry?
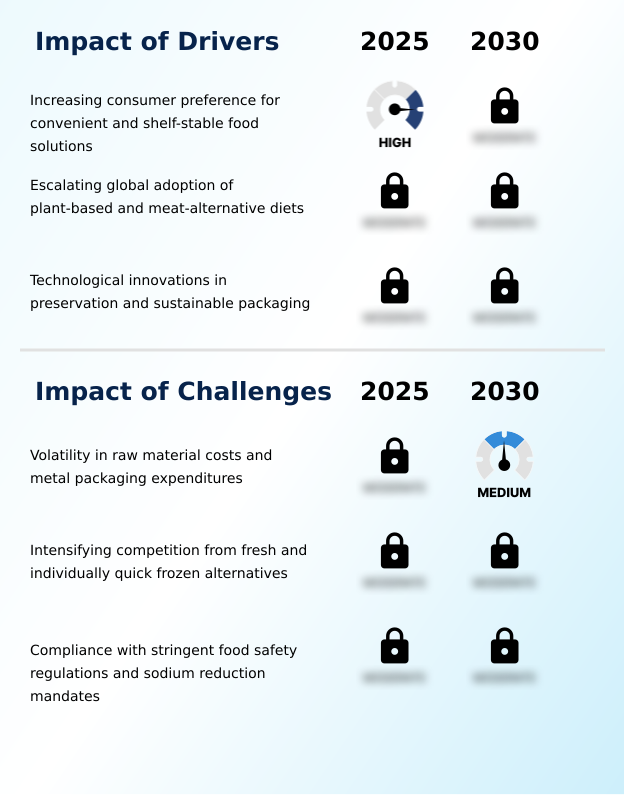
- A key driver fueling market expansion is the increasing consumer preference for convenient and shelf-stable food solutions that fit modern, fast-paced lifestyles.
- The market's expansion is propelled by the demand for shelf-stable food solutions and convenient culinary ingredients, particularly within fast-paced urban lifestyles.
- Plant-based nutrition and meat-alternative diets are significant drivers, with mushrooms prized for their natural umami flavor and plant-based protein content.
- Food preservation technology is advancing rapidly; optimized retort cycles and high-pressure pasteurization methods ensure better nutritional value retention, with new processes preserving up to 25% more key vitamins.
- Furthermore, the widespread adoption of BPA-free linings has become a standard for consumer safety, supporting the trend of fast-paced meal preparation and boosting confidence in canned goods as a healthy dietary choice.
What are the market trends shaping the Canned Mushroom Industry?
- The market is defined by a significant trend toward clean label products and organic preservation methods, responding to consumer demands for greater ingredient transparency.
- A primary trend is the move toward clean label products and organic preservation methods, which enhances consumer trust enhancement. This shift involves transparent sourcing and ethical sourcing practices, with some brands achieving a 15% higher retention rate among health-conscious buyers. The expansion of specialty mushroom varieties is driving premiumization and greater culinary diversity.
- Innovations in sustainable packaging and smart packaging are critical, with biodegradable lining and low-temperature preservation techniques improving product quality. These technologies are also key to environmental footprint reduction efforts. For instance, new packaging formats have reduced material usage by up to 10% without compromising integrity, showcasing a commitment to sustainability.
What challenges does the Canned Mushroom Industry face during its growth?
- A primary challenge affecting industry growth is the significant volatility in the costs of raw materials and metal packaging components.
- The industry faces considerable headwinds from volatile raw material costs, including food-grade aluminum and high-tensile steel alloy for packaging. This financial pressure threatens supply chain resilience and impacts operational efficiency. Competition from individually quick frozen (IQF) products and the farm-to-table movement is intensifying, as improved cold-chain logistics make fresh alternatives more accessible.
- Adherence to food safety regulations and sodium reduction mandates necessitates constant R&D, with reformulation efforts increasing development costs by over 15% for some manufacturers. Regulatory compliance, alongside the need for better inventory management and automated harvesting to control labor costs, presents a complex challenge for producers navigating the global distribution networks.
Exclusive Technavio Analysis on Customer Landscape
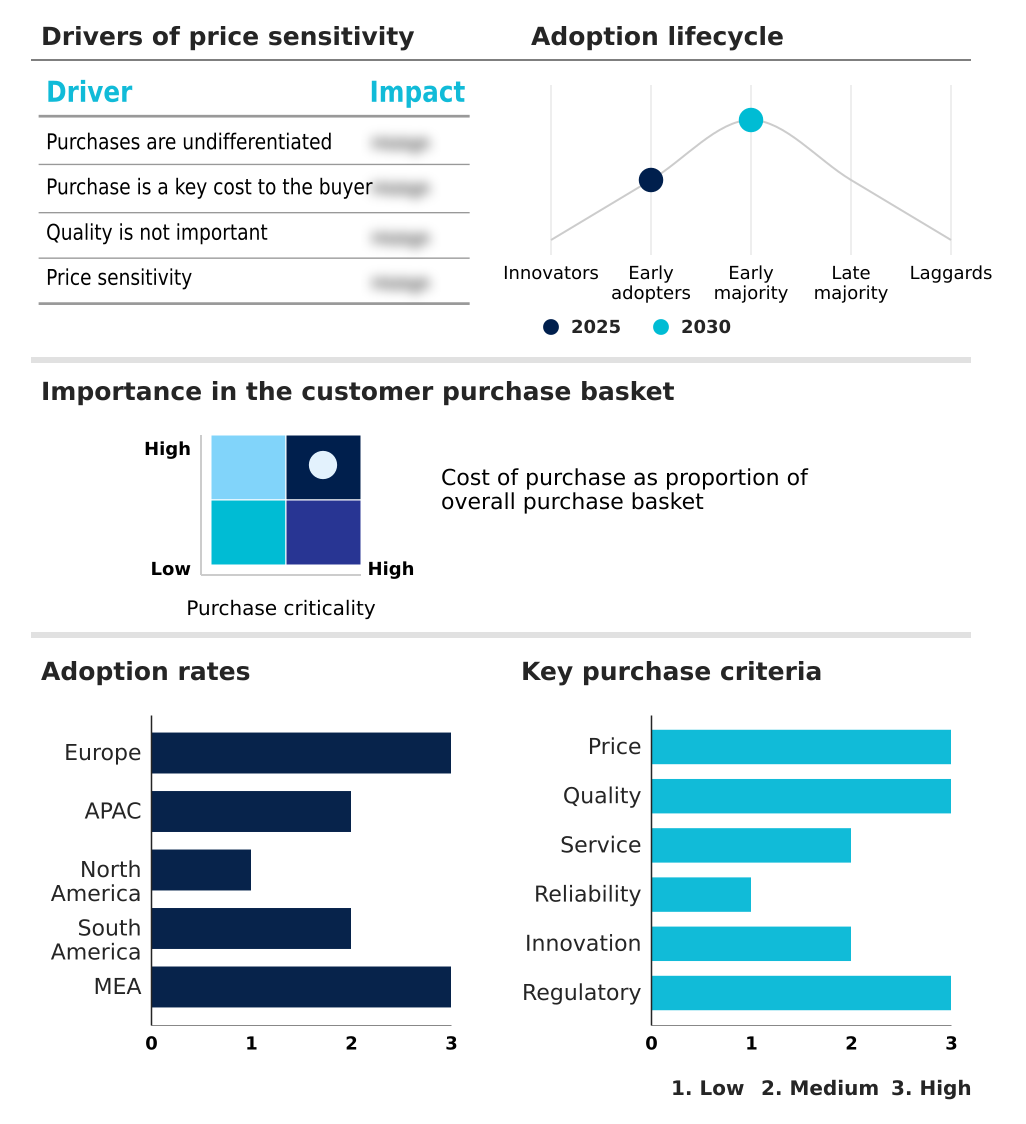
The canned mushroom market forecasting report includes the adoption lifecycle of the market, covering from the innovator’s stage to the laggard’s stage. It focuses on adoption rates in different regions based on penetration. Furthermore, the canned mushroom market report also includes key purchase criteria and drivers of price sensitivity to help companies evaluate and develop their market growth analysis strategies.
Customer Landscape of Canned Mushroom Industry
Competitive Landscape
Companies are implementing various strategies, such as strategic alliances, canned mushroom market forecast, partnerships, mergers and acquisitions, geographical expansion, and product/service launches, to enhance their presence in the industry.
American Garden - Delivering shelf-stable fungal ingredients for diverse culinary applications, ensuring consistent quality and year-round availability through advanced thermal processing and preservation techniques.
The industry research and growth report includes detailed analyses of the competitive landscape of the market and information about key companies, including:
- American Garden
- BONDUELLE SA
- Costa Group Holdings Ltd.
- Finc Bio-tech Co.Ltd.
- Fujian Haishan Foods Co. Ltd.
- Giorgio Fresh Co.
- Greenfood co.
- Greenyard NV
- Monterey Mushrooms Inc.
- OKECHAMP S.A.
- Prochamp BV
- R-Biopharm AG
- Scelta Mushrooms
- South Mill Champs
- XIAMEN AMOYTOP CO Ltd.
Qualitative and quantitative analysis of companies has been conducted to help clients understand the wider business environment as well as the strengths and weaknesses of key industry players. Data is qualitatively analyzed to categorize companies as pure play, category-focused, industry-focused, and diversified; it is quantitatively analyzed to categorize companies as dominant, leading, strong, tentative, and weak.
Recent Development and News in Canned mushroom market
- In May 2025, the International Mushroom Science Society introduced a new genetic strain of button mushroom bred for high-heat canning, enhancing color and structural integrity post-sterilization.
- In July 2025, Greenyard Group implemented an advanced water-recycling system across its vegetable processing facilities to minimize the environmental impact of its canning operations.
- In October 2025, American Garden launched a new product line of canned mushrooms in easy-open, BPA-free metallic containers, addressing modern consumer health and convenience preferences.
- In November 2025, the International Food Safety Oversight Committee mandated stricter limits on trace sodium levels in preserved vegetables, compelling brands to reformulate brine recipes.
Dive into Technavio’s robust research methodology, blending expert interviews, extensive data synthesis, and validated models for unparalleled Canned Mushroom Market insights. See full methodology.
| Market Scope | |
|---|---|
| Page number | 289 |
| Base year | 2025 |
| Historic period | 2020-2024 |
| Forecast period | 2026-2030 |
| Growth momentum & CAGR | Accelerate at a CAGR of 7.8% |
| Market growth 2026-2030 | USD 2282.8 million |
| Market structure | Fragmented |
| YoY growth 2025-2026(%) | 7.7% |
| Key countries | Germany, France, UK, Italy, Spain, The Netherlands, China, Japan, South Korea, India, Australia, Indonesia, US, Canada, Mexico, Brazil, Argentina, Chile, South Africa, Saudi Arabia, UAE, Egypt and Turkey |
| Competitive landscape | Leading Companies, Market Positioning of Companies, Competitive Strategies, and Industry Risks |
Research Analyst Overview
- Boardroom decisions in the Canned Mushroom Market are increasingly centered on technology adoption to balance costs and quality. The core canning process now involves high-pressure pasteurization and optimized retort cycles to ensure shelf stability. Strategic investments are being directed towards automated harvesting and automated sorting technology, which can improve operational efficiency by over 25%.
- A major focus is on clean label products using organic preservation methods, a direct response to consumer demand. The shift to sustainable packaging is critical, utilizing eco-friendly packaging solutions like high-tensile steel alloy and biodegradable lining in food-grade aluminum metallic containers. Compliance with stringent food safety regulations, including the use of BPA-free linings and achieving sodium reduction mandates, is non-negotiable.
- The industry leverages blanching and low-temperature preservation techniques like vacuum-sealing for airtight sealing and hermetic seals to guarantee nutritional value retention and the desired umami flavor in plant-based protein offerings. Innovations like genetic strain development and managing cold-chain logistics for raw materials from substrate cultivation on agricultural by-products are also key, differentiating offerings from individually quick frozen (IQF) alternatives.
- The sterilization process is meticulously controlled to deliver a safe product.
What are the Key Data Covered in this Canned Mushroom Market Research and Growth Report?
-
What is the expected growth of the Canned Mushroom Market between 2026 and 2030?
-
USD 2.28 billion, at a CAGR of 7.8%
-
-
What segmentation does the market report cover?
-
The report is segmented by Product (Canned button mushroom, Canned shiitake mushroom, Canned oyster mushroom, and Others), End-user (Household, and HoReCa), Distribution Channel (Offline, and Online) and Geography (Europe, APAC, North America, South America, Middle East and Africa)
-
-
Which regions are analyzed in the report?
-
Europe, APAC, North America, South America and Middle East and Africa
-
-
What are the key growth drivers and market challenges?
-
Increasing consumer preference for convenient and shelf-stable food solutions, Volatility in raw material costs and metal packaging expenditures
-
-
Who are the major players in the Canned Mushroom Market?
-
American Garden, BONDUELLE SA, Costa Group Holdings Ltd., Finc Bio-tech Co.Ltd., Fujian Haishan Foods Co. Ltd., Giorgio Fresh Co., Greenfood co., Greenyard NV, Monterey Mushrooms Inc., OKECHAMP S.A., Prochamp BV, R-Biopharm AG, Scelta Mushrooms, South Mill Champs and XIAMEN AMOYTOP CO Ltd.
-
Market Research Insights
- Market dynamics are shaped by a convergence of consumer needs and operational imperatives. The growing adoption of meat-alternative diets and demand for convenient culinary ingredients have created a fertile ground for growth. In the foodservice industry, operators using shelf-stable ingredients report up to a 20% reduction in preparation time compared to fresh counterparts.
- Meanwhile, regulatory compliance with sodium reduction mandates and food safety regulations guides product development. Enhanced inventory management systems, leveraging shelf-stable products, can decrease spoilage-related losses by over 30%, directly improving profitability. This intersection of plant-based nutrition trends and tangible operational efficiency gains underscores the market's robust position.
We can help! Our analysts can customize this canned mushroom market research report to meet your requirements.
 RIA -
RIA - 
