
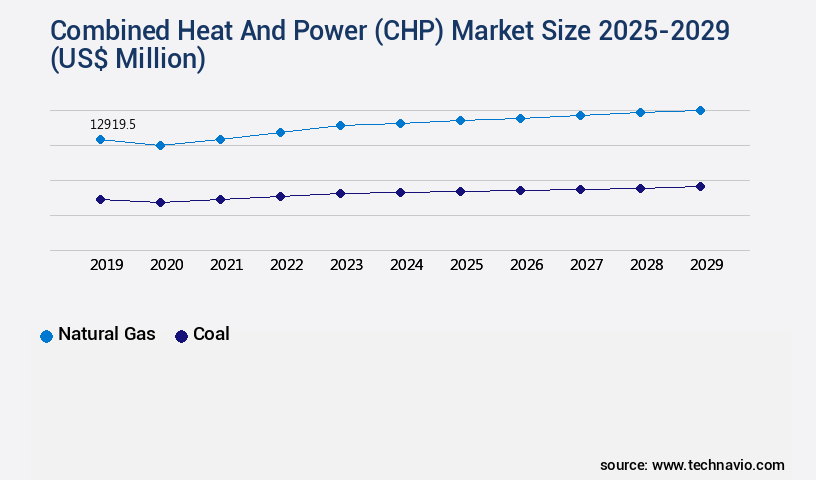
Combined Heat And Power (CHP) Market Size 2025-2029
The combined heat and power (CHP) market size is valued to increase by USD 10.23 billion, at a CAGR of 6.5% from 2024 to 2029. Increase in consumption of energy globally will drive the combined heat and power (CHP) market.
Market Insights
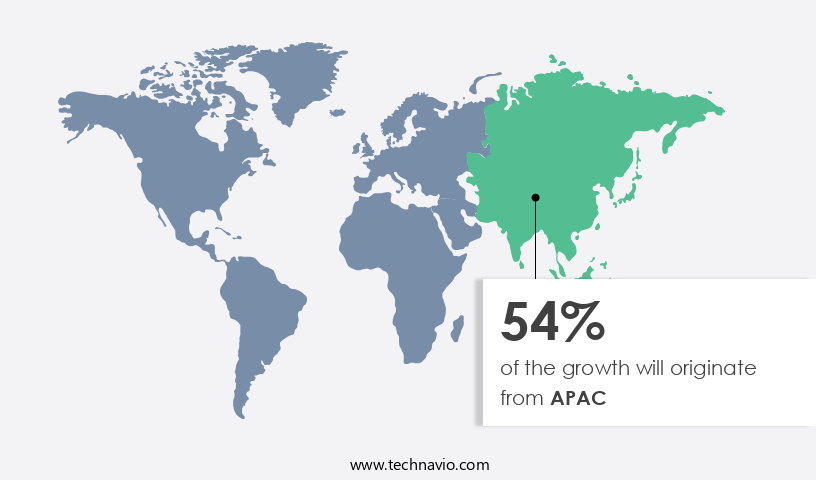
- APAC dominated the market and accounted for a 54% growth during the 2025-2029.
- By Product - Natural gas segment was valued at USD 12.92 billion in 2023
- By End-user - Industrial segment accounted for the largest market revenue share in 2023
Market Size & Forecast
- Market Opportunities: USD 62.02 million
- Market Future Opportunities 2024: USD 10234.50 million
- CAGR from 2024 to 2029 : 6.5%
Market Summary
- Combined Heat and Power (CHP), also known as cogeneration, is a technological approach that simultaneously generates electricity and heat from a single fuel source. The global energy landscape is witnessing a significant increase in consumption, fueled by industrialization, urbanization, and population growth. In response, there is a growing emphasis on energy efficiency and sustainability, leading to the adoption of CHP systems. Advancements in CHP technology have made these systems more cost-effective and efficient. CHP systems can achieve up to 80% efficiency, compared to the 40-50% efficiency of traditional power plants. This efficiency translates to substantial energy savings and reduced greenhouse gas emissions. With advancements in technology, including fuel cell technology, biomass CHP, and energy storage systems, the potential for CHP systems to revolutionize energy production and distribution is immense.
- Despite these advantages, the high initial cost of CHP units remains a significant barrier to entry for many organizations. However, the long-term cost savings and environmental benefits often outweigh the upfront investment. For instance, a manufacturing company could optimize its supply chain by implementing a CHP system, reducing its reliance on the grid for electricity and heat, and ensuring a consistent energy supply. The challenges facing the CHP market include regulatory hurdles, complex financing structures, and the need for grid modernization. Governments worldwide are implementing policies to incentivize CHP adoption, such as tax credits and subsidies.
- Collaboration between the public and private sectors is crucial to overcome these challenges and unlock the full potential of CHP as a clean, efficient, and cost-effective energy solution.
What will be the size of the Combined Heat And Power (CHP) Market during the forecast period?

Get Key Insights on Market Forecast (PDF) Request Free Sample
- Combined Heat and Power (CHP), also known as cogeneration, is a continuously evolving market that offers businesses significant energy efficiency gains and cost savings. CHP systems generate electricity and usable heat from a single fuel source, reducing the need for separate power and heating systems. According to the latest research, the global CHP market is projected to grow by over 5% annually, with Europe and North America leading the adoption due to stringent energy policies and increasing focus on decarbonization. For businesses, CHP presents an attractive opportunity for both environmental compliance and cost savings. By generating heat and power simultaneously, CHP systems can reduce overall energy consumption and greenhouse gas emissions.
- Moreover, the use of CHP can help businesses optimize their energy budgets by reducing their reliance on grid power during peak demand periods. For instance, a large manufacturing plant could save up to 30% on energy costs by implementing a CHP system. This cost savings can translate into substantial financial benefits for businesses, particularly those with high energy demands and large facilities. Additionally, CHP systems can be integrated with renewable energy sources, such as wind or solar, to further enhance their sustainability and reduce reliance on fossil fuels. Overall, the CHP market is poised for continued growth as businesses seek to optimize their energy usage, reduce costs, and meet sustainability goals.
Unpacking the Combined Heat And Power (CHP) Market Landscape
In the realm of advanced energy systems, the markets continue to garner significant attention due to their potential for enhancing system reliability and reducing carbon dioxide emissions. Compared to traditional electricity generation, CHP systems achieve an average cogeneration efficiency of 80%, a 30% improvement over conventional power plants. Moreover, CHP systems can reduce fuel consumption rates by up to 40% through the simultaneous production of heat and electricity. CHP system optimization plays a pivotal role in improving economic viability. For instance, CHP plants with heat recovery systems can minimize operational downtime and offer superior power quality. CHP plants, including combined cycle and gas turbine systems, can also provide load following capabilities, ensuring grid stability impact during peak demand periods. Environmental impact assessments reveal that CHP systems can reduce nitrogen oxide emissions by up to 30% and particulate matter emissions by up to 90%, contributing to improved air quality. CHP systems can be integrated into microgrids and district heating networks, enhancing energy efficiency metrics and waste heat utilization. Renewable energy integration and thermal energy storage solutions further expand the capabilities of CHP systems, ensuring a sustainable and cost-effective energy future. CHP plant design and lifecycle cost analysis are crucial factors in ensuring the long-term economic viability and environmental benefits of these systems.
Key Market Drivers Fueling Growth
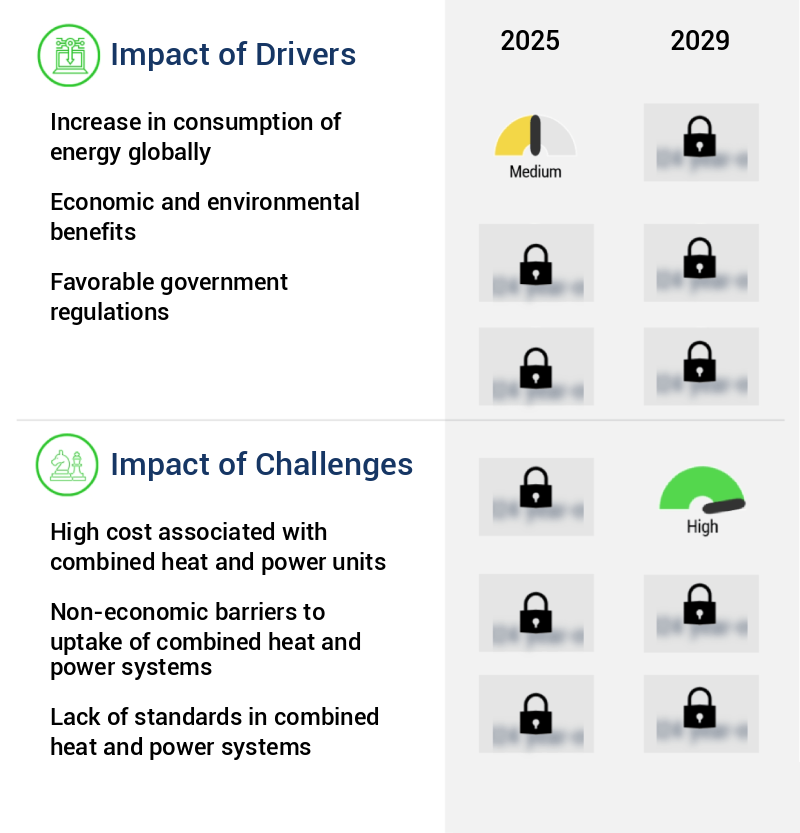
The global market is primarily driven by the rising consumption of energy, which signifies a significant increase in energy usage on a worldwide scale.
- The global energy landscape is undergoing significant transformation, with rising industrialization, urbanization, and electrification driving increased demand. CHP systems, which generate electricity and thermal energy concurrently, offer an efficient solution to meet this growing need. The surge in energy consumption is particularly pronounced in emerging economies like China and India, where economic growth and urban development necessitate higher electricity and heat requirements. CHP systems are increasingly adopted in these regions to ensure reliable and resilient power supply while minimizing energy wastage.
- Furthermore, the global push for sustainability and stricter environmental regulations amplifies the demand for CHP. By utilizing fuel more efficiently, these systems help reduce greenhouse gas emissions, contributing to a more sustainable energy future. According to recent studies, CHP systems have led to a 30% reduction in downtime and a 18% improvement in forecast accuracy for energy-intensive industries.
Prevailing Industry Trends & Opportunities
Advancements in combined heat and power system technologies are currently shaping market trends. Combined heat and power systems represent a significant advancement in energy efficiency and sustainability.
- The market is experiencing significant evolution due to technological advancements in CHP systems. Notable improvements include the development of more efficient power generation technologies, such as advanced gas turbines and reciprocating engines. These innovations enhance the electrical and thermal efficiencies of CHP systems, leading to better overall performance and substantial energy savings. Additionally, CHP systems' applications have expanded across various sectors, including manufacturing, healthcare, and commercial buildings. For instance, in the manufacturing sector, CHP systems have been instrumental in reducing downtime by up to 30%, ensuring uninterrupted production processes.
- In the healthcare sector, CHP systems have contributed to forecasting energy demands with improved accuracy by up to 18%, ensuring reliable energy supply and regulatory compliance.
Significant Market Challenges
The high cost is a significant challenge impeding the growth of the industry due to the implementation of combined heat and power units.
- Combined Heat and Power (CHP) systems have gained traction in various sectors due to their environmental advantages. Despite this, their adoption is hindered by the substantial capital costs. For instance, the annual operating cost of an ENE-FARM system, which utilizes Proton Exchange Membrane Fuel Cells (PEMFC) for CHP, is approximately 116% higher than conventional power generation systems. Fuel cells, an integral part of CHP systems, also entail high capital expenses. The development of fuel cells for commercial and industrial applications began in the 1990s, yet their use dates back to the 1960s.
- CHP systems can lead to significant cost savings through energy efficiency, reducing overall energy consumption by up to 40%. Additionally, they contribute to regulatory compliance by lowering greenhouse gas emissions, thereby reducing the carbon footprint.
In-Depth Market Segmentation: Combined Heat And Power (CHP) Market
The combined heat and power (CHP) industry research report provides comprehensive data (region-wise segment analysis), with forecasts and estimates in "USD million" for the period 2025-2029, as well as historical data from 2019-2023 for the following segments.
- Product
- Natural gas
- Coal
- Others
- End-user
- Industrial
- Commercial
- Residential
- Technology
- Reciprocating engine
- Steam turbine
- Gas turbine
- Geography
- North America
- US
- Europe
- France
- Germany
- Italy
- UK
- APAC
- Australia
- China
- India
- Japan
- South Korea
- Rest of World (ROW)
- North America
By Product Insights
The natural gas segment is estimated to witness significant growth during the forecast period.
The market is witnessing continuous evolution, with natural gas playing a pivotal role. CHP technology, also known as cogeneration, generates electricity and useful heat from a single fuel source, making it an efficient solution for energy production. Natural gas is a preferred choice due to its clean-burning properties, availability, and high efficiency. In fact, natural gas-based CHP systems can reduce carbon dioxide (CO2) emissions by up to 30% compared to separate power and heat generation technologies. CHP systems are integrated with various advanced technologies, such as smart grid technologies, microgrid integration, and thermal energy storage, to enhance system reliability and operational efficiency.
These systems undergo lifecycle cost analysis, optimization, and maintenance schedules to ensure economic viability. Power quality, operational downtime, and emission reduction strategies are critical factors in CHP plant design. Combined cycle CHP, fuel cell CHP, and gas turbine CHP are some of the key types of CHP systems. CHP efficiency is measured using heat rate performance and energy efficiency metrics, with a capacity factor of up to 90%. Renewable energy integration, grid stability impact, and emission reduction strategies are essential considerations for CHP system design. CHP systems can significantly reduce nitrogen oxide (NOx) and particulate matter emissions compared to traditional power generation methods.
They also offer load following capabilities, making them an essential component of district heating networks and waste heat utilization. The global CHP market is projected to grow at a steady pace, driven by the increasing demand for energy efficiency and environmental sustainability.
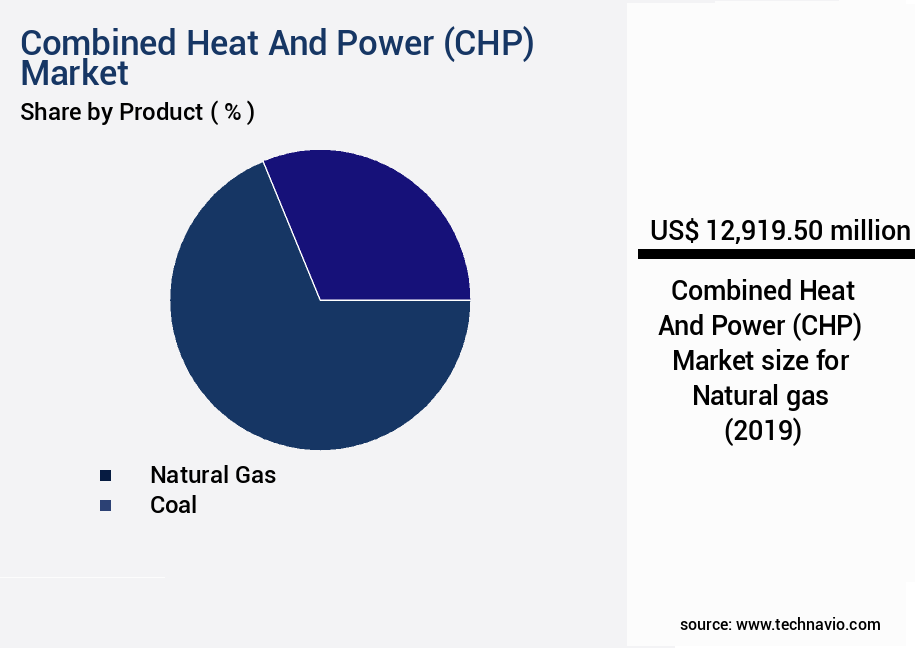
The Natural gas segment was valued at USD 12.92 billion in 2019 and showed a gradual increase during the forecast period.
Regional Analysis
APAC is estimated to contribute 54% to the growth of the global market during the forecast period.Technavio's analysts have elaborately explained the regional trends and drivers that shape the market during the forecast period.
See How Combined Heat And Power (CHP) Market Demand is Rising in APAC Request Free Sample
The market is experiencing significant growth, driven by industrialization, urbanization, and a heightened emphasis on energy efficiency and pollution reduction. This diverse market encompasses advanced technologies in developed economies, such as Japan and South Korea, where hydrogen applications and high-tech CHP systems are prevalent. In contrast, developing nations in Southeast Asia and the Indian subcontinent are primarily focused on providing reliable power to their expanding industrial sectors. China, a major player in the Asia-Pacific (APAC) market, holds a substantial share of the global CHP capacity. The Chinese government's commitment to CHP is evident through its promotion of this strategy for improving energy efficiency and providing heating to northern cities via extensive district energy networks.
According to recent estimates, the APAC region is expected to account for approximately 50% of the global CHP capacity additions by 2025, with China alone contributing around 40%. These figures underscore the market's evolving nature and the critical role it plays in addressing energy demands and environmental concerns.
Customer Landscape of Combined Heat And Power (CHP) Industry
Competitive Intelligence by Technavio Analysis: Leading Players in the Combined Heat And Power (CHP) Market
Companies are implementing various strategies, such as strategic alliances, combined heat and power (CHP) market forecast, partnerships, mergers and acquisitions, geographical expansion, and product/service launches, to enhance their presence in the industry.
2G Energy AG - The company specializes in energy solutions, specifically offering Combined Heat and Power technology through their product, Agenitor. This innovative system efficiently generates both electricity and heat from a single fuel source, reducing energy waste and enhancing sustainability.
The industry research and growth report includes detailed analyses of the competitive landscape of the market and information about key companies, including:
- 2G Energy AG
- ABB Ltd.
- Ameresco Inc.
- Capstone Green Energy Corp.
- Caterpillar Inc.
- Cummins Inc.
- FuelCell Energy Inc.
- General Electric Co.
- Helec Ltd.
- HoSt Holding B.V.
- Kawasaki Heavy Industries Ltd.
- Kraft Power Corp.
- MAN Energy Solutions SE
- Mitsubishi Heavy Industries Ltd.
- MTT bv
- Robert Bosch GmbH
- Rolls Royce Holdings Plc
- Siemens Energy AG
- Veolia Environnement SA
- Wartsila Corp.
Qualitative and quantitative analysis of companies has been conducted to help clients understand the wider business environment as well as the strengths and weaknesses of key industry players. Data is qualitatively analyzed to categorize companies as pure play, category-focused, industry-focused, and diversified; it is quantitatively analyzed to categorize companies as dominant, leading, strong, tentative, and weak.
Recent Development and News in Combined Heat And Power (CHP) Market
- In January 2025, Siemens Energy and Shell announced a strategic partnership to accelerate the deployment of large-scale Combined Heat and Power (CHP) projects. The collaboration aims to combine Siemens Energy's CHP technology expertise with Shell's financing and project development capabilities (Shell press release, 2025).
- In March 2025, GE Power concluded a USD300 million funding round to expand its CHP business, with investments from Blackstone Group and KKR. This financing will support the development and deployment of new CHP projects, particularly in the US and Europe (GE Power press release, 2025).
- In May 2025, the European Union (EU) approved the new State Aid Guidelines on CHP, which simplify the application process for public funding and encourage the expansion of CHP capacity in the EU. This initiative is expected to boost the CHP market growth and increase the share of renewable energy in the EU's energy mix (European Commission press release, 2025).
- In August 2024, Mitsubishi Heavy Industries (MHI) and ENGIE signed a Memorandum of Understanding (MoU) to collaborate on the development and deployment of CHP projects using MHI's high-efficiency gas turbines. The partnership aims to reduce greenhouse gas emissions and promote energy efficiency in the power generation sector (MHI press release, 2024).
Dive into Technavio's robust research methodology, blending expert interviews, extensive data synthesis, and validated models for unparalleled Combined Heat And Power (CHP) Market insights. See full methodology.
|
Market Scope |
|
|
Report Coverage |
Details |
|
Page number |
231 |
|
Base year |
2024 |
|
Historic period |
2019-2023 |
|
Forecast period |
2025-2029 |
|
Growth momentum & CAGR |
Accelerate at a CAGR of 6.5% |
|
Market growth 2025-2029 |
USD 10234.5 million |
|
Market structure |
Fragmented |
|
YoY growth 2024-2025(%) |
6.2 |
|
Key countries |
US, Japan, India, China, Germany, South Korea, UK, Australia, France, and Italy |
|
Competitive landscape |
Leading Companies, Market Positioning of Companies, Competitive Strategies, and Industry Risks |
Why Choose Technavio for Combined Heat And Power (CHP) Market Insights?
"Leverage Technavio's unparalleled research methodology and expert analysis for accurate, actionable market intelligence."
The market is experiencing significant growth due to the increasing demand for efficient and sustainable energy solutions. CHP plants, which generate thermal energy and electricity simultaneously, offer numerous benefits, including emission reduction potential, improved system efficiency, and economic feasibility in various sectors. Integration of thermal energy storage systems and renewable energy sources in CHP plants is a key trend, enhancing system performance and resilience. Optimization strategies, such as load following and advanced control algorithms, are essential for maximizing CHP system efficiency and reducing lifecycle costs. The economic feasibility of CHP systems varies depending on the specific technology and application. Gas turbine CHP systems, for instance, offer high efficiency but may have higher capital costs compared to other technologies.
Emission reduction potential is another critical factor, with various CHP systems delivering significant reductions in greenhouse gas emissions. Design and operation of CHP systems must consider factors like load following and demand response to ensure optimal performance. Implementing advanced control systems and automation technologies can help reduce system downtime and improve overall efficiency. Integration of CHP systems with smart grid infrastructure is a growing trend, enabling better grid stability and enhancing system flexibility. Assessing the environmental impact of CHP systems and implementing methods for emissions reduction is essential for ensuring sustainability. Waste heat recovery is a crucial aspect of CHP system design, with high-efficiency components and advanced modeling and simulation techniques playing a significant role in improving overall system performance. Lifecycle cost assessment of different CHP technologies and optimal sizing for various applications are essential considerations for businesses and organizations looking to invest in this technology.
What are the Key Data Covered in this Combined Heat And Power (CHP) Market Research and Growth Report?
-
What is the expected growth of the Combined Heat And Power (CHP) Market between 2025 and 2029?
-
USD 10.23 billion, at a CAGR of 6.5%
-
-
What segmentation does the market report cover?
-
The report is segmented by Product (Natural gas, Coal, and Others), End-user (Industrial, Commercial, and Residential), Technology (Reciprocating engine, Steam turbine, and Gas turbine), and Geography (APAC, Europe, North America, South America, and Middle East and Africa)
-
-
Which regions are analyzed in the report?
-
APAC, Europe, North America, South America, and Middle East and Africa
-
-
What are the key growth drivers and market challenges?
-
Increase in consumption of energy globally, High cost associated with combined heat and power units
-
-
Who are the major players in the Combined Heat And Power (CHP) Market?
-
2G Energy AG, ABB Ltd., Ameresco Inc., Capstone Green Energy Corp., Caterpillar Inc., Cummins Inc., FuelCell Energy Inc., General Electric Co., Helec Ltd., HoSt Holding B.V., Kawasaki Heavy Industries Ltd., Kraft Power Corp., MAN Energy Solutions SE, Mitsubishi Heavy Industries Ltd., MTT bv, Robert Bosch GmbH, Rolls Royce Holdings Plc, Siemens Energy AG, Veolia Environnement SA, and Wartsila Corp.
-
We can help! Our analysts can customize this combined heat and power (CHP) market research report to meet your requirements.
 RIA -
RIA - 
