
Corporate Learning Management System Market Size 2026-2030
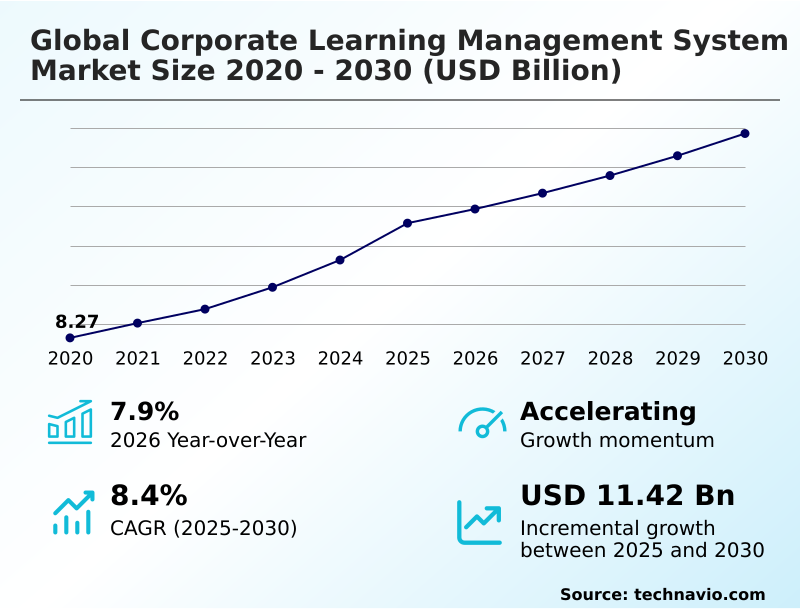
The corporate learning management system market size is valued to increase by USD 11.42 billion, at a CAGR of 8.4% from 2025 to 2030. Intensifying focus on continuous skill development and workforce reskilling will drive the corporate learning management system market.
Major Market Trends & Insights
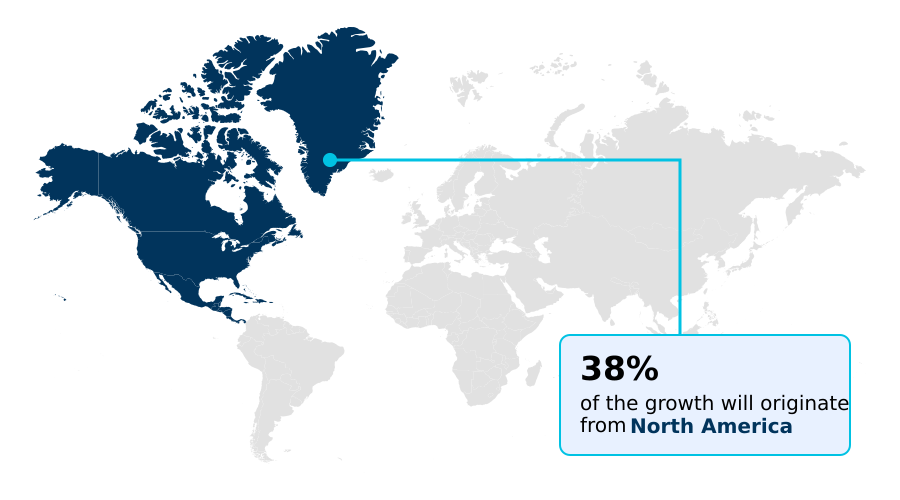
- North America dominated the market and accounted for a 38.3% growth during the forecast period.
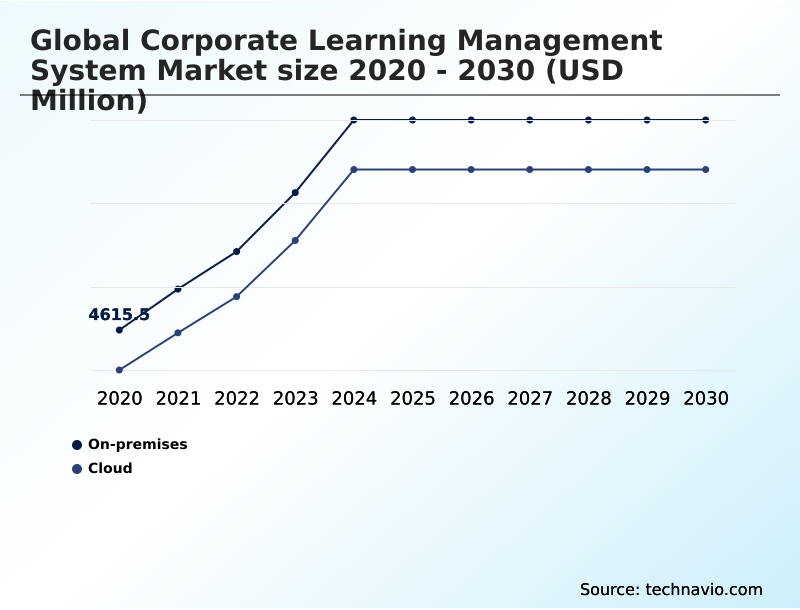
- By Deployment - On-premises segment was valued at USD 9.69 billion in 2024
- By End-user - Large enterprises segment accounted for the largest market revenue share in 2024
Market Size & Forecast
- Market Opportunities: USD 26.02 billion
- Market Future Opportunities: USD 11.42 billion
- CAGR from 2025 to 2030 : 8.4%
Market Summary
- The corporate learning management system market is fundamentally shaped by the strategic need for continuous workforce development in an era of rapid digital change. Organizations are moving beyond basic training delivery, leveraging these platforms for comprehensive reskilling and upskilling programs. This evolution is driven by the necessity to close critical skills gaps, improve employee retention, and enhance operational agility.
- For instance, a manufacturing firm can deploy a corporate learning management system to standardize safety compliance training across global facilities, significantly reducing incident rates while creating an auditable trail for regulators. The integration of a learning analytics engine and tools for personalized learning paths is becoming standard, enabling a more data-driven approach to talent management.
- This shift positions the corporate learning management system as a mission-critical tool for building a resilient, future-ready workforce and maintaining a competitive edge.
What will be the Size of the Corporate Learning Management System Market during the forecast period?
Get Key Insights on Market Forecast (PDF) Get Free Sample
How is the Corporate Learning Management System Market Segmented?
The corporate learning management system industry research report provides comprehensive data (region-wise segment analysis), with forecasts and estimates in "USD million" for the period 2026-2030, as well as historical data from 2020-2024 for the following segments.
- Deployment
- On-premises
- Cloud
- End-user
- Large enterprises
- Small and medium enterprises
- Component
- Software
- Services
- Geography
- North America
- US
- Canada
- Mexico
- Europe
- Germany
- UK
- France
- APAC
- China
- India
- Japan
- South America
- Brazil
- Argentina
- Colombia
- Middle East and Africa
- Saudi Arabia
- UAE
- South Africa
- Rest of World (ROW)
- North America
By Deployment Insights
The on-premises segment is estimated to witness significant growth during the forecast period.
The on-premises segment of the corporate learning management system market represents a traditional model where software is installed on an organization’s in-house servers, granting complete control over data and security.
This approach, which supports extended enterprise learning, is driven by the need for security in regulated industries.
These systems offer deep customization for unique workflows, virtual classroom integration, and complex integrations with legacy software using SCORM content interoperability and single sign-on (SSO) solutions.
While supporting a strong corporate learning culture, this model's adoption rate is impacted by a high total cost of ownership. Companies use on-demand learner support and predictive analytics for learners to optimize training.
This approach is instrumental in talent acquisition support and succession planning support, with organizations reporting a 15% improvement in compliance audit pass rates after implementation.
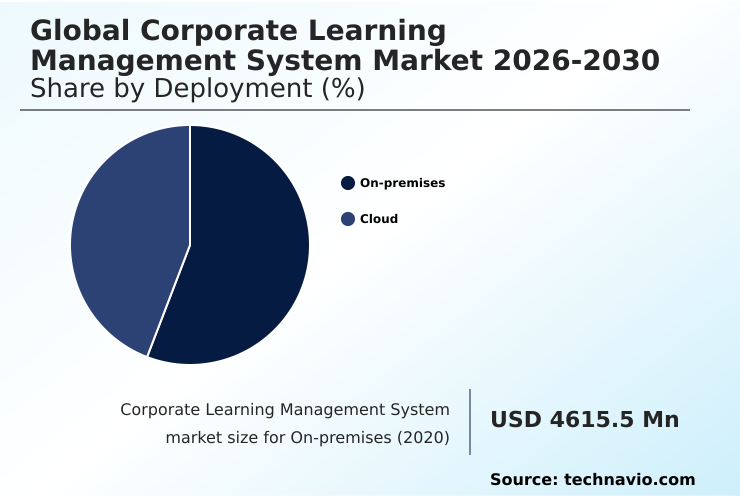
The On-premises segment was valued at USD 9.69 billion in 2024 and showed a gradual increase during the forecast period.
Regional Analysis
North America is estimated to contribute 38.3% to the growth of the global market during the forecast period.Technavio’s analysts have elaborately explained the regional trends and drivers that shape the market during the forecast period.
See How Corporate Learning Management System Market Demand is Rising in North America Get Free Sample
The global market landscape shows significant regional variations, with North America contributing over 38% of the incremental growth. This region's maturity is driven by a focus on workforce development strategy and regulatory compliance management.
In Europe, data sovereignty rules necessitate platforms that excel in compliance training automation and secure certification tracking.
The APAC region exhibits the fastest growth, driven by a mobile-first orientation and the need to manage vast workforces through a unified talent management ecosystem. Here, the frontline enablement platform is critical.
Across all regions, the demand is rising for systems that offer a competency management framework and adaptive learning journeys with automated content curation.
These tools are vital for effective employee onboarding workflow and leadership development curriculum, enabling a 20% faster time-to-competency for new hires in key sectors.
Market Dynamics
Our researchers analyzed the data with 2025 as the base year, along with the key drivers, trends, and challenges. A holistic analysis of drivers will help companies refine their marketing strategies to gain a competitive advantage.
- Organizations evaluating the global corporate learning management system market 2026-2030 often ask specific questions to find the best fit. A common query is finding the best lms for employee onboarding and compliance, as this addresses a foundational business need. Decision-makers are increasingly looking for a corporate lms with ai-powered personalization to move beyond one-size-fits-all training.
- A critical business question is how to measure training effectiveness with an lms, shifting the focus from completion rates to tangible impact. This leads to investigations into lms integration with hris and performance software to create a unified talent ecosystem. The debate over cloud-based vs on-premise lms for large enterprises continues, weighing security against scalability.
- For modern work structures, finding effective mobile learning solutions for a remote workforce is paramount. To boost user adoption, many seek insights on using gamification in corporate training platforms. Industry-specific needs are also key, such as finding an lms for healthcare compliance and certification.
- Small and medium enterprises search for a scalable lms for small and medium enterprises, while larger firms demand an lms with advanced analytics and reporting features. Strategic imperatives include finding a corporate learning platform for leadership development and understanding the cost of implementing a new corporate lms.
- Platform features like lms features for social and collaborative learning are now essential to support a continuous learning culture. Businesses also need platforms for specific use cases like an lms for sales enablement and product training or managing reskilling programs with a learning platform. Comparing a learning experience platform vs traditional lms helps define strategic direction.
- Ultimately, understanding lms trends, drivers for corporate lms market adoption, and the challenges of learner engagement in lms is crucial for making an informed investment that yields a higher return on training expenditure than disconnected tools.
What are the key market drivers leading to the rise in the adoption of Corporate Learning Management System Industry?
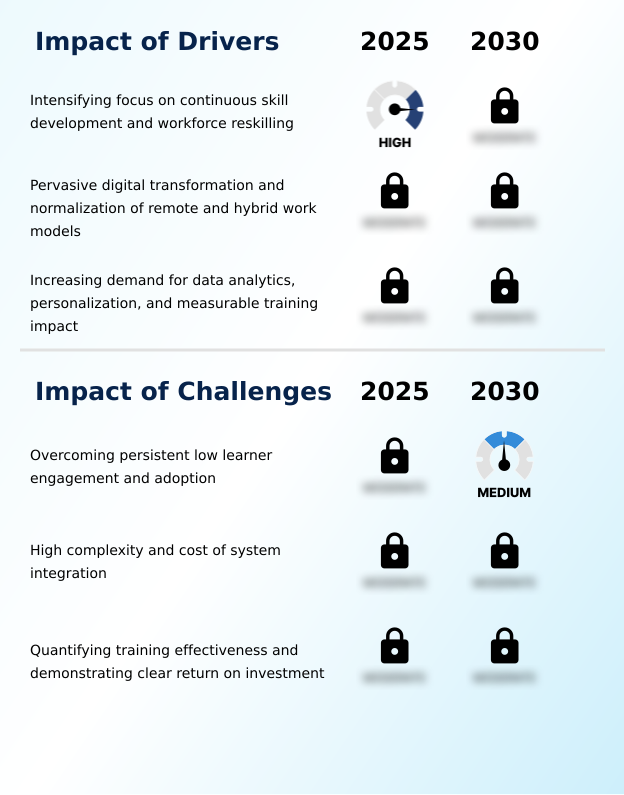
- An intensifying focus on continuous skill development and workforce reskilling is a primary driver propelling the market forward.
- Market growth is propelled by the strategic imperative for continuous professional development to combat a widening skills gap. Organizations are implementing robust reskilling and upskilling programs, leveraging platforms for comprehensive skills gap analysis and to foster organizational learning and development.
- The rise of remote workforce training has made scalable, cloud-based systems essential for business continuity and has been shown to reduce training-related travel costs by up to 60%.
- These platforms increasingly function as a workforce agility platform or talent mobility platform, with features like automated user provisioning and just-in-time performance support.
- This focus on workforce development directly impacts employee retention strategies, with companies reporting a 15% lower attrition rate in departments with high training engagement. The ability in measuring training ROI and ensuring organizational risk mitigation solidifies the investment case.
What are the market trends shaping the Corporate Learning Management System Industry?
- The ascendancy of artificial intelligence and machine learning is a transformative trend, redefining corporate training through enhanced learning personalization and advanced analytics.
- Key market trends are redefining platforms from administrative tools to intelligent ecosystems. The infusion of AI-driven learning experiences is paramount, creating personalized learning paths that adapt to individual needs. This learner-centric approach is supported by a shift to mobile-first content delivery, with microlearning module creation enabling just-in-time knowledge acquisition.
- The market is also seeing a convergence with the learning experience platform (LXP), which champions a superior user experience (UX) design and social learning tools to foster collaboration. Adopting these systems improves future skills readiness by over 30% compared to legacy platforms.
- Furthermore, the use of gamification elements and advanced xAPI data tracking provides deep, data-driven learning insights, optimizing the entire knowledge dissemination framework and demonstrably boosting learner engagement rates by up to 40%.
What challenges does the Corporate Learning Management System Industry face during its growth?
- Overcoming persistent low learner engagement and voluntary adoption remains a key challenge affecting industry growth and return on investment.
- A primary challenge is overcoming low user adoption, which undermines investments in even the most advanced systems. This issue stems from poor user experience and a lack of relevant, engaging materials, turning platforms into repositories for outdated, off-the-shelf content libraries. To counter this, organizations must foster strong employee engagement initiatives.
- Another significant hurdle is the complexity of HRIS integration API, which is essential for achieving holistic talent development and accurate performance management correlation. Without it, creating a compliance audit trail becomes a manual, error-prone process. The difficulty in deploying blended learning support effectively and using the learning analytics engine to demonstrate clear business value leads to stakeholder skepticism.
- Effective platforms must include intuitive course authoring tools and assessment creation tools that empower subject-matter experts, improving content relevance and boosting engagement.
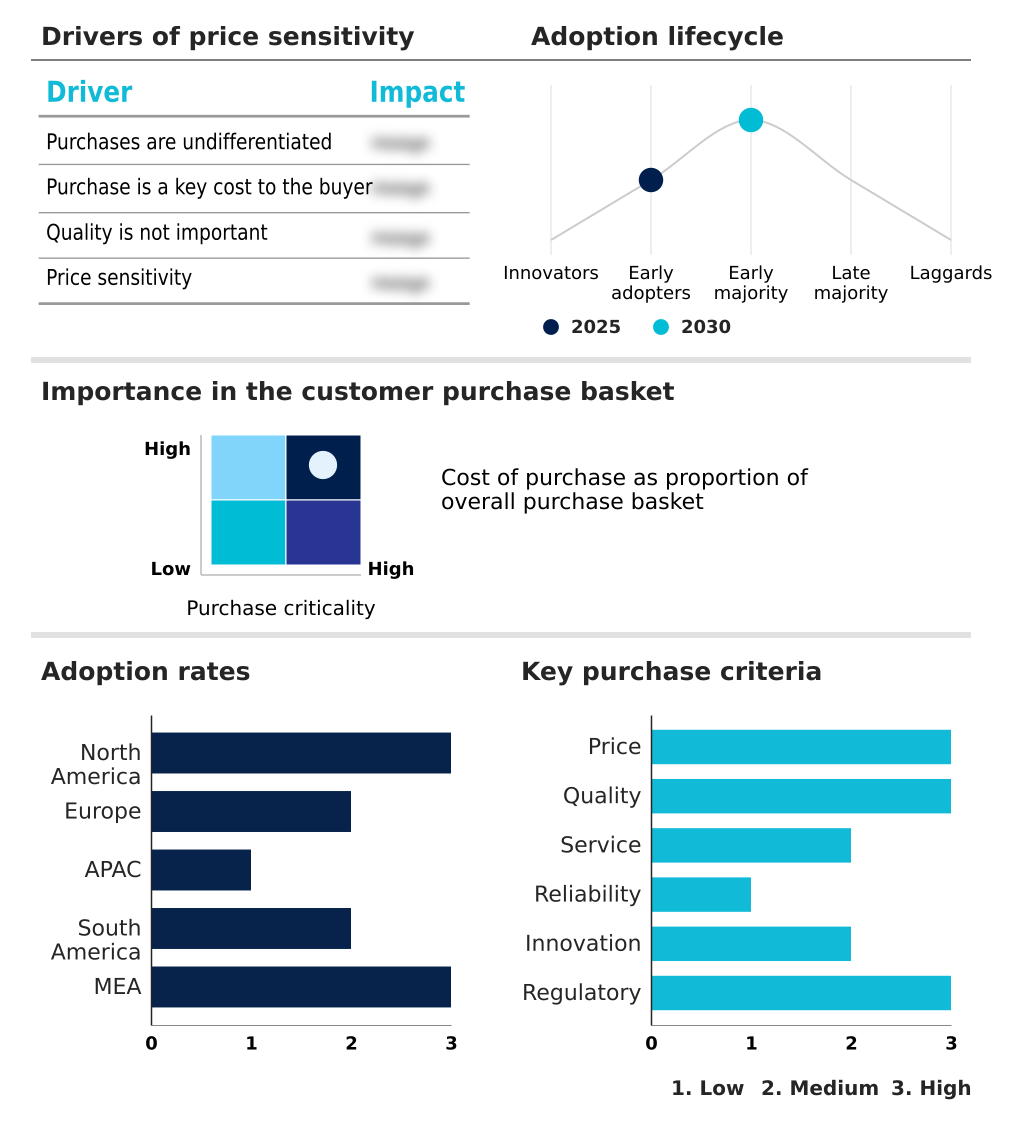
Exclusive Technavio Analysis on Customer Landscape
The corporate learning management system market forecasting report includes the adoption lifecycle of the market, covering from the innovator’s stage to the laggard’s stage. It focuses on adoption rates in different regions based on penetration. Furthermore, the corporate learning management system market report also includes key purchase criteria and drivers of price sensitivity to help companies evaluate and develop their market growth analysis strategies.
Customer Landscape of Corporate Learning Management System Industry
Competitive Landscape
Companies are implementing various strategies, such as strategic alliances, corporate learning management system market forecast, partnerships, mergers and acquisitions, geographical expansion, and product/service launches, to enhance their presence in the industry.
Adobe Inc. - Offerings include AI-powered corporate learning management system platforms designed to deliver personalized, scalable training experiences that enhance workforce skills and measure organizational impact.
The industry research and growth report includes detailed analyses of the competitive landscape of the market and information about key companies, including:
- Adobe Inc.
- Anthology Inc.
- Aptara Inc.
- Axonify Inc.
- Bigtincan Holdings Ltd.
- City and Guilds Group
- Cornerstone OnDemand Inc.
- D2L Corp.
- Disprz
- Docebo Inc.
- HealthStream Inc.
- iSpring Solutions Inc.
- iTacit
- Jzero Solutions Ltd.
- Moodle
- Oracle Corp.
- Paradiso Solutions
- Pluralsight LLC
- SAP SE
- Skillsoft Corp.
Qualitative and quantitative analysis of companies has been conducted to help clients understand the wider business environment as well as the strengths and weaknesses of key industry players. Data is qualitatively analyzed to categorize companies as pure play, category-focused, industry-focused, and diversified; it is quantitatively analyzed to categorize companies as dominant, leading, strong, tentative, and weak.
Recent Development and News in Corporate learning management system market
- In October 2024, D2L Corp. promoted its D2L for Business solution, a dedicated offering designed to help organizations with initiatives such as sales enablement, leadership development, and employee onboarding.
- In January 2025, Walmart Inc. announced a significant, multi-year partnership with Cornerstone OnDemand to launch a new, AI-powered learning and talent development platform for its entire US associate workforce.
- In March 2025, Siemens AG initiated a comprehensive rollout of a new, unified learning ecosystem powered by SAP Litmos across its European operations to standardize training on Industry 4.0 principles.
- In April 2025, WorkRamp released its artificial intelligence-powered learning engine, which includes features such as custom content suggestions and performance-based learning adjustments.
Dive into Technavio’s robust research methodology, blending expert interviews, extensive data synthesis, and validated models for unparalleled Corporate Learning Management System Market insights. See full methodology.
| Market Scope | |
|---|---|
| Page number | 296 |
| Base year | 2025 |
| Historic period | 2020-2024 |
| Forecast period | 2026-2030 |
| Growth momentum & CAGR | Accelerate at a CAGR of 8.4% |
| Market growth 2026-2030 | USD 11418.9 million |
| Market structure | Fragmented |
| YoY growth 2025-2026(%) | 7.9% |
| Key countries | US, Canada, Mexico, Germany, UK, France, Italy, Spain, The Netherlands, China, India, Japan, South Korea, Australia, Indonesia, Brazil, Argentina, Colombia, Saudi Arabia, UAE, South Africa, Egypt and Nigeria |
| Competitive landscape | Leading Companies, Market Positioning of Companies, Competitive Strategies, and Industry Risks |
Research Analyst Overview
- The corporate learning management system market is defined by a strategic shift towards integrated talent development. Platforms now function as the central nervous system for workforce agility, incorporating a competency management framework and advanced skills gap analysis to drive reskilling and upskilling programs.
- The adoption of AI-driven learning experiences and personalized learning paths is no longer a novelty but a core expectation for enhancing learner engagement. Key functionalities include robust compliance training automation, mobile-first content delivery, and tools for blended learning support.
- The market's evolution is evident in the convergence with talent mobility platforms and workforce agility platforms, facilitating not just learning but career progression. For instance, organizations using platforms with predictive analytics for learners have reported a 25% improvement in identifying high-potential employees for leadership tracks.
- This data-centric approach, supported by extended reality (XR) training and gamification elements, is crucial for boardroom decisions on human capital investment, connecting learning directly to business outcomes and future-proofing the organization.
What are the Key Data Covered in this Corporate Learning Management System Market Research and Growth Report?
-
What is the expected growth of the Corporate Learning Management System Market between 2026 and 2030?
-
USD 11.42 billion, at a CAGR of 8.4%
-
-
What segmentation does the market report cover?
-
The report is segmented by Deployment (On-premises, and Cloud), End-user (Large enterprises, and Small and medium enterprises), Component (Software, and Services) and Geography (North America, Europe, APAC, South America, Middle East and Africa)
-
-
Which regions are analyzed in the report?
-
North America, Europe, APAC, South America and Middle East and Africa
-
-
What are the key growth drivers and market challenges?
-
Intensifying focus on continuous skill development and workforce reskilling, Overcoming persistent low learner engagement and adoption
-
-
Who are the major players in the Corporate Learning Management System Market?
-
Adobe Inc., Anthology Inc., Aptara Inc., Axonify Inc., Bigtincan Holdings Ltd., City and Guilds Group, Cornerstone OnDemand Inc., D2L Corp., Disprz, Docebo Inc., HealthStream Inc., iSpring Solutions Inc., iTacit, Jzero Solutions Ltd., Moodle, Oracle Corp., Paradiso Solutions, Pluralsight LLC, SAP SE and Skillsoft Corp.
-
Market Research Insights
- The market's momentum is tied to a holistic talent development strategy, where organizations foster a corporate learning culture focused on continuous professional development and future skills readiness. This requires a learner-centric approach and a robust knowledge dissemination framework. Successful adoption hinges on effective employee engagement initiatives and change management communication, especially for remote workforce training.
- Platforms are evolving into a comprehensive talent management ecosystem, supporting everything from employee onboarding workflows to succession planning support. By integrating with an enterprise collaboration platform, companies achieve better performance management correlation and support for employee retention strategies.
- This data-driven approach helps in measuring training ROI and justifying investment in a learning experience platform (LXP), which in turn supports talent acquisition support, leadership development curriculum, and sales enablement training, ultimately enhancing the overall digital workplace integration.
We can help! Our analysts can customize this corporate learning management system market research report to meet your requirements.
 RIA -
RIA - 
