Courier Pickup And Delivery Services Market Analysis, Size, and Forecast 2026-2030: APAC (China, Japan, and India), North America (US, Canada, and Mexico), Europe (Germany, UK, and France), Middle East and Africa (Saudi Arabia, UAE, and South Africa), South America (Brazil and Argentina), and Rest of World (ROW)

Courier Pickup And Delivery Services Market Analysis, Size, and Forecast 2026-2030:
APAC (China, Japan, and India), North America (US, Canada, and Mexico), Europe (Germany, UK, and France), Middle East and Africa (Saudi Arabia, UAE, and South Africa), South America (Brazil and Argentina), and Rest of World (ROW)

Published: Dec 2025 286 Pages SKU: IRTNTR80155

Market Overview at a Glance

$93.09 B
Market Opportunity
7.3%
CAGR 2025 - 2030
41.4%
APAC Growth
$133.65 B
International segment 2024

Courier Pickup And Delivery Services Market Size 2026-2030

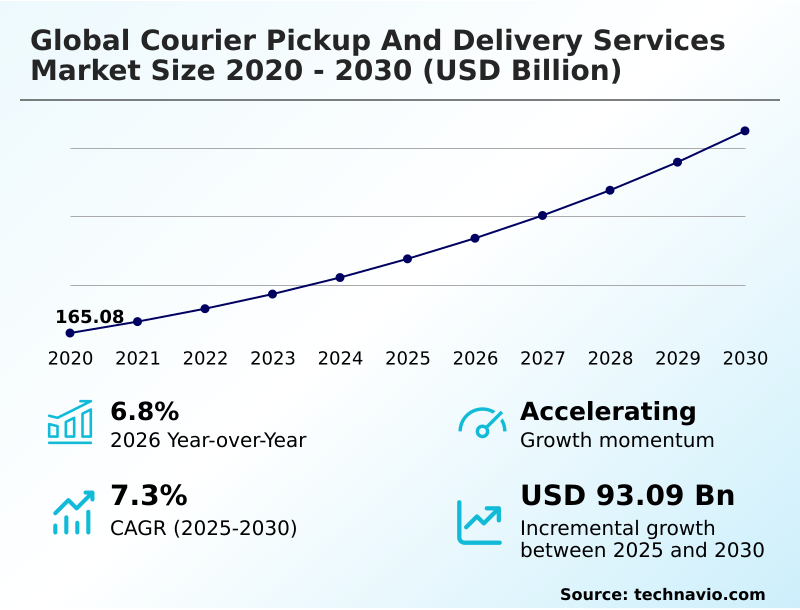
The courier pickup and delivery services market size is valued to increase by USD 93.09 billion, at a CAGR of 7.3% from 2025 to 2030. Rapid proliferation of cross-border electronic commerce will drive the courier pickup and delivery services market.

Major Market Trends & Insights

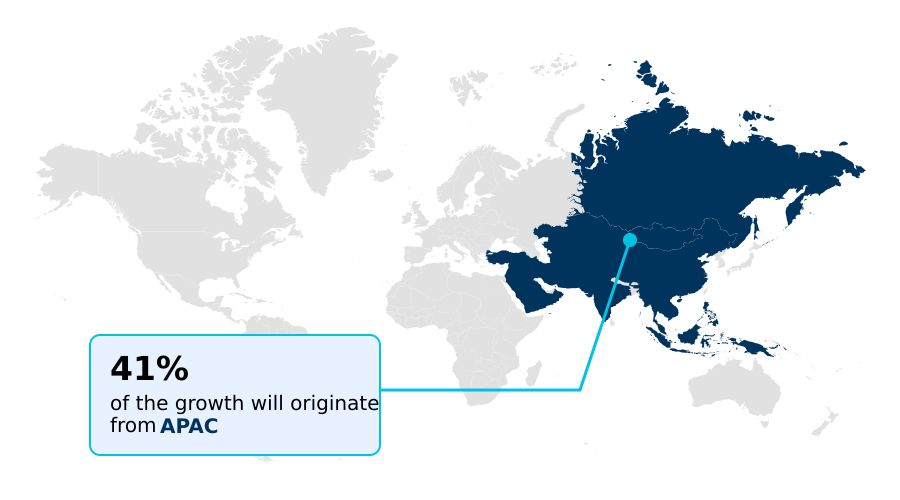
  • APAC dominated the market and accounted for a 41.4% growth during the forecast period.
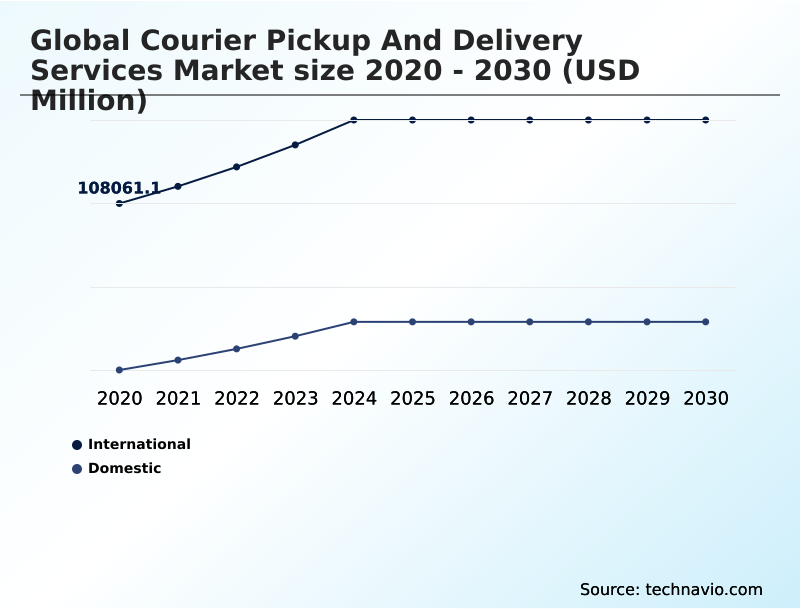
  • By Type - International segment was valued at USD 133.65 billion in 2024
  • By Consumer - Business to business segment accounted for the largest market revenue share in 2024

Market Size & Forecast

  • Market Opportunities: USD 147.04 billion
  • Market Future Opportunities: USD 93.09 billion
  • CAGR from 2025 to 2030 : 7.3%

Market Summary

  • The courier pickup and delivery services market is undergoing a significant transformation, driven by the convergence of technological innovation and evolving consumer expectations. Core to this market is the efficient management of both B2B logistics and B2C logistics, where speed and reliability are paramount.
  • The boom in direct-to-consumer sales necessitates advanced e-commerce fulfillment capabilities, including sophisticated route optimization and real-time tracking. A key business scenario involves a retailer using an integrated supply chain to manage inventory across multiple channels, relying on express courier services for rapid replenishment and last-mile delivery to consumers.
  • Providers are focused on network optimization to improve delivery density and reduce operational expenditures. Challenges such as last-mile inefficiencies and the need for sustainable, carbon-neutral shipping solutions are compelling investment in electric vehicle fleets and alternative delivery models like smart parcel lockers, fundamentally altering the competitive landscape.

What will be the Size of the Courier Pickup And Delivery Services Market during the forecast period?

Get Key Insights on Market Forecast (PDF) Request Free Sample

How is the Courier Pickup And Delivery Services Market Segmented?

The courier pickup and delivery services industry research report provides comprehensive data (region-wise segment analysis), with forecasts and estimates in "USD million" for the period 2026-2030, as well as historical data from 2020-2024 for the following segments.

  • Type
    • International
    • Domestic
  • Consumer
    • Business to business
    • Business to customer
    • Customer to customer
  • Mode of transportation
    • Ground transportation
    • Air transportation
    • Sea transportation
  • Geography
    • APAC
      • China
      • Japan
      • India
    • North America
      • US
      • Canada
      • Mexico
    • Europe
      • Germany
      • UK
      • France
    • Middle East and Africa
      • Saudi Arabia
      • UAE
      • South Africa
    • South America
      • Brazil
      • Argentina
    • Rest of World (ROW)

By Type Insights

The international segment is estimated to witness significant growth during the forecast period.

The international segment facilitates the movement of goods across borders, driven by the expansion of cross-border e-commerce. This requires sophisticated, parcel-centric networks integrating multimodal transport to ensure seamless door-to-door transportation.

Providers manage complex regulatory hurdles, including customs clearance and tariff compliance, offering freight forwarding and time-definite delivery for both B2B logistics and direct-to-consumer e-commerce fulfillment. The focus is on cross-border trade facilitation, especially for time-sensitive shipments like high-value industrial components.

A robust logistics network is critical, with leading operators reporting that advanced digital platforms have improved on-time delivery for international parcels by over 12%, ensuring reliability in complex global supply chains.

Request Free Sample

The International segment was valued at USD 133.65 billion in 2024 and showed a gradual increase during the forecast period.

Request Free Sample

Regional Analysis

APAC is estimated to contribute 41.4% to the growth of the global market during the forecast period.Technavio’s analysts have elaborately explained the regional trends and drivers that shape the market during the forecast period.

See How Courier Pickup And Delivery Services Market Demand is Rising in APAC Request Free Sample

The geographic landscape is defined by high-volume corridors in APAC and North America, with APAC alone accounting for over 41% of the incremental growth opportunity. In dense urban centers across Europe and Asia, network optimization is paramount.

Operators are leveraging urban consolidation centers and ground transportation networks that include cargo bikes to improve delivery density.

The expansion of B2C logistics and C2C shipping is driving massive investment in parcel processing capacity, with high-speed conveyor systems boosting hub efficiency by over 30%.

In emerging regions, the development of the core logistics network is a priority, while mature markets are piloting autonomous delivery vehicles and drones to solve last-mile challenges, often supplemented by gig economy logistics for flexible capacity.

Market Dynamics

Our researchers analyzed the data with 2025 as the base year, along with the key drivers, trends, and challenges. A holistic analysis of drivers will help companies refine their marketing strategies to gain a competitive advantage.

  • Strategic decisions in the courier pickup and delivery services market are increasingly focused on nuanced operational challenges. The impact of nearshoring on B2B logistics is compelling providers to enhance services for high-value industrial components, where security measures are paramount.
  • Simultaneously, optimizing reverse logistics for e-commerce returns has become a competitive differentiator, with solutions for integrating real-time tracking for B2C logistics at the forefront. The cost-benefit of one network model consolidation is being weighed against the flexibility of specialized networks.
  • Last-mile delivery challenges in urban areas are being addressed through a mix of technology, such as AI for dynamic route optimization, and infrastructure like smart parcel lockers versus PUDO point networks. Integrating label-less QR code returns can reduce processing times by more than half compared to traditional methods.
  • Firms are leveraging the gig economy for peak season delivery and adopting franchise models in domestic courier services to expand reach cost-effectively. Managing operational costs with fuel surcharges and understanding the impact of delivery area surcharges on shipping costs are constant financial pressures.
  • Key initiatives include improving last-mile delivery density, automating customs clearance for international parcels, and ensuring sustainability in ground transportation networks. The efficiency gains from automated sorting hubs are clear, but require significant capital, forcing a strategic evaluation of investment priorities.

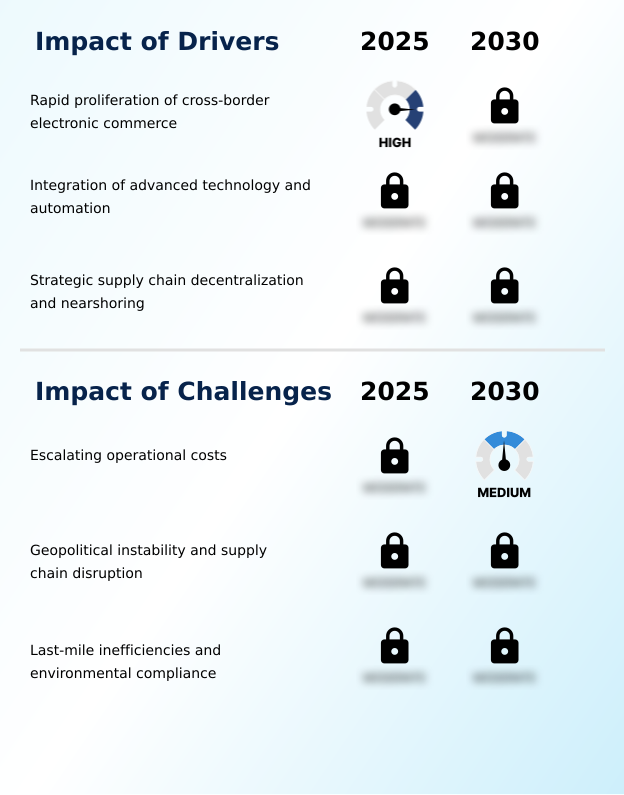
What are the key market drivers leading to the rise in the adoption of Courier Pickup And Delivery Services Industry?

  • The rapid proliferation of cross-border electronic commerce is a key driver fueling market expansion.

  • The market's primary driver is the growth in direct-to-consumer (D2C) e-commerce, which demands a highly integrated supply chain.
  • This is complemented by supply chain decentralization, as the trend of nearshoring generates new demand for express courier services to support just-in-time manufacturing.
  • Technology is a critical enabler, with AI algorithms for route optimization reducing fuel costs by up to 18%. Automated fulfillment centers now offer real-time tracking and flexible delivery windows, key components of modern supply chain services.
  • The rise of on-demand delivery platforms further accelerates the need for efficient e-commerce fulfillment and agile logistics networks to meet evolving consumer expectations.

What are the market trends shaping the Courier Pickup And Delivery Services Industry?

  • A dominant trend is the expansion of out-of-home delivery ecosystems. This includes the proliferation of smart parcel lockers and designated pick-up drop-off points.

  • Market trends are reshaping operational models, with a significant shift toward out-of-home (OOH) delivery. The expansion of smart parcel lockers and PUDO points through agnostic partnerships enhances urban logistics solutions, improving drop density by 25%. This strategy directly addresses inefficiencies in residential delivery.
  • Concurrently, the consolidation into a one network model is improving asset utilization by over 15%, merging express and ground services. Furthermore, the optimization of reverse logistics is critical, driven by the growth of circular economy logistics and re-commerce platforms. This focus on peer-to-peer marketplaces is compelling providers to enhance their last-mile pickup capabilities to manage returns more efficiently.

What challenges does the Courier Pickup And Delivery Services Industry face during its growth?

  • Escalating operational costs, driven by fuel price volatility and labor shortages, present a key challenge impacting industry growth.

  • Significant challenges confront the market, led by escalating operational expenditures and last-mile inefficiencies. Volatile fuel prices necessitate frequent adjustments to fuel surcharges, while labor costs contribute to the implementation of a general rate increase across services. Geopolitical instability disrupts linehaul trucking and regional distribution, requiring enhanced customs brokerage expertise.
  • Furthermore, delivery area surcharges are used to offset the high cost of servicing less dense areas. The push for carbon-neutral shipping and compliance with zero emission zones mandates substantial investment in new logistics infrastructure, straining capital resources. Finding viable last-mile driver solutions remains a persistent challenge, impacting both cost and service reliability.

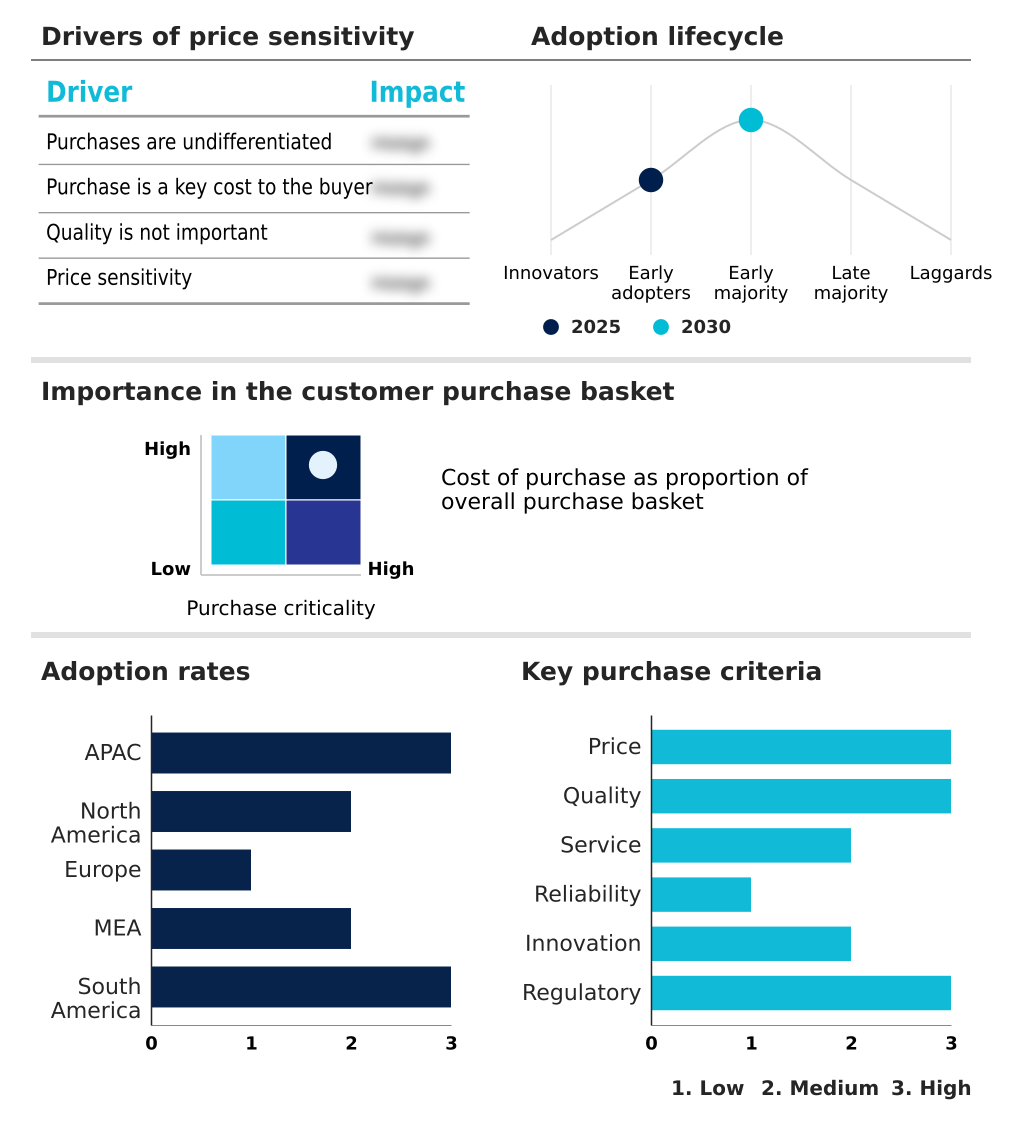
Exclusive Technavio Analysis on Customer Landscape

The courier pickup and delivery services market forecasting report includes the adoption lifecycle of the market, covering from the innovator’s stage to the laggard’s stage. It focuses on adoption rates in different regions based on penetration. Furthermore, the courier pickup and delivery services market report also includes key purchase criteria and drivers of price sensitivity to help companies evaluate and develop their market growth analysis strategies.

Customer Landscape of Courier Pickup And Delivery Services Industry

Competitive Landscape

Companies are implementing various strategies, such as strategic alliances, courier pickup and delivery services market forecast, partnerships, mergers and acquisitions, geographical expansion, and product/service launches, to enhance their presence in the industry.

Aramex International LLC - Specialized logistics, including temperature-controlled transport and high-value component delivery, define key service offerings, prioritizing reliability for complex B2B supply chains.

The industry research and growth report includes detailed analyses of the competitive landscape of the market and information about key companies, including:

  • Aramex International LLC
  • Asendia Management SAS
  • BEST Inc.
  • Blue Dart Express Ltd.
  • CJ Logistics Corp.
  • Colissimo
  • Delhivery Ltd.
  • DPD Deutschland GmbH
  • DTDC Express Ltd.
  • FedEx Corp.
  • J and T Global Express Ltd.
  • Ninja Van Group
  • PostNL N.V.
  • SF Express Co. Ltd.
  • STO Express Co. Ltd.
  • United Parcel Service Inc.
  • YunExpress
  • ZTO Express Cayman Inc.

Qualitative and quantitative analysis of companies has been conducted to help clients understand the wider business environment as well as the strengths and weaknesses of key industry players. Data is qualitatively analyzed to categorize companies as pure play, category-focused, industry-focused, and diversified; it is quantitatively analyzed to categorize companies as dominant, leading, strong, tentative, and weak.

Recent Development and News in Courier pickup and delivery services market

  • In September 2024, Amazon.com Inc. launched Supply Chain by Amazon, a fully automated set of supply chain services allowing sellers to use its advanced logistics network for product distribution.
  • In October 2024, Uber Technologies Inc. launched a 'Return a Package' feature, allowing users to dispatch a courier to collect prepaid return packages, thereby integrating gig-economy models into reverse logistics.
  • In January 2025, FedEx Corp. implemented a General Rate Increase (GRI) averaging 5.9% for its U.S. domestic, export, and import services to offset inflationary pressures and fund network modernization.
  • In March 2025, United Parcel Service Inc. implemented an average net rate increase of 5.9% for its ground, air, and international services to support ongoing modernization efforts and digital infrastructure upgrades.

Dive into Technavio’s robust research methodology, blending expert interviews, extensive data synthesis, and validated models for unparalleled Courier Pickup And Delivery Services Market insights. See full methodology.

Market Scope
Page number 286
Base year 2025
Historic period 2020-2024
Forecast period 2026-2030
Growth momentum & CAGR Accelerate at a CAGR of 7.3%
Market growth 2026-2030 USD 93090.9 million
Market structure Fragmented
YoY growth 2025-2026(%) 6.8%
Key countries China, Japan, India, Indonesia, South Korea, Australia, US, Canada, Mexico, Germany, UK, France, Italy, Spain, The Netherlands, Saudi Arabia, UAE, South Africa, Israel, Turkey, Brazil, Argentina and Chile
Competitive landscape Leading Companies, Market Positioning of Companies, Competitive Strategies, and Industry Risks

Request Free Sample

Research Analyst Overview

  • The courier pickup and delivery services market is defined by a strategic push toward network optimization to combat escalating operational expenditures. Providers are consolidating into a one network model to improve asset utilization and delivery density, while simultaneously managing fuel surcharges and implementing a general rate increase to maintain profitability.
  • The growth of cross-border e-commerce necessitates robust freight forwarding and efficient customs clearance, supported by parcel-centric networks using multimodal transport. In response to supply chain decentralization and nearshoring, a focus on B2B logistics and time-definite delivery for high-value components is crucial.
  • Boardroom decisions now center on balancing investment in automated sorting hubs, high-speed conveyor systems, and dynamic route optimization with the high costs of last-mile inefficiencies. The expansion of out-of-home delivery via smart parcel lockers and PUDO points helps mitigate delivery area surcharges.
  • Furthermore, the rise of the circular economy is driving innovation in reverse logistics, with label-less QR code returns improving processing times by 40%. The shift toward temperature-controlled and cold-chain logistics for specialized sectors and compliance with zero emission zones through autonomous delivery vehicles are reshaping long-term capital strategy.
  • This complex interplay of cost, technology, and service, including B2C logistics and C2C shipping, dictates market positioning.

What are the Key Data Covered in this Courier Pickup And Delivery Services Market Research and Growth Report?

  • What is the expected growth of the Courier Pickup And Delivery Services Market between 2026 and 2030?

    • USD 93.09 billion, at a CAGR of 7.3%

  • What segmentation does the market report cover?

    • The report is segmented by Type (International, and Domestic), Consumer (Business to business, Business to customer, and Customer to customer), Mode of Transportation (Ground transportation, Air transportation, and Sea transportation) and Geography (APAC, North America, Europe, Middle East and Africa, South America)

  • Which regions are analyzed in the report?

    • APAC, North America, Europe, Middle East and Africa and South America

  • What are the key growth drivers and market challenges?

    • Rapid proliferation of cross-border electronic commerce, Escalating operational costs

  • Who are the major players in the Courier Pickup And Delivery Services Market?

    • Aramex International LLC, Asendia Management SAS, BEST Inc., Blue Dart Express Ltd., CJ Logistics Corp., Colissimo, Delhivery Ltd., DPD Deutschland GmbH, DTDC Express Ltd., FedEx Corp., J and T Global Express Ltd., Ninja Van Group, PostNL N.V., SF Express Co. Ltd., STO Express Co. Ltd., United Parcel Service Inc., YunExpress and ZTO Express Cayman Inc.

Market Research Insights

  • The market's dynamism is driven by the demand for sophisticated supply chain services and integrated, on-demand delivery platforms. The expansion of gig economy logistics and crowdsourced delivery models offers flexible capacity, with some platforms reporting a 20% faster response time for last-mile pickup capabilities during peak demand.
  • E-commerce fulfillment providers are forming agnostic partnerships to expand their logistics network, leveraging urban consolidation centers to enhance regional distribution. Investment in logistics infrastructure for real-time tracking and flexible delivery windows is now standard. AI-driven urban logistics solutions are demonstrating the ability to reduce route redundancies by up to 15%, directly impacting operational costs for door-to-door transportation.
  • This focus on technology-led efficiency and network agility is critical for managing both automated fulfillment and complex cross-border trade facilitation.

We can help! Our analysts can customize this courier pickup and delivery services market research report to meet your requirements.

Get in touch

1. Executive Summary

1.1 Market overview

Executive Summary - Chart on Market Overview
Executive Summary - Data Table on Market Overview
Executive Summary - Chart on Global Market Characteristics
Executive Summary - Chart on Market by Geography
Executive Summary - Chart on Market Segmentation by Type
Executive Summary - Chart on Market Segmentation by Consumer
Executive Summary - Chart on Market Segmentation by Mode of Transportation
Executive Summary - Chart on Incremental Growth
Executive Summary - Data Table on Incremental Growth
Executive Summary - Chart on Company Market Positioning

2. Technavio Analysis

2.1 Analysis of price sensitivity, lifecycle, customer purchase basket, adoption rates, and purchase criteria

2.2 Criticality of inputs and Factors of differentiation

Chart on Overview on criticality of inputs and factors of differentiation

2.3 Factors of disruption

Chart on Overview on factors of disruption

2.4 Impact of drivers and challenges

Chart on Impact of drivers and challenges in 2025 and 2030

3. Market Landscape

3.1 Market ecosystem

Chart on Parent Market
Data Table on - Parent Market

3.2 Market characteristics

Chart on Market characteristics analysis

3.3 Value chain analysis

Chart on Value chain analysis

4. Market Sizing

4.1 Market definition

Data Table on Offerings of companies included in the market definition

4.2 Market segment analysis

Market segments

4.3 Market size 2025

4.4 Market outlook: Forecast for 2025-2030

Chart on Global - Market size and forecast 2025-2030 ($ million)
Data Table on Global - Market size and forecast 2025-2030 ($ million)
Chart on Global Market: Year-over-year growth 2025-2030 (%)
Data Table on Global Market: Year-over-year growth 2025-2030 (%)

5. Historic Market Size

5.1 Global Courier Pickup And Delivery Services Market 2020 - 2024

Historic Market Size - Data Table on Global Courier Pickup And Delivery Services Market 2020 - 2024 ($ million)

5.2 Type segment analysis 2020 - 2024

Historic Market Size - Type Segment 2020 - 2024 ($ million)

5.3 Consumer segment analysis 2020 - 2024

Historic Market Size - Consumer Segment 2020 - 2024 ($ million)

5.4 Mode of Transportation segment analysis 2020 - 2024

Historic Market Size - Mode of Transportation Segment 2020 - 2024 ($ million)

5.5 Geography segment analysis 2020 - 2024

Historic Market Size - Geography Segment 2020 - 2024 ($ million)

5.6 Country segment analysis 2020 - 2024

Historic Market Size - Country Segment 2020 - 2024 ($ million)

6. Qualitative Analysis

6.1 Impact of AI on global courier pickup and delivery services market

7. Five Forces Analysis

7.1 Five forces summary

Five forces analysis - Comparison between 2025 and 2030

7.2 Bargaining power of buyers

Bargaining power of buyers - Impact of key factors 2025 and 2030

7.3 Bargaining power of suppliers

Bargaining power of suppliers - Impact of key factors in 2025 and 2030

7.4 Threat of new entrants

Threat of new entrants - Impact of key factors in 2025 and 2030

7.5 Threat of substitutes

Threat of substitutes - Impact of key factors in 2025 and 2030

7.6 Threat of rivalry

Threat of rivalry - Impact of key factors in 2025 and 2030

7.7 Market condition

Chart on Market condition - Five forces 2025 and 2030

8. Market Segmentation by Type

8.1 Market segments

Chart on Type - Market share 2025-2030 (%)
Data Table on Type - Market share 2025-2030 (%)

8.2 Comparison by Type

Chart on Comparison by Type
Data Table on Comparison by Type

8.3 International - Market size and forecast 2025-2030

Chart on International - Market size and forecast 2025-2030 ($ million)
Data Table on International - Market size and forecast 2025-2030 ($ million)
Chart on International - Year-over-year growth 2025-2030 (%)
Data Table on International - Year-over-year growth 2025-2030 (%)

8.4 Domestic - Market size and forecast 2025-2030

Chart on Domestic - Market size and forecast 2025-2030 ($ million)
Data Table on Domestic - Market size and forecast 2025-2030 ($ million)
Chart on Domestic - Year-over-year growth 2025-2030 (%)
Data Table on Domestic - Year-over-year growth 2025-2030 (%)

8.5 Market opportunity by Type

Market opportunity by Type ($ million)
Data Table on Market opportunity by Type ($ million)

9. Market Segmentation by Consumer

9.1 Market segments

Chart on Consumer - Market share 2025-2030 (%)
Data Table on Consumer - Market share 2025-2030 (%)

9.2 Comparison by Consumer

Chart on Comparison by Consumer
Data Table on Comparison by Consumer

9.3 Business to business - Market size and forecast 2025-2030

Chart on Business to business - Market size and forecast 2025-2030 ($ million)
Data Table on Business to business - Market size and forecast 2025-2030 ($ million)
Chart on Business to business - Year-over-year growth 2025-2030 (%)
Data Table on Business to business - Year-over-year growth 2025-2030 (%)

9.4 Business to customer - Market size and forecast 2025-2030

Chart on Business to customer - Market size and forecast 2025-2030 ($ million)
Data Table on Business to customer - Market size and forecast 2025-2030 ($ million)
Chart on Business to customer - Year-over-year growth 2025-2030 (%)
Data Table on Business to customer - Year-over-year growth 2025-2030 (%)

9.5 Customer to customer - Market size and forecast 2025-2030

Chart on Customer to customer - Market size and forecast 2025-2030 ($ million)
Data Table on Customer to customer - Market size and forecast 2025-2030 ($ million)
Chart on Customer to customer - Year-over-year growth 2025-2030 (%)
Data Table on Customer to customer - Year-over-year growth 2025-2030 (%)

9.6 Market opportunity by Consumer

Market opportunity by Consumer ($ million)
Data Table on Market opportunity by Consumer ($ million)

10. Market Segmentation by Mode of Transportation

10.1 Market segments

Chart on Mode of Transportation - Market share 2025-2030 (%)
Data Table on Mode of Transportation - Market share 2025-2030 (%)

10.2 Comparison by Mode of Transportation

Chart on Comparison by Mode of Transportation
Data Table on Comparison by Mode of Transportation

10.3 Ground transportation - Market size and forecast 2025-2030

Chart on Ground transportation - Market size and forecast 2025-2030 ($ million)
Data Table on Ground transportation - Market size and forecast 2025-2030 ($ million)
Chart on Ground transportation - Year-over-year growth 2025-2030 (%)
Data Table on Ground transportation - Year-over-year growth 2025-2030 (%)

10.4 Air transportation - Market size and forecast 2025-2030

Chart on Air transportation - Market size and forecast 2025-2030 ($ million)
Data Table on Air transportation - Market size and forecast 2025-2030 ($ million)
Chart on Air transportation - Year-over-year growth 2025-2030 (%)
Data Table on Air transportation - Year-over-year growth 2025-2030 (%)

10.5 Sea transportation - Market size and forecast 2025-2030

Chart on Sea transportation - Market size and forecast 2025-2030 ($ million)
Data Table on Sea transportation - Market size and forecast 2025-2030 ($ million)
Chart on Sea transportation - Year-over-year growth 2025-2030 (%)
Data Table on Sea transportation - Year-over-year growth 2025-2030 (%)

10.6 Market opportunity by Mode of Transportation

Market opportunity by Mode of Transportation ($ million)
Data Table on Market opportunity by Mode of Transportation ($ million)

11. Customer Landscape

11.1 Customer landscape overview

Analysis of price sensitivity, lifecycle, customer purchase basket, adoption rates, and purchase criteria

12. Geographic Landscape

12.1 Geographic segmentation

Chart on Market share by geography 2025-2030 (%)
Data Table on Market share by geography 2025-2030 (%)

12.2 Geographic comparison

Chart on Geographic comparison
Data Table on Geographic comparison

12.3 APAC - Market size and forecast 2025-2030

Chart on APAC - Market size and forecast 2025-2030 ($ million)
Data Table on APAC - Market size and forecast 2025-2030 ($ million)
Chart on APAC - Year-over-year growth 2025-2030 (%)
Data Table on APAC - Year-over-year growth 2025-2030 (%)
Chart on Regional Comparison - APAC
Data Table on Regional Comparison - APAC

12.3.1 China - Market size and forecast 2025-2030

Chart on China - Market size and forecast 2025-2030 ($ million)
Data Table on China - Market size and forecast 2025-2030 ($ million)
Chart on China - Year-over-year growth 2025-2030 (%)
Data Table on China - Year-over-year growth 2025-2030 (%)

12.3.2 Japan - Market size and forecast 2025-2030

Chart on Japan - Market size and forecast 2025-2030 ($ million)
Data Table on Japan - Market size and forecast 2025-2030 ($ million)
Chart on Japan - Year-over-year growth 2025-2030 (%)
Data Table on Japan - Year-over-year growth 2025-2030 (%)

12.3.3 India - Market size and forecast 2025-2030

Chart on India - Market size and forecast 2025-2030 ($ million)
Data Table on India - Market size and forecast 2025-2030 ($ million)
Chart on India - Year-over-year growth 2025-2030 (%)
Data Table on India - Year-over-year growth 2025-2030 (%)

12.3.4 Indonesia - Market size and forecast 2025-2030

Chart on Indonesia - Market size and forecast 2025-2030 ($ million)
Data Table on Indonesia - Market size and forecast 2025-2030 ($ million)
Chart on Indonesia - Year-over-year growth 2025-2030 (%)
Data Table on Indonesia - Year-over-year growth 2025-2030 (%)

12.3.5 South Korea - Market size and forecast 2025-2030

Chart on South Korea - Market size and forecast 2025-2030 ($ million)
Data Table on South Korea - Market size and forecast 2025-2030 ($ million)
Chart on South Korea - Year-over-year growth 2025-2030 (%)
Data Table on South Korea - Year-over-year growth 2025-2030 (%)

12.3.6 Australia - Market size and forecast 2025-2030

Chart on Australia - Market size and forecast 2025-2030 ($ million)
Data Table on Australia - Market size and forecast 2025-2030 ($ million)
Chart on Australia - Year-over-year growth 2025-2030 (%)
Data Table on Australia - Year-over-year growth 2025-2030 (%)

12.4 North America - Market size and forecast 2025-2030

Chart on North America - Market size and forecast 2025-2030 ($ million)
Data Table on North America - Market size and forecast 2025-2030 ($ million)
Chart on North America - Year-over-year growth 2025-2030 (%)
Data Table on North America - Year-over-year growth 2025-2030 (%)
Chart on Regional Comparison - North America
Data Table on Regional Comparison - North America

12.4.1 US - Market size and forecast 2025-2030

Chart on US - Market size and forecast 2025-2030 ($ million)
Data Table on US - Market size and forecast 2025-2030 ($ million)
Chart on US - Year-over-year growth 2025-2030 (%)
Data Table on US - Year-over-year growth 2025-2030 (%)

12.4.2 Canada - Market size and forecast 2025-2030

Chart on Canada - Market size and forecast 2025-2030 ($ million)
Data Table on Canada - Market size and forecast 2025-2030 ($ million)
Chart on Canada - Year-over-year growth 2025-2030 (%)
Data Table on Canada - Year-over-year growth 2025-2030 (%)

12.4.3 Mexico - Market size and forecast 2025-2030

Chart on Mexico - Market size and forecast 2025-2030 ($ million)
Data Table on Mexico - Market size and forecast 2025-2030 ($ million)
Chart on Mexico - Year-over-year growth 2025-2030 (%)
Data Table on Mexico - Year-over-year growth 2025-2030 (%)

12.5 Europe - Market size and forecast 2025-2030

Chart on Europe - Market size and forecast 2025-2030 ($ million)
Data Table on Europe - Market size and forecast 2025-2030 ($ million)
Chart on Europe - Year-over-year growth 2025-2030 (%)
Data Table on Europe - Year-over-year growth 2025-2030 (%)
Chart on Regional Comparison - Europe
Data Table on Regional Comparison - Europe

12.5.1 Germany - Market size and forecast 2025-2030

Chart on Germany - Market size and forecast 2025-2030 ($ million)
Data Table on Germany - Market size and forecast 2025-2030 ($ million)
Chart on Germany - Year-over-year growth 2025-2030 (%)
Data Table on Germany - Year-over-year growth 2025-2030 (%)

12.5.2 UK - Market size and forecast 2025-2030

Chart on UK - Market size and forecast 2025-2030 ($ million)
Data Table on UK - Market size and forecast 2025-2030 ($ million)
Chart on UK - Year-over-year growth 2025-2030 (%)
Data Table on UK - Year-over-year growth 2025-2030 (%)

12.5.3 France - Market size and forecast 2025-2030

Chart on France - Market size and forecast 2025-2030 ($ million)
Data Table on France - Market size and forecast 2025-2030 ($ million)
Chart on France - Year-over-year growth 2025-2030 (%)
Data Table on France - Year-over-year growth 2025-2030 (%)

12.5.4 Italy - Market size and forecast 2025-2030

Chart on Italy - Market size and forecast 2025-2030 ($ million)
Data Table on Italy - Market size and forecast 2025-2030 ($ million)
Chart on Italy - Year-over-year growth 2025-2030 (%)
Data Table on Italy - Year-over-year growth 2025-2030 (%)

12.5.5 Spain - Market size and forecast 2025-2030

Chart on Spain - Market size and forecast 2025-2030 ($ million)
Data Table on Spain - Market size and forecast 2025-2030 ($ million)
Chart on Spain - Year-over-year growth 2025-2030 (%)
Data Table on Spain - Year-over-year growth 2025-2030 (%)

12.5.6 The Netherlands - Market size and forecast 2025-2030

Chart on The Netherlands - Market size and forecast 2025-2030 ($ million)
Data Table on The Netherlands - Market size and forecast 2025-2030 ($ million)
Chart on The Netherlands - Year-over-year growth 2025-2030 (%)
Data Table on The Netherlands - Year-over-year growth 2025-2030 (%)

12.6 Middle East and Africa - Market size and forecast 2025-2030

Chart on Middle East and Africa - Market size and forecast 2025-2030 ($ million)
Data Table on Middle East and Africa - Market size and forecast 2025-2030 ($ million)
Chart on Middle East and Africa - Year-over-year growth 2025-2030 (%)
Data Table on Middle East and Africa - Year-over-year growth 2025-2030 (%)
Chart on Regional Comparison - Middle East and Africa
Data Table on Regional Comparison - Middle East and Africa

12.6.1 Saudi Arabia - Market size and forecast 2025-2030

Chart on Saudi Arabia - Market size and forecast 2025-2030 ($ million)
Data Table on Saudi Arabia - Market size and forecast 2025-2030 ($ million)
Chart on Saudi Arabia - Year-over-year growth 2025-2030 (%)
Data Table on Saudi Arabia - Year-over-year growth 2025-2030 (%)

12.6.2 UAE - Market size and forecast 2025-2030

Chart on UAE - Market size and forecast 2025-2030 ($ million)
Data Table on UAE - Market size and forecast 2025-2030 ($ million)
Chart on UAE - Year-over-year growth 2025-2030 (%)
Data Table on UAE - Year-over-year growth 2025-2030 (%)

12.6.3 South Africa - Market size and forecast 2025-2030

Chart on South Africa - Market size and forecast 2025-2030 ($ million)
Data Table on South Africa - Market size and forecast 2025-2030 ($ million)
Chart on South Africa - Year-over-year growth 2025-2030 (%)
Data Table on South Africa - Year-over-year growth 2025-2030 (%)

12.6.4 Israel - Market size and forecast 2025-2030

Chart on Israel - Market size and forecast 2025-2030 ($ million)
Data Table on Israel - Market size and forecast 2025-2030 ($ million)
Chart on Israel - Year-over-year growth 2025-2030 (%)
Data Table on Israel - Year-over-year growth 2025-2030 (%)

12.6.5 Turkey - Market size and forecast 2025-2030

Chart on Turkey - Market size and forecast 2025-2030 ($ million)
Data Table on Turkey - Market size and forecast 2025-2030 ($ million)
Chart on Turkey - Year-over-year growth 2025-2030 (%)
Data Table on Turkey - Year-over-year growth 2025-2030 (%)

12.7 South America - Market size and forecast 2025-2030

Chart on South America - Market size and forecast 2025-2030 ($ million)
Data Table on South America - Market size and forecast 2025-2030 ($ million)
Chart on South America - Year-over-year growth 2025-2030 (%)
Data Table on South America - Year-over-year growth 2025-2030 (%)
Chart on Regional Comparison - South America
Data Table on Regional Comparison - South America

12.7.1 Brazil - Market size and forecast 2025-2030

Chart on Brazil - Market size and forecast 2025-2030 ($ million)
Data Table on Brazil - Market size and forecast 2025-2030 ($ million)
Chart on Brazil - Year-over-year growth 2025-2030 (%)
Data Table on Brazil - Year-over-year growth 2025-2030 (%)

12.7.2 Argentina - Market size and forecast 2025-2030

Chart on Argentina - Market size and forecast 2025-2030 ($ million)
Data Table on Argentina - Market size and forecast 2025-2030 ($ million)
Chart on Argentina - Year-over-year growth 2025-2030 (%)
Data Table on Argentina - Year-over-year growth 2025-2030 (%)

12.7.3 Chile - Market size and forecast 2025-2030

Chart on Chile - Market size and forecast 2025-2030 ($ million)
Data Table on Chile - Market size and forecast 2025-2030 ($ million)
Chart on Chile - Year-over-year growth 2025-2030 (%)
Data Table on Chile - Year-over-year growth 2025-2030 (%)

12.8 Market opportunity by geography

Market opportunity by geography ($ million)
Data Tables on Market opportunity by geography ($ million)

13. Drivers, Challenges, and Opportunity

13.1 Market drivers

Rapid proliferation of cross-border electronic commerce
Integration of advanced technology and automation
Strategic supply chain decentralization and nearshoring

13.2 Market challenges

Escalating operational costs
Geopolitical instability and supply chain disruption
Last-mile inefficiencies and environmental compliance

13.3 Impact of drivers and challenges

Impact of drivers and challenges in 2025 and 2030

13.4 Market opportunities

Expansion of out-of-home and locker delivery ecosystems
Strategic consolidation of express and ground networks
Optimization of reverse logistics and circular economy

14. Competitive Landscape

14.1 Overview

14.2

Overview on criticality of inputs and factors of differentiation

14.3 Landscape disruption

Overview on factors of disruption

14.4 Industry risks

Impact of key risks on business

15. Competitive Analysis

15.1 Companies profiled

Companies covered

15.2 Company ranking index

15.3 Market positioning of companies

Matrix on companies position and classification

15.4 Aramex International LLC

Aramex International LLC - Overview
Aramex International LLC - Product / Service
Aramex International LLC - Key news
Aramex International LLC - Key offerings
SWOT

15.5 BEST Inc.

BEST Inc. - Overview
BEST Inc. - Product / Service
BEST Inc. - Key offerings
SWOT

15.6 Blue Dart Express Ltd.

Blue Dart Express Ltd. - Overview
Blue Dart Express Ltd. - Product / Service
Blue Dart Express Ltd. - Key offerings
SWOT

15.7 CJ Logistics Corp.

CJ Logistics Corp. - Overview
CJ Logistics Corp. - Product / Service
CJ Logistics Corp. - Key offerings
SWOT

15.8 Delhivery Ltd.

Delhivery Ltd. - Overview
Delhivery Ltd. - Business segments
Delhivery Ltd. - Key offerings
Delhivery Ltd. - Segment focus
SWOT

15.9 DPD Deutschland GmbH

DPD Deutschland GmbH - Overview
DPD Deutschland GmbH - Product / Service
DPD Deutschland GmbH - Key offerings
SWOT

15.10 DTDC Express Ltd.

DTDC Express Ltd. - Overview
DTDC Express Ltd. - Product / Service
DTDC Express Ltd. - Key offerings
SWOT

15.11 FedEx Corp.

FedEx Corp. - Overview
FedEx Corp. - Business segments
FedEx Corp. - Key news
FedEx Corp. - Key offerings
FedEx Corp. - Segment focus
SWOT

15.12 J and T Global Express Ltd.

J and T Global Express Ltd. - Overview
J and T Global Express Ltd. - Product / Service
J and T Global Express Ltd. - Key offerings
SWOT

15.13 PostNL N.V.

PostNL N.V. - Overview
PostNL N.V. - Product / Service
PostNL N.V. - Key offerings
SWOT

15.14 SF Express Co. Ltd.

SF Express Co. Ltd. - Overview
SF Express Co. Ltd. - Business segments
SF Express Co. Ltd. - Key offerings
SF Express Co. Ltd. - Segment focus
SWOT

15.15 STO Express Co. Ltd.

STO Express Co. Ltd. - Overview
STO Express Co. Ltd. - Product / Service
STO Express Co. Ltd. - Key offerings
SWOT

15.16 United Parcel Service Inc.

United Parcel Service Inc. - Overview
United Parcel Service Inc. - Business segments
United Parcel Service Inc. - Key news
United Parcel Service Inc. - Key offerings
United Parcel Service Inc. - Segment focus
SWOT

15.17 YunExpress

YunExpress - Overview
YunExpress - Product / Service
YunExpress - Key offerings
SWOT

15.18 ZTO Express Cayman Inc.

ZTO Express Cayman Inc. - Overview
ZTO Express Cayman Inc. - Business segments
ZTO Express Cayman Inc. - Key offerings
ZTO Express Cayman Inc. - Segment focus
SWOT

16. Appendix

16.1 Scope of the report

Market definition
Objectives
Notes and caveats

16.2 Inclusions and exclusions checklist

Inclusions checklist
Exclusions checklist

16.3 Currency conversion rates for US$

16.4 Research methodology

16.5 Data procurement

Information sources

16.6 Data validation

16.7 Validation techniques employed for market sizing

16.8 Data synthesis

16.9 360 degree market analysis

16.10 List of abbreviations

Research Methodology

Technavio presents a detailed picture of the market by way of study, synthesis, and summation of data from multiple sources. The analysts have presented the various facets of the market with a particular focus on identifying the key industry influencers. The data thus presented is comprehensive, reliable, and the result of extensive research, both primary and secondary.

INFORMATION SOURCES

Primary sources

  • Manufacturers and suppliers
  • Channel partners
  • Industry experts
  • Strategic decision makers

Secondary sources

  • Industry journals and periodicals
  • Government data
  • Financial reports of key industry players
  • Historical data
  • Press releases

DATA ANALYSIS

Data Synthesis

  • Collation of data
  • Estimation of key figures
  • Analysis of derived insights

Data Validation

  • Triangulation with data models
  • Reference against proprietary databases
  • Corroboration with industry experts

REPORT WRITING

Qualitative

  • Market drivers
  • Market challenges
  • Market trends
  • Five forces analysis

Quantitative

  • Market size and forecast
  • Market segmentation
  • Geographical insights
  • Competitive landscape

Interested in this report?

Get your sample now to see our research methodology and insights!

Download Now

Frequently Asked Questions

Courier Pickup And Delivery Services market growth will increase by USD 93090.9 million during 2026-2030 .

The Courier Pickup And Delivery Services market is expected to grow at a CAGR of 7.3% during 2026-2030 .

Courier Pickup And Delivery Services market is segmented by Type (International, Domestic) Consumer (Business to business, Business to customer, Customer to customer) Mode of transportation (Ground transportation, Air transportation, Sea transportation)

Aramex International LLC, Asendia Management SAS, BEST Inc., Blue Dart Express Ltd., CJ Logistics Corp., Colissimo, Delhivery Ltd., DPD Deutschland GmbH, DTDC Express Ltd., FedEx Corp., J and T Global Express Ltd., Ninja Van Group, PostNL N.V., SF Express Co. Ltd., STO Express Co. Ltd., United Parcel Service Inc., YunExpress, ZTO Express Cayman Inc. are a few of the key vendors in the Courier Pickup And Delivery Services market.

APAC will register the highest growth rate of 41.4% among the other regions. Therefore, the Courier Pickup And Delivery Services market in APAC is expected to garner significant business opportunities for the vendors during the forecast period.

China, Japan, India, Indonesia, South Korea, Australia, US, Canada, Mexico, Germany, UK, France, Italy, Spain, The Netherlands, Saudi Arabia, UAE, South Africa, Israel, Turkey, Brazil, Argentina, Chile

  • Rapid proliferation of cross-border electronic commerce is the driving factor this market.

The Courier Pickup And Delivery Services market vendors should focus on grabbing business opportunities from the Type segment as it accounted for the largest market share in the base year.