Data Resiliency Market Analysis, Size, and Forecast 2026-2030: North America (US, Canada, and Mexico), APAC (China, Japan, and India), Europe (Germany, UK, and France), South America (Brazil, Argentina, and Chile), Middle East and Africa (Saudi Arabia, UAE, and South Africa), and Rest of World (ROW)

Data Resiliency Market Analysis, Size, and Forecast 2026-2030:
North America (US, Canada, and Mexico), APAC (China, Japan, and India), Europe (Germany, UK, and France), South America (Brazil, Argentina, and Chile), Middle East and Africa (Saudi Arabia, UAE, and South Africa), and Rest of World (ROW)

Published: May 2026 284 Pages SKU: IRTNTR72911

Market Overview at a Glance

$37.55 B
Market Opportunity
21.8%
CAGR 2025 - 2030
38.3%
North America Growth
$11.13 B
On-premises segment 2024

Data Resiliency Market Size and Growth Forecast 2026-2030

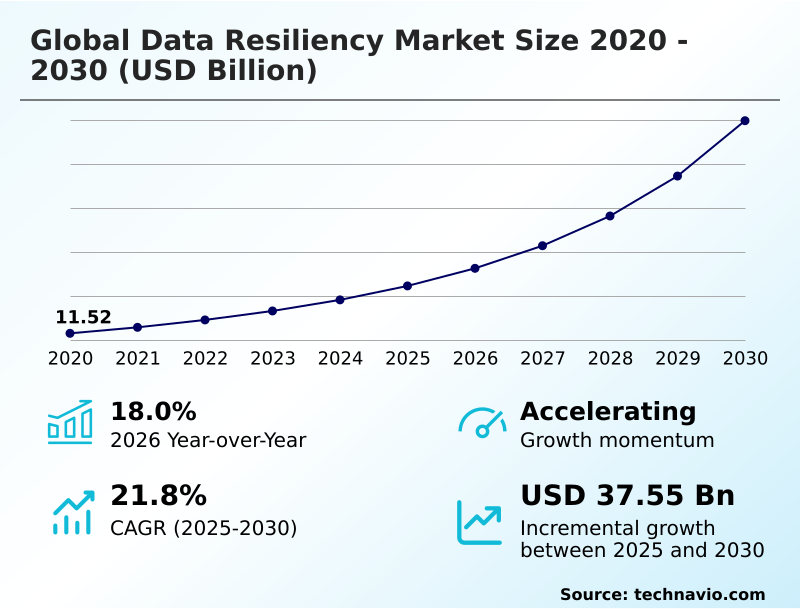
The Data Resiliency Market size was valued at USD 22.29 billion in 2025 growing at a CAGR of 21.8% during the forecast period 2026-2030.

North America accounts for 38.3% of incremental growth during the forecast period. The On-premises segment by Deployment was valued at USD 11.13 billion in 2024, while the Solution segment holds the largest revenue share by Component.

The market is projected to grow by USD 48.31 billion from 2020 to 2030, with USD 37.55 billion of the growth expected during the forecast period of 2025 to 2030.

Get Key Insights on Market Forecast (PDF) Request Free Sample

Data Resiliency Market Overview

The data resiliency market is defined by a critical shift from passive backup and recovery to proactive cyber resilience strategies. Organizations now prioritize maintaining continuous operations against a backdrop of sophisticated threats, driving demand for solutions that offer near-zero recovery time objective (RTO) and recovery point objective (RPO) targets. North America is a significant contributor to market expansion, driven by stringent regulatory pressures. For example, a healthcare provider facing a ransomware attack can leverage a cyber recovery vault with immutable backups to restore its electronic health record system in minutes, ensuring continuous data protection (CDP) and compliance with the Health Insurance Portability and Accountability Act (HIPAA) without paying a ransom. This focus on zero trust data security and automated failover capabilities illustrates the market’s direction toward intelligent, self-healing systems that safeguard critical information across hybrid and multi-cloud data management frameworks.

Drivers, Trends, and Challenges in the Data Resiliency Market

Enterprises are formulating a comprehensive multi-cloud backup and recovery strategy to navigate the complexities of modern IT infrastructure. This involves creating a detailed ransomware recovery and response plan that goes beyond simple data restoration to include forensic analysis and vulnerability patching.

A core component of this approach is disaster recovery orchestration and automation, which minimizes manual intervention and dramatically shortens recovery times, a critical factor for meeting the stringent uptime requirements outlined in regulations like the Sarbanes-Oxley Act (SOX). For instance, a global financial services firm deploying containerized applications must integrate data protection for kubernetes environments to secure transactional microservices.

Implementing immutable storage for cyber resilience is central to this architecture, as it creates an unchangeable, air-gapped copy of data that is impervious to malicious encryption or deletion. This method has proven to be significantly more effective at ensuring recoverability than traditional tape-based backups, reducing the risk of catastrophic data loss.

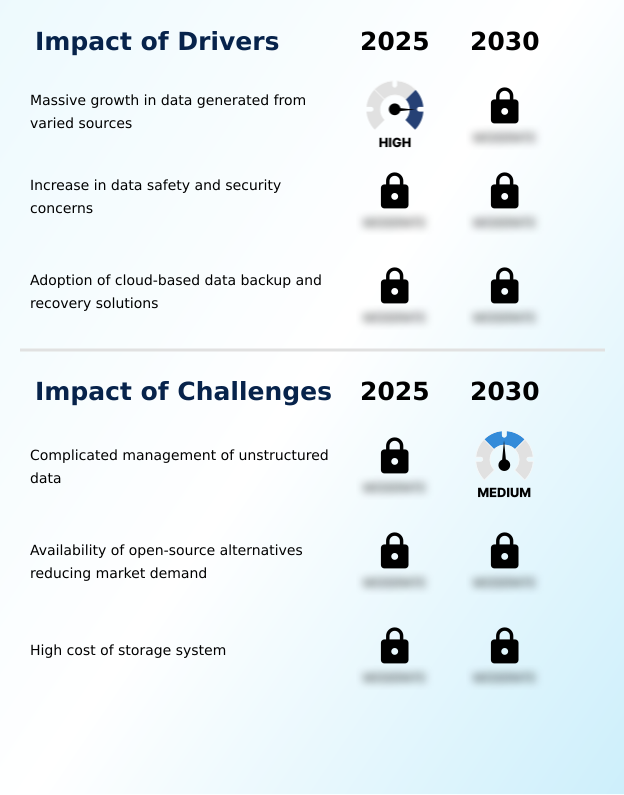
Primary Growth Driver: The massive growth in data generated from varied sources acts as a fundamental engine for market expansion as enterprises grapple with the sheer volume of information produced in the modern digital era.

The exponential increase in data volume from sources like IoT devices, social media, and remote work applications is a fundamental driver, with the market showing an 18% year-over-year growth.

This data explosion makes traditional backup methods insufficient for ensuring business continuity, fueling demand for automated and scalable data replication and protection solutions across hybrid and multi-cloud data management architectures.

The strategic importance of this information for real-time analytics means that any data loss can lead to severe financial and reputational damage.

Consequently, enterprises are prioritizing investments in advanced backup and recovery systems, including object storage and predictive analytics for recovery, to protect their most critical digital assets and maintain operational stability in a data-intensive environment.

Emerging Market Trend: The rising popularity of blockchain solutions is fundamentally altering the strategic landscape for organizations seeking to eliminate single points of failure within their backup and recovery architectures.

A primary trend is the integration of blockchain technology to create tamper-proof data validation systems, ensuring the integrity of backups. This shift toward decentralized ledgers provides a higher degree of confidence for industries handling sensitive files, such as finance and healthcare, by guaranteeing data immutability against unauthorized modification.

Organizations are leveraging these platforms to automate recovery protocols via smart contracts and simplify compliance audits under regulations like GDPR with a permanent record of backup activities. The adoption of cloud-based deployment models, which saw substantial growth in recent years, further enables this trend by providing the scalable infrastructure needed for distributed ledger technologies.

This convergence is creating more robust frameworks for information availability, independent of a single physical location.

Key Industry Challenge: The complicated management of unstructured data stands as a formidable barrier to achieving comprehensive operational continuity, as this information often lacks a predefined format or organizational structure.

A significant challenge is the complicated management of unstructured data, which now accounts for nearly 80% of all new enterprise information. Content such as emails, images, and social media posts lacks a predefined model, making it difficult to index, search, and protect efficiently with traditional data protection strategy tools.

This creates visibility gaps in an organization’s resiliency posture, leading to bloated storage costs and inefficient recovery processes that can exceed acceptable downtime limits. The lack of consistent metadata complicates the application of data lifecycle management and retention policies, increasing compliance risks under regulations such as the CCPA.

Addressing this requires investment in advanced classification, deduplication and compression, and AI-powered discovery tools to prevent resiliency frameworks from being overwhelmed.

Explore Full Market Dynamics Analysis Request Free Sample

Data Resiliency Market Segmentation

The data resiliency industry research report provides comprehensive data including region-wise segment analysis, with forecasts and analysis for the period 2026-2030, as well as historical data from 2020-2024 for the following segments.

Market Segment by Deployment
  • On-premises
  • Cloud
Market Segment by Component
  • Solution
  • Service
Market Segment by End-user
  • Large enterprises
  • SMEs
Market Segment by Geography
North America
US, Canada, Mexico
APAC
China, Japan, India, South Korea, Australia, Indonesia
Europe
Germany, UK, France, Italy, Spain, The Netherlands
South America
Brazil, Argentina, Chile
Middle East and Africa
Saudi Arabia, UAE, South Africa, Israel, Turkey

Deployment Segment Analysis

The on-premises segment is estimated to witness significant growth during the forecast period.

The on-premises segment represents a foundational approach to information protection where organizations maintain complete control over their backup hardware and recovery software.

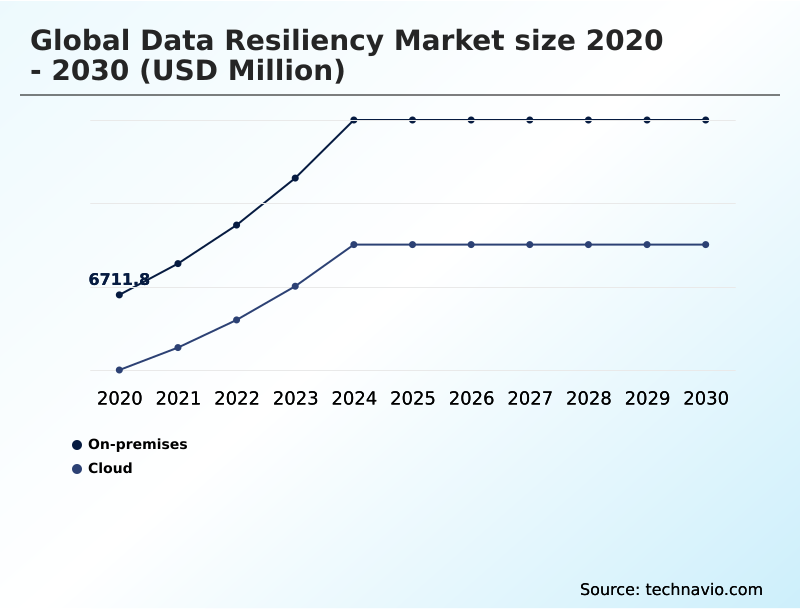
This deployment model, accounting for a significant share of the market, is critical for entities such as government agencies and large research institutions that require air-gapped storage to mitigate external cyber threats.

By hosting their resiliency infrastructure locally, these organizations can enforce strict data sovereignty mandates and ensure cryptographic keys never leave the internal network.

While requiring high initial capital expenditure for infrastructure like a cyber recovery vault, procurement decision-makers in regulated industries prioritize this model for its low-latency recovery capabilities, data immutability, and deep integration with legacy systems, which are essential for maintaining operational autonomy and meeting compliance standards like HIPAA.

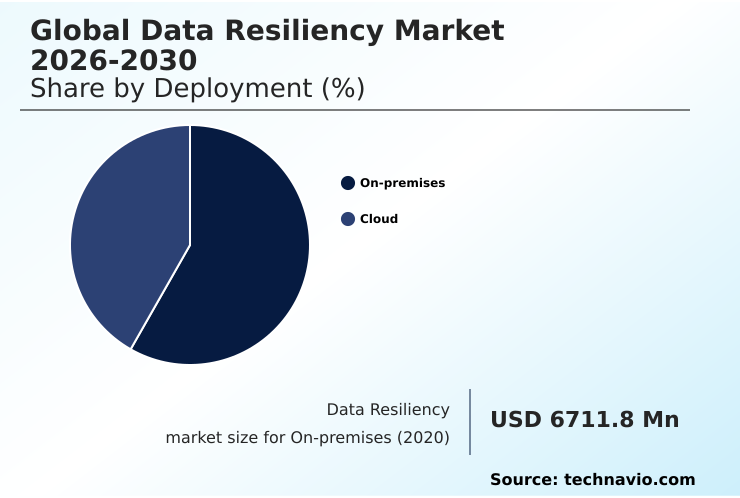
The On-premises segment was valued at USD 11.13 billion in 2024 and showed a gradual increase during the forecast period.

Data Resiliency Market by Region: North America Leads with 38.3% Growth Share

North America is estimated to contribute 38.3% to the growth of the global market during the forecast period.

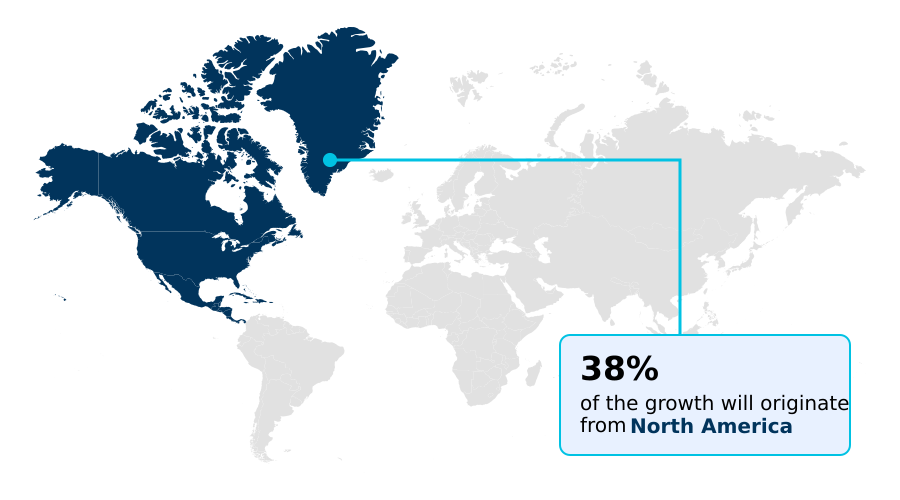
The geographic landscape is led by North America, which accounts for approximately 38% of the market's incremental growth.

This dominance is propelled by high adoption rates in the US and Canada, where stringent regulations like the California Consumer Privacy Act (CCPA) mandate robust data protection.

Enterprises in the region are heavily investing in disaster recovery as a service (DRaaS) and advanced cloud data management platforms to secure information across hybrid environments.

A key operational driver is the need to ensure data sovereignty while managing complex multi-cloud deployments.

Consequently, there is strong demand for unified data protection and cloud-native backup solutions that provide both security and compliance, enabling organizations to maintain control over sensitive assets irrespective of their physical or virtual location.

Customer Landscape Analysis for the Data Resiliency Market

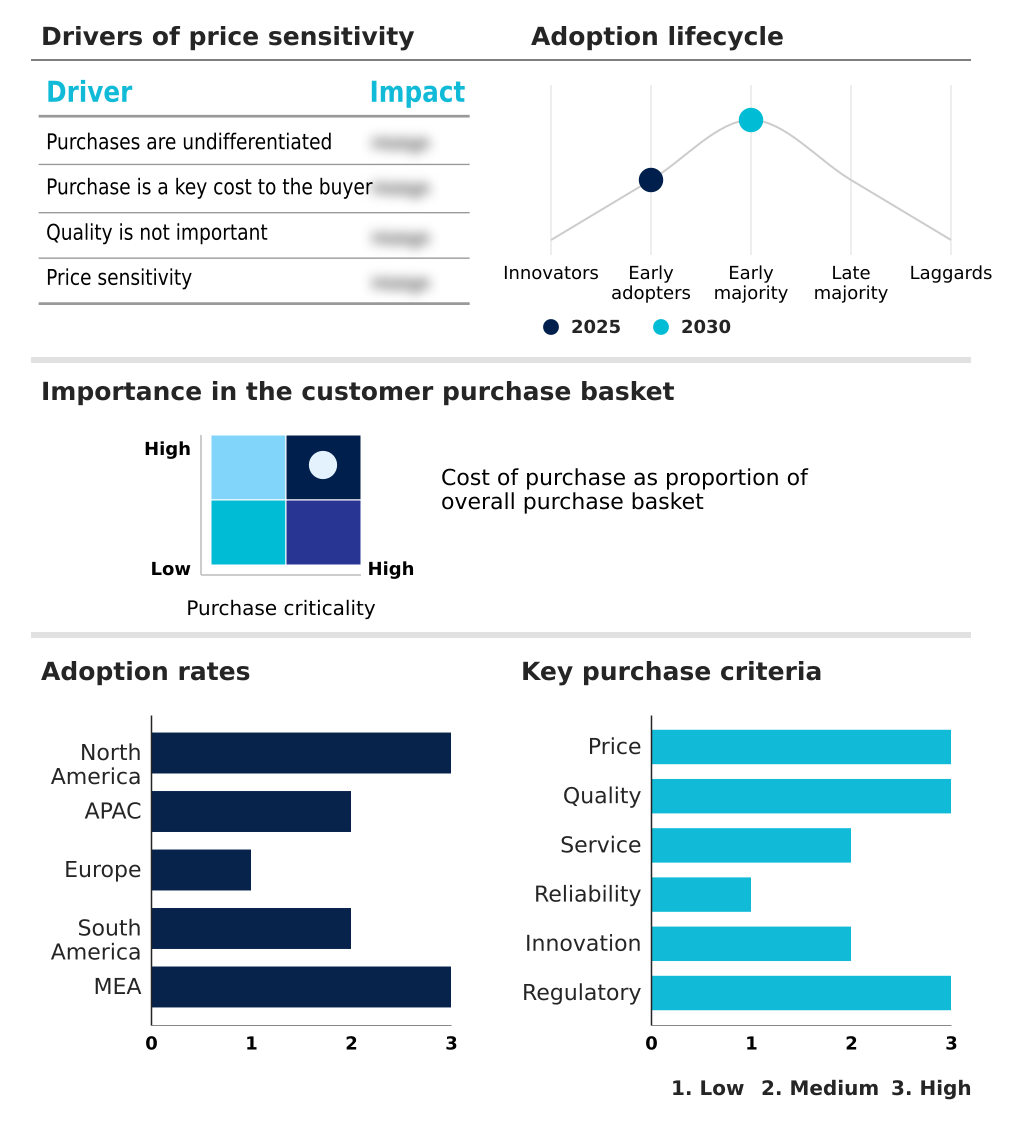
The data resiliency market forecasting report includes the adoption lifecycle of the market, covering from the innovator’s stage to the laggard’s stage. It focuses on adoption rates in different regions based on penetration. Furthermore, the data resiliency market report also includes key purchase criteria and drivers of price sensitivity to help companies evaluate and develop their market growth analysis strategies.

Competitive Landscape of the Data Resiliency Market

Companies are implementing various strategies, such as strategic alliances, partnerships, mergers and acquisitions, geographical expansion, and product/service launches, to enhance their presence in the data resiliency market industry.

Arcserve USA LLC - Offerings include enterprise-grade data storage solutions engineered for robust data protection, business continuity, and comprehensive cyber resilience.

The industry research and growth report includes detailed analyses of the competitive landscape of the market and information about key companies, including:

  • Arcserve USA LLC
  • Asigra Inc.
  • Cloudian Inc.
  • Cohesity Inc.
  • Commvault Systems Inc.
  • Dell Technologies Inc.
  • Druva Inc.
  • Hewlett Packard Enterprise Co.
  • IBM Corp.
  • Infinidat Ltd.
  • Kaseya Ltd.
  • NetApp Inc.
  • Nutanix Inc.
  • Pure Storage Inc.
  • Quantum Corp.
  • Rubrik Inc.
  • Unitrends Inc.
  • Veeam Software Group GmbH
  • Veritas Technologies LLC
  • Zscaler Inc.

Qualitative and quantitative analysis of companies has been conducted to help clients understand the wider business environment as well as the strengths and weaknesses of key industry players. Data is qualitatively analyzed to categorize companies as pure play, category-focused, industry-focused, and diversified; it is quantitatively analyzed to categorize companies as dominant, leading, strong, tentative, and weak.

Recent Developments in the Data Resiliency Market

  • In May 2025, Veeam Software announced the launch of its next-generation resilience platform, which introduced an automated recovery orchestrator designed for large-scale disaster scenarios across complex public cloud ecosystems.
  • In April 2025, Dell Technologies revealed a new suite of high-density storage arrays and automated protection software designed to manage the petabyte-scale requirements of modern artificial intelligence research facilities.
  • In January 2025, Dell Technologies announced a significant update to its PowerProtect portfolio, integrating a new localized vaulting system to provide enhanced immutability for on-premises workloads against ransomware attacks.
  • In August 2025, IBM announced a major update to its storage portfolio that integrated a native blockchain-based validation system designed to secure high-value datasets for global banking institutions against unauthorized modification.

Research Analyst Overview: Data Resiliency Market

The data resiliency market is fundamentally evolving from simple backup and recovery operations toward integrated cyber-defense frameworks. The solution segment dominates market revenue, reflecting enterprise-level investment in platforms that deliver data immutability and automated failover.

Boardroom decisions are increasingly focused on mitigating financial and operational risks associated with data breaches, linking procurement of a cyber recovery vault directly to corporate governance mandates under standards like ISO/IEC 27001. This strategic pivot drives adoption of zero trust data security architectures, where continuous data protection and robust data replication are standard features, not add-ons.

The objective is to achieve guaranteed recoverability with near-zero data loss, a non-negotiable requirement for industries where even minimal downtime can cause significant reputational damage. As such, an effective data protection strategy is now a key pillar of business continuity planning and a critical vendor qualification criterion.

Dive into Technavio’s robust research methodology, blending expert interviews, extensive data synthesis, and validated models for unparalleled Data Resiliency Market insights. See full methodology.

Request Free Sample

Market Scope
Page number 284
Base year 2025
Historic period 2020-2024
Forecast period 2026-2030
Growth momentum & CAGR Accelerate at a CAGR of 21.8%
Market growth 2026-2030 USD 37549.1 million
Market structure Fragmented
YoY growth 2025-2026(%) 18.0%
Key countries US, Canada, Mexico, China, Japan, India, South Korea, Australia, Indonesia, Germany, UK, France, Italy, Spain, The Netherlands, Brazil, Argentina, Chile, Saudi Arabia, UAE, South Africa, Israel and Turkey
Competitive landscape Leading Companies, Market Positioning of Companies, Competitive Strategies, and Industry Risks

Data Resiliency Market: Key Questions Answered in This Report

  • What is the expected growth of the Data Resiliency Market between 2026 and 2030?

    • The Data Resiliency Market is expected to grow by USD 37.55 billion during 2026-2030, registering a CAGR of 21.8%. Year-over-year growth in 2026 is estimated at 18.0%%. This acceleration is shaped by massive growth in data generated from varied sources, which is intensifying demand across multiple end-use verticals covered in the report.

  • What segmentation does the market report cover?

    • The report is segmented by Deployment (On-premises, and Cloud), Component (Solution, and Service), End-user (Large enterprises, and SMEs) and Geography (North America, APAC, Europe, South America, Middle East and Africa). Among these, the On-premises segment is estimated to witness significant growth during the forecast period, driven by rising adoption across key application areas. Each segment includes detailed qualitative and quantitative analysis, along with historical data from 2020-2024 and forecasts through 2030 with year-over-year growth rates.

  • Which regions are analyzed in the report?

    • The report covers North America, APAC, Europe, South America and Middle East and Africa. North America is estimated to contribute 38.3% to market growth during the forecast period. Country-level analysis includes US, Canada, Mexico, China, Japan, India, South Korea, Australia, Indonesia, Germany, UK, France, Italy, Spain, The Netherlands, Brazil, Argentina, Chile, Saudi Arabia, UAE, South Africa, Israel and Turkey, with dedicated market size tables and year-over-year growth for each.

  • What are the key growth drivers and market challenges?

    • The primary driver is massive growth in data generated from varied sources, which is accelerating investment and industry demand. The main challenge is complicated management of unstructured data, creating operational barriers for key market participants. The report quantifies the impact of each driver and challenge across 2026 and 2030 with comparative analysis.

  • Who are the major players in the Data Resiliency Market?

    • Key vendors include Arcserve USA LLC, Asigra Inc., Cloudian Inc., Cohesity Inc., Commvault Systems Inc., Dell Technologies Inc., Druva Inc., Hewlett Packard Enterprise Co., IBM Corp., Infinidat Ltd., Kaseya Ltd., NetApp Inc., Nutanix Inc., Pure Storage Inc., Quantum Corp., Rubrik Inc., Unitrends Inc., Veeam Software Group GmbH, Veritas Technologies LLC and Zscaler Inc.. The report provides qualitative and quantitative analysis categorizing companies as dominant, leading, strong, tentative, and weak based on their market positioning. Company profiles include business segment analysis, SWOT assessment, key offerings, and recent strategic developments.

Data Resiliency Market Research Insights

Market dynamics are increasingly shaped by the need for a cohesive data protection strategy that spans complex IT environments. The adoption of cloud-native backup is accelerating, with organizations leveraging snapshot-based backup and instant recovery to improve data availability solutions.

For instance, an e-commerce platform can use these techniques to restore its customer database with minimal downtime during a system failure, ensuring business continuity during peak transaction periods. This shift is also influenced by data governance and compliance mandates such as the GDPR, which dictate policies for data loss prevention and workload mobility.

As enterprises refine their business continuity planning, the focus moves toward orchestrated recovery and comprehensive failover and failback testing to validate infrastructure resilience against a wide spectrum of potential disruptions.

We can help! Our analysts can customize this data resiliency market research report to meet your requirements.

Get in touch

1. Executive Summary

1.1 Market overview

Executive Summary - Chart on Market Overview
Executive Summary - Data Table on Market Overview
Executive Summary - Chart on Global Market Characteristics
Executive Summary - Chart on Market by Geography
Executive Summary - Chart on Market Segmentation by Deployment
Executive Summary - Chart on Market Segmentation by Component
Executive Summary - Chart on Market Segmentation by End-user
Executive Summary - Chart on Incremental Growth
Executive Summary - Data Table on Incremental Growth
Executive Summary - Chart on Company Market Positioning

2. Technavio Analysis

2.1 Analysis of price sensitivity, lifecycle, customer purchase basket, adoption rates, and purchase criteria

2.2 Criticality of inputs and Factors of differentiation

Chart on Overview on criticality of inputs and factors of differentiation

2.3 Factors of disruption

Chart on Overview on factors of disruption

2.4 Impact of drivers and challenges

Chart on Impact of drivers and challenges in 2025 and 2030

3. Market Landscape

3.1 Market ecosystem

Chart on Parent Market
Data Table on - Parent Market

3.2 Market characteristics

Chart on Market characteristics analysis

3.3 Value chain analysis

Chart on Value chain analysis

4. Market Sizing

4.1 Market definition

Data Table on Offerings of companies included in the market definition

4.2 Market segment analysis

Market segments

4.3 Market size 2025

4.4 Market outlook: Forecast for 2025-2030

Chart on Global - Market size and forecast 2025-2030 ($ million)
Data Table on Global - Market size and forecast 2025-2030 ($ million)
Chart on Global Market: Year-over-year growth 2025-2030 (%)
Data Table on Global Market: Year-over-year growth 2025-2030 (%)

5. Historic Market Size

5.1 Global Data Resiliency Market 2020 - 2024

Historic Market Size - Data Table on Global Data Resiliency Market 2020 - 2024 ($ million)

5.2 Deployment segment analysis 2020 - 2024

Historic Market Size - Deployment Segment 2020 - 2024 ($ million)

5.3 Component segment analysis 2020 - 2024

Historic Market Size - Component Segment 2020 - 2024 ($ million)

5.4 End-user segment analysis 2020 - 2024

Historic Market Size - End-user Segment 2020 - 2024 ($ million)

5.5 Geography segment analysis 2020 - 2024

Historic Market Size - Geography Segment 2020 - 2024 ($ million)

5.6 Country segment analysis 2020 - 2024

Historic Market Size - Country Segment 2020 - 2024 ($ million)

6. Qualitative Analysis

6.1 Impact of AI on Global Data Resiliency Market

6.2 Impact of Geopolitical Conflicts on Global Data Resiliency Market

7. Five Forces Analysis

7.1 Five forces summary

Five forces analysis - Comparison between 2025 and 2030

7.2 Bargaining power of buyers

Bargaining power of buyers - Impact of key factors 2025 and 2030

7.3 Bargaining power of suppliers

Bargaining power of suppliers - Impact of key factors in 2025 and 2030

7.4 Threat of new entrants

Threat of new entrants - Impact of key factors in 2025 and 2030

7.5 Threat of substitutes

Threat of substitutes - Impact of key factors in 2025 and 2030

7.6 Threat of rivalry

Threat of rivalry - Impact of key factors in 2025 and 2030

7.7 Market condition

Chart on Market condition - Five forces 2025 and 2030

8. Market Segmentation by Deployment

8.1 Market segments

Chart on Deployment - Market share 2025-2030 (%)
Data Table on Deployment - Market share 2025-2030 (%)

8.2 Comparison by Deployment

Chart on Comparison by Deployment
Data Table on Comparison by Deployment

8.3 On-premises - Market size and forecast 2025-2030

Chart on On-premises - Market size and forecast 2025-2030 ($ million)
Data Table on On-premises - Market size and forecast 2025-2030 ($ million)
Chart on On-premises - Year-over-year growth 2025-2030 (%)
Data Table on On-premises - Year-over-year growth 2025-2030 (%)

8.4 Cloud - Market size and forecast 2025-2030

Chart on Cloud - Market size and forecast 2025-2030 ($ million)
Data Table on Cloud - Market size and forecast 2025-2030 ($ million)
Chart on Cloud - Year-over-year growth 2025-2030 (%)
Data Table on Cloud - Year-over-year growth 2025-2030 (%)

8.5 Market opportunity by Deployment

Market opportunity by Deployment ($ million)
Data Table on Market opportunity by Deployment ($ million)

9. Market Segmentation by Component

9.1 Market segments

Chart on Component - Market share 2025-2030 (%)
Data Table on Component - Market share 2025-2030 (%)

9.2 Comparison by Component

Chart on Comparison by Component
Data Table on Comparison by Component

9.3 Solution - Market size and forecast 2025-2030

Chart on Solution - Market size and forecast 2025-2030 ($ million)
Data Table on Solution - Market size and forecast 2025-2030 ($ million)
Chart on Solution - Year-over-year growth 2025-2030 (%)
Data Table on Solution - Year-over-year growth 2025-2030 (%)

9.4 Service - Market size and forecast 2025-2030

Chart on Service - Market size and forecast 2025-2030 ($ million)
Data Table on Service - Market size and forecast 2025-2030 ($ million)
Chart on Service - Year-over-year growth 2025-2030 (%)
Data Table on Service - Year-over-year growth 2025-2030 (%)

9.5 Market opportunity by Component

Market opportunity by Component ($ million)
Data Table on Market opportunity by Component ($ million)

10. Market Segmentation by End-user

10.1 Market segments

Chart on End-user - Market share 2025-2030 (%)
Data Table on End-user - Market share 2025-2030 (%)

10.2 Comparison by End-user

Chart on Comparison by End-user
Data Table on Comparison by End-user

10.3 Large enterprises - Market size and forecast 2025-2030

Chart on Large enterprises - Market size and forecast 2025-2030 ($ million)
Data Table on Large enterprises - Market size and forecast 2025-2030 ($ million)
Chart on Large enterprises - Year-over-year growth 2025-2030 (%)
Data Table on Large enterprises - Year-over-year growth 2025-2030 (%)

10.4 SMEs - Market size and forecast 2025-2030

Chart on SMEs - Market size and forecast 2025-2030 ($ million)
Data Table on SMEs - Market size and forecast 2025-2030 ($ million)
Chart on SMEs - Year-over-year growth 2025-2030 (%)
Data Table on SMEs - Year-over-year growth 2025-2030 (%)

10.5 Market opportunity by End-user

Market opportunity by End-user ($ million)
Data Table on Market opportunity by End-user ($ million)

11. Customer Landscape

11.1 Customer landscape overview

Analysis of price sensitivity, lifecycle, customer purchase basket, adoption rates, and purchase criteria

12. Geographic Landscape

12.1 Geographic segmentation

Chart on Market share by geography 2025-2030 (%)
Data Table on Market share by geography 2025-2030 (%)

12.2 Geographic comparison

Chart on Geographic comparison
Data Table on Geographic comparison

12.3 North America - Market size and forecast 2025-2030

Chart on North America - Market size and forecast 2025-2030 ($ million)
Data Table on North America - Market size and forecast 2025-2030 ($ million)
Chart on North America - Year-over-year growth 2025-2030 (%)
Data Table on North America - Year-over-year growth 2025-2030 (%)
Chart on Regional Comparison - North America
Data Table on Regional Comparison - North America

12.3.1 US - Market size and forecast 2025-2030

Chart on US - Market size and forecast 2025-2030 ($ million)
Data Table on US - Market size and forecast 2025-2030 ($ million)
Chart on US - Year-over-year growth 2025-2030 (%)
Data Table on US - Year-over-year growth 2025-2030 (%)

12.3.2 Canada - Market size and forecast 2025-2030

Chart on Canada - Market size and forecast 2025-2030 ($ million)
Data Table on Canada - Market size and forecast 2025-2030 ($ million)
Chart on Canada - Year-over-year growth 2025-2030 (%)
Data Table on Canada - Year-over-year growth 2025-2030 (%)

12.3.3 Mexico - Market size and forecast 2025-2030

Chart on Mexico - Market size and forecast 2025-2030 ($ million)
Data Table on Mexico - Market size and forecast 2025-2030 ($ million)
Chart on Mexico - Year-over-year growth 2025-2030 (%)
Data Table on Mexico - Year-over-year growth 2025-2030 (%)

12.4 APAC - Market size and forecast 2025-2030

Chart on APAC - Market size and forecast 2025-2030 ($ million)
Data Table on APAC - Market size and forecast 2025-2030 ($ million)
Chart on APAC - Year-over-year growth 2025-2030 (%)
Data Table on APAC - Year-over-year growth 2025-2030 (%)
Chart on Regional Comparison - APAC
Data Table on Regional Comparison - APAC

12.4.1 China - Market size and forecast 2025-2030

Chart on China - Market size and forecast 2025-2030 ($ million)
Data Table on China - Market size and forecast 2025-2030 ($ million)
Chart on China - Year-over-year growth 2025-2030 (%)
Data Table on China - Year-over-year growth 2025-2030 (%)

12.4.2 Japan - Market size and forecast 2025-2030

Chart on Japan - Market size and forecast 2025-2030 ($ million)
Data Table on Japan - Market size and forecast 2025-2030 ($ million)
Chart on Japan - Year-over-year growth 2025-2030 (%)
Data Table on Japan - Year-over-year growth 2025-2030 (%)

12.4.3 India - Market size and forecast 2025-2030

Chart on India - Market size and forecast 2025-2030 ($ million)
Data Table on India - Market size and forecast 2025-2030 ($ million)
Chart on India - Year-over-year growth 2025-2030 (%)
Data Table on India - Year-over-year growth 2025-2030 (%)

12.4.4 South Korea - Market size and forecast 2025-2030

Chart on South Korea - Market size and forecast 2025-2030 ($ million)
Data Table on South Korea - Market size and forecast 2025-2030 ($ million)
Chart on South Korea - Year-over-year growth 2025-2030 (%)
Data Table on South Korea - Year-over-year growth 2025-2030 (%)

12.4.5 Australia - Market size and forecast 2025-2030

Chart on Australia - Market size and forecast 2025-2030 ($ million)
Data Table on Australia - Market size and forecast 2025-2030 ($ million)
Chart on Australia - Year-over-year growth 2025-2030 (%)
Data Table on Australia - Year-over-year growth 2025-2030 (%)

12.4.6 Indonesia - Market size and forecast 2025-2030

Chart on Indonesia - Market size and forecast 2025-2030 ($ million)
Data Table on Indonesia - Market size and forecast 2025-2030 ($ million)
Chart on Indonesia - Year-over-year growth 2025-2030 (%)
Data Table on Indonesia - Year-over-year growth 2025-2030 (%)

12.5 Europe - Market size and forecast 2025-2030

Chart on Europe - Market size and forecast 2025-2030 ($ million)
Data Table on Europe - Market size and forecast 2025-2030 ($ million)
Chart on Europe - Year-over-year growth 2025-2030 (%)
Data Table on Europe - Year-over-year growth 2025-2030 (%)
Chart on Regional Comparison - Europe
Data Table on Regional Comparison - Europe

12.5.1 Germany - Market size and forecast 2025-2030

Chart on Germany - Market size and forecast 2025-2030 ($ million)
Data Table on Germany - Market size and forecast 2025-2030 ($ million)
Chart on Germany - Year-over-year growth 2025-2030 (%)
Data Table on Germany - Year-over-year growth 2025-2030 (%)

12.5.2 UK - Market size and forecast 2025-2030

Chart on UK - Market size and forecast 2025-2030 ($ million)
Data Table on UK - Market size and forecast 2025-2030 ($ million)
Chart on UK - Year-over-year growth 2025-2030 (%)
Data Table on UK - Year-over-year growth 2025-2030 (%)

12.5.3 France - Market size and forecast 2025-2030

Chart on France - Market size and forecast 2025-2030 ($ million)
Data Table on France - Market size and forecast 2025-2030 ($ million)
Chart on France - Year-over-year growth 2025-2030 (%)
Data Table on France - Year-over-year growth 2025-2030 (%)

12.5.4 Italy - Market size and forecast 2025-2030

Chart on Italy - Market size and forecast 2025-2030 ($ million)
Data Table on Italy - Market size and forecast 2025-2030 ($ million)
Chart on Italy - Year-over-year growth 2025-2030 (%)
Data Table on Italy - Year-over-year growth 2025-2030 (%)

12.5.5 Spain - Market size and forecast 2025-2030

Chart on Spain - Market size and forecast 2025-2030 ($ million)
Data Table on Spain - Market size and forecast 2025-2030 ($ million)
Chart on Spain - Year-over-year growth 2025-2030 (%)
Data Table on Spain - Year-over-year growth 2025-2030 (%)

12.5.6 The Netherlands - Market size and forecast 2025-2030

Chart on The Netherlands - Market size and forecast 2025-2030 ($ million)
Data Table on The Netherlands - Market size and forecast 2025-2030 ($ million)
Chart on The Netherlands - Year-over-year growth 2025-2030 (%)
Data Table on The Netherlands - Year-over-year growth 2025-2030 (%)

12.6 South America - Market size and forecast 2025-2030

Chart on South America - Market size and forecast 2025-2030 ($ million)
Data Table on South America - Market size and forecast 2025-2030 ($ million)
Chart on South America - Year-over-year growth 2025-2030 (%)
Data Table on South America - Year-over-year growth 2025-2030 (%)
Chart on Regional Comparison - South America
Data Table on Regional Comparison - South America

12.6.1 Brazil - Market size and forecast 2025-2030

Chart on Brazil - Market size and forecast 2025-2030 ($ million)
Data Table on Brazil - Market size and forecast 2025-2030 ($ million)
Chart on Brazil - Year-over-year growth 2025-2030 (%)
Data Table on Brazil - Year-over-year growth 2025-2030 (%)

12.6.2 Argentina - Market size and forecast 2025-2030

Chart on Argentina - Market size and forecast 2025-2030 ($ million)
Data Table on Argentina - Market size and forecast 2025-2030 ($ million)
Chart on Argentina - Year-over-year growth 2025-2030 (%)
Data Table on Argentina - Year-over-year growth 2025-2030 (%)

12.6.3 Chile - Market size and forecast 2025-2030

Chart on Chile - Market size and forecast 2025-2030 ($ million)
Data Table on Chile - Market size and forecast 2025-2030 ($ million)
Chart on Chile - Year-over-year growth 2025-2030 (%)
Data Table on Chile - Year-over-year growth 2025-2030 (%)

12.7 Middle East and Africa - Market size and forecast 2025-2030

Chart on Middle East and Africa - Market size and forecast 2025-2030 ($ million)
Data Table on Middle East and Africa - Market size and forecast 2025-2030 ($ million)
Chart on Middle East and Africa - Year-over-year growth 2025-2030 (%)
Data Table on Middle East and Africa - Year-over-year growth 2025-2030 (%)
Chart on Regional Comparison - Middle East and Africa
Data Table on Regional Comparison - Middle East and Africa

12.7.1 Saudi Arabia - Market size and forecast 2025-2030

Chart on Saudi Arabia - Market size and forecast 2025-2030 ($ million)
Data Table on Saudi Arabia - Market size and forecast 2025-2030 ($ million)
Chart on Saudi Arabia - Year-over-year growth 2025-2030 (%)
Data Table on Saudi Arabia - Year-over-year growth 2025-2030 (%)

12.7.2 UAE - Market size and forecast 2025-2030

Chart on UAE - Market size and forecast 2025-2030 ($ million)
Data Table on UAE - Market size and forecast 2025-2030 ($ million)
Chart on UAE - Year-over-year growth 2025-2030 (%)
Data Table on UAE - Year-over-year growth 2025-2030 (%)

12.7.3 South Africa - Market size and forecast 2025-2030

Chart on South Africa - Market size and forecast 2025-2030 ($ million)
Data Table on South Africa - Market size and forecast 2025-2030 ($ million)
Chart on South Africa - Year-over-year growth 2025-2030 (%)
Data Table on South Africa - Year-over-year growth 2025-2030 (%)

12.7.4 Israel - Market size and forecast 2025-2030

Chart on Israel - Market size and forecast 2025-2030 ($ million)
Data Table on Israel - Market size and forecast 2025-2030 ($ million)
Chart on Israel - Year-over-year growth 2025-2030 (%)
Data Table on Israel - Year-over-year growth 2025-2030 (%)

12.7.5 Turkey - Market size and forecast 2025-2030

Chart on Turkey - Market size and forecast 2025-2030 ($ million)
Data Table on Turkey - Market size and forecast 2025-2030 ($ million)
Chart on Turkey - Year-over-year growth 2025-2030 (%)
Data Table on Turkey - Year-over-year growth 2025-2030 (%)

12.8 Market opportunity by geography

Market opportunity by geography ($ million)
Data Tables on Market opportunity by geography ($ million)

13. Drivers, Challenges, and Opportunity

13.1 Market drivers

Massive growth in data generated from varied sources
Increase in data safety and security concerns
Adoption of cloud-based data backup and recovery solutions

13.2 Market challenges

Complicated management of unstructured data
Availability of open-source alternatives reducing market demand
High cost of storage system

13.3 Impact of drivers and challenges

Impact of drivers and challenges in 2025 and 2030

13.4 Market opportunities

Rising popularity of blockchain solutions
Adoption of operational excellence, data quality management solutions
Rising cases of cyber-attacks and ransomware attacks

14. Competitive Landscape

14.1 Overview

14.2

Overview on criticality of inputs and factors of differentiation

14.3 Landscape disruption

Overview on factors of disruption

14.4 Industry risks

Impact of key risks on business

15. Competitive Analysis

15.1 Companies profiled

Companies covered

15.2 Company ranking index

15.3 Market positioning of companies

Matrix on companies position and classification

15.4 Cloudian Inc.

Cloudian Inc. - Overview
Cloudian Inc. - Product / Service
Cloudian Inc. - Key offerings
SWOT

15.5 Cohesity Inc.

Cohesity Inc. - Overview
Cohesity Inc. - Product / Service
Cohesity Inc. - Key offerings
SWOT

15.6 Dell Technologies Inc.

Dell Technologies Inc. - Overview
Dell Technologies Inc. - Business segments
Dell Technologies Inc. - Key offerings
Dell Technologies Inc. - Segment focus
SWOT

15.7 Druva Inc.

Druva Inc. - Overview
Druva Inc. - Product / Service
Druva Inc. - Key offerings
SWOT

15.8 Hewlett Packard Enterprise Co.

Hewlett Packard Enterprise Co. - Overview
Hewlett Packard Enterprise Co. - Business segments
Hewlett Packard Enterprise Co. - Key news
Hewlett Packard Enterprise Co. - Key offerings
Hewlett Packard Enterprise Co. - Segment focus
SWOT

15.9 IBM Corp.

IBM Corp. - Overview
IBM Corp. - Business segments
IBM Corp. - Key news
IBM Corp. - Key offerings
IBM Corp. - Segment focus
SWOT

15.10 Infinidat Ltd.

Infinidat Ltd. - Overview
Infinidat Ltd. - Product / Service
Infinidat Ltd. - Key offerings
SWOT

15.11 Kaseya Ltd.

Kaseya Ltd. - Overview
Kaseya Ltd. - Product / Service
Kaseya Ltd. - Key offerings
SWOT

15.12 NetApp Inc.

NetApp Inc. - Overview
NetApp Inc. - Business segments
NetApp Inc. - Key offerings
NetApp Inc. - Segment focus
SWOT

15.13 Nutanix Inc.

Nutanix Inc. - Overview
Nutanix Inc. - Product / Service
Nutanix Inc. - Key offerings
SWOT

15.14 Pure Storage Inc.

Pure Storage Inc. - Overview
Pure Storage Inc. - Business segments
Pure Storage Inc. - Key offerings
Pure Storage Inc. - Segment focus
SWOT

15.15 Quantum Corp.

Quantum Corp. - Overview
Quantum Corp. - Product / Service
Quantum Corp. - Key offerings
SWOT

15.16 Rubrik Inc.

Rubrik Inc. - Overview
Rubrik Inc. - Product / Service
Rubrik Inc. - Key offerings
SWOT

15.17 Veeam Software Group GmbH

Veeam Software Group GmbH - Overview
Veeam Software Group GmbH - Product / Service
Veeam Software Group GmbH - Key offerings
SWOT

15.18 Zscaler Inc.

Zscaler Inc. - Overview
Zscaler Inc. - Product / Service
Zscaler Inc. - Key offerings
SWOT

16. Appendix

16.1 Scope of the report

Market definition
Objectives
Notes and caveats

16.2 Inclusions and exclusions checklist

Inclusions checklist
Exclusions checklist

16.3 Currency conversion rates for US$

16.4 Research methodology

16.5 Data procurement

Information sources

16.6 Data validation

16.7 Validation techniques employed for market sizing

16.8 Data synthesis

16.9 360 degree market analysis

16.10 List of abbreviations

Research Methodology

Technavio presents a detailed picture of the market by way of study, synthesis, and summation of data from multiple sources. The analysts have presented the various facets of the market with a particular focus on identifying the key industry influencers. The data thus presented is comprehensive, reliable, and the result of extensive research, both primary and secondary.

INFORMATION SOURCES

Primary sources

  • Manufacturers and suppliers
  • Channel partners
  • Industry experts
  • Strategic decision makers

Secondary sources

  • Industry journals and periodicals
  • Government data
  • Financial reports of key industry players
  • Historical data
  • Press releases

DATA ANALYSIS

Data Synthesis

  • Collation of data
  • Estimation of key figures
  • Analysis of derived insights

Data Validation

  • Triangulation with data models
  • Reference against proprietary databases
  • Corroboration with industry experts

REPORT WRITING

Qualitative

  • Market drivers
  • Market challenges
  • Market trends
  • Five forces analysis

Quantitative

  • Market size and forecast
  • Market segmentation
  • Geographical insights
  • Competitive landscape

Interested in this report?

Get your sample now to see our research methodology and insights!

Download Now

Frequently Asked Questions

Data Resiliency market growth will increase by USD 37549.1 million during 2026-2030.

The Data Resiliency market is expected to grow at a CAGR of 21.8% during 2026-2030.

Data Resiliency market is segmented by Deployment (On-premises, Cloud) Component (Solution, Service) End-user (Large enterprises, SMEs)

Arcserve USA LLC, Asigra Inc., Cloudian Inc., Cohesity Inc., Commvault Systems Inc., Dell Technologies Inc., Druva Inc., Hewlett Packard Enterprise Co., IBM Corp., Infinidat Ltd., Kaseya Ltd., NetApp Inc., Nutanix Inc., Pure Storage Inc., Quantum Corp., Rubrik Inc., Unitrends Inc., Veeam Software Group GmbH, Veritas Technologies LLC, Zscaler Inc. are a few of the key vendors in the Data Resiliency market.

North America will register the highest growth rate of 38.3% among the other regions. Therefore, the Data Resiliency market in North America is expected to garner significant business opportunities for the vendors during the forecast period.

US, Canada, Mexico, China, Japan, India, South Korea, Australia, Indonesia, Germany, UK, France, Italy, Spain, The Netherlands, Brazil, Argentina, Chile, Saudi Arabia, UAE, South Africa, Israel, Turkey

  • Massive growth in data generated from varied sources is the driving factor this market.

The Data Resiliency market vendors should focus on grabbing business opportunities from the Deployment segment as it accounted for the largest market share in the base year.
RIA - Research AI Assistant
Ask RIA